


Where in Maryland are you looking?
Browse communities by city.
AberdeenAccokeekAdelphiAnnapolisAnne Arundel CountyBaltimoreBeltsvilleBethesdaBowieCambridgeCatonsvilleChevy ChaseClintonColumbiaCoral HillsEastonElktonEllicott CityForest HillFort WashingtonFrederickGaithersburgGermantownGlen BurnieHagerstownHarford CountyHoward CountyHyattsvilleMarlboroMontgomery CountyOdentonPikesvillePotomacPrince George's CountyQueenstownRockvilleSalisburySandy SpringSeverna ParkSilver SpringTemple HillsTowsonWaldorfWashington County
Compare Assisted Living around Maryland
The information below is reported by the Maryland Department of Health, Office of Health Care Quality.
| Sunrise of Silver Spring | AL HC MC RC | Silver Spring (New Hampshire Avenue) | 84
Facility
84
MD AVG
43
Rank
#170 / 697 | Yes |
40
Facility
40
MD AVG
43
Rank
#523 / 985 | Studio / 1 Bed / 2 Bed | 24
Facility
24
MD AVG
21
Rank
#92 / 208 | - |
31% Male Residents — State Benchmarked 31% of residents are male, compared to the Maryland average of 31%. This facility caters to a majority female resident pool (69% female), consistent with the broader assisted living trend where women significantly outnumber men. |
69% Female Residents — State Benchmarked 69% of residents are female, compared to the Maryland average of 69%. Women comprise the large majority, consistent with national assisted living demographics where women live longer and enter care facilities at higher rates. |
53% White Residents — State Benchmarked 53% of residents are reported as White, compared to the Maryland average of 81%. A lower White share than the Maryland average — the community may draw a more diverse resident mix relative to other facilities in Maryland. |
39% African American Residents — State Benchmarked 39% of residents are reported as African American or Black, compared to the Maryland average of 13%. A higher African American share than the typical Maryland average — useful context when comparing cultural fit and community composition. |
9% Other Ethnicity Residents — State Benchmarked 9% of residents fall into categories other than White or African American (combined), compared to the Maryland average of 6%. This column aggregates Hispanic, Asian, multiracial, and any other labeled groups that are not classified as White or African American. Reported subgroups in this total: Asian (4%), Hawaiian/Pacific Islander (3%), Hispanic (1%). |
4% Residents Age 65–74 — State Benchmarked 4% of residents are 65–74, compared to the Maryland average of 13%. Fewer younger seniors suggests the resident population skews older, likely requiring higher acuity care and more hands-on support. |
43% Residents Age 75–84 — State Benchmarked 43% of residents are 75–84, compared to the Maryland average of 31%. A high concentration in this mid-range bracket, where residents typically need moderate support with daily activities. |
37% Residents Age 85–94 — State Benchmarked 37% of residents are 85–94, compared to the Maryland average of 44%. The population here skews younger than the statewide norm, which may indicate a more active, lower-acuity community. |
14% Residents Age 95+ — State Benchmarked 14% of residents are 95 or older, compared to the Maryland average of 16%. In line with the statewide profile for the oldest resident bracket. |
| Brightview Annapolis | AL IL MC | Annapolis | 85
Facility
85
MD AVG
43
Rank
#168 / 697 | Yes |
34
Facility
34
MD AVG
43
Rank
#590 / 985 | Studio / 1 Bed / 2 Bed | 8
Facility
8
MD AVG
21
Rank
#162 / 208 | - |
27% Male Residents — State Benchmarked 27% of residents are male, compared to the Maryland average of 31%. This facility caters to a majority female resident pool (73% female), consistent with the broader assisted living trend where women significantly outnumber men. |
73% Female Residents — State Benchmarked 73% of residents are female, compared to the Maryland average of 69%. Women comprise the large majority, consistent with national assisted living demographics where women live longer and enter care facilities at higher rates. |
97% White Residents — State Benchmarked 97% of residents are reported as White, compared to the Maryland average of 81%. A higher White share than is typical for assisted living in Maryland in this dataset — compare with peer facilities for local context. |
0% African American Residents — State Benchmarked 0% of residents are reported as African American or Black, compared to the Maryland average of 13%. A lower African American share than is typical in Maryland; local markets still vary widely. |
3% Other Ethnicity Residents — State Benchmarked 3% of residents fall into categories other than White or African American (combined), compared to the Maryland average of 6%. This column aggregates Hispanic, Asian, multiracial, and any other labeled groups that are not classified as White or African American. Reported subgroups in this total: Hispanic (3%). |
3% Residents Age 65–74 — State Benchmarked 3% of residents are 65–74, compared to the Maryland average of 13%. Fewer younger seniors suggests the resident population skews older, likely requiring higher acuity care and more hands-on support. |
27% Residents Age 75–84 — State Benchmarked 27% of residents are 75–84, compared to the Maryland average of 31%. This is the second most common age bracket in assisted living, representing residents with moderate care needs. |
59% Residents Age 85–94 — State Benchmarked 59% of residents are 85–94, compared to the Maryland average of 44%. A high concentration of very elderly residents signals a higher-acuity facility with experience caring for advanced age-related needs. |
9% Residents Age 95+ — State Benchmarked 9% of residents are 95 or older, compared to the Maryland average of 16%. Most residents here have not yet reached the oldest-old bracket, suggesting a younger overall community. |
| Modena Reserve at Kensington | AL IL MC | Kensington (Metropolitan Avenue) | 80
Facility
80
MD AVG
43
Rank
#176 / 697 | No |
85
Facility
85
MD AVG
43
Rank
#54 / 985 | - | 4
Facility
4
MD AVG
21
Rank
#191 / 208 | - | - | - | - | - | - | - | - | - | - |
| Bay Village of Annapolis | AL NH | Annapolis | 88
Facility
88
MD AVG
43
Rank
#162 / 697 | Yes |
75
Facility
75
MD AVG
43
Rank
#131 / 985 | Studio / 1 Bed | 5
Facility
5
MD AVG
21
Rank
#182 / 208 | - |
32% Male Residents — State Benchmarked 32% of residents are male, compared to the Maryland average of 31%. This facility caters to a majority female resident pool (68% female), consistent with the broader assisted living trend where women significantly outnumber men. |
68% Female Residents — State Benchmarked 68% of residents are female, compared to the Maryland average of 69%. Women comprise the large majority, consistent with national assisted living demographics where women live longer and enter care facilities at higher rates. |
99% White Residents — State Benchmarked 99% of residents are reported as White, compared to the Maryland average of 81%. A higher White share than is typical for assisted living in Maryland in this dataset — compare with peer facilities for local context. |
0% African American Residents — State Benchmarked 0% of residents are reported as African American or Black, compared to the Maryland average of 13%. A lower African American share than is typical in Maryland; local markets still vary widely. |
1% Other Ethnicity Residents — State Benchmarked 1% of residents fall into categories other than White or African American (combined), compared to the Maryland average of 6%. This column aggregates Hispanic, Asian, multiracial, and any other labeled groups that are not classified as White or African American. Reported subgroups in this total: Hispanic (1%). |
14% Residents Age 65–74 — State Benchmarked 14% of residents are 65–74, compared to the Maryland average of 13%. In line with the statewide profile for this youngest senior bracket in assisted living. |
28% Residents Age 75–84 — State Benchmarked 28% of residents are 75–84, compared to the Maryland average of 31%. This is the second most common age bracket in assisted living, representing residents with moderate care needs. |
50% Residents Age 85–94 — State Benchmarked 50% of residents are 85–94, compared to the Maryland average of 44%. A high concentration of very elderly residents signals a higher-acuity facility with experience caring for advanced age-related needs. |
8% Residents Age 95+ — State Benchmarked 8% of residents are 95 or older, compared to the Maryland average of 16%. Most residents here have not yet reached the oldest-old bracket, suggesting a younger overall community. |
| Brightview Rolling Hills | AL MC | Catonsville (College Hills) | 81
Facility
81
MD AVG
43
Rank
#174 / 697 | Yes |
19
Facility
19
MD AVG
43
Rank
#746 / 985 | Studio / 1 Bed /2 Bed | 8
Facility
8
MD AVG
21
Rank
#162 / 208 | - |
16% Male Residents — State Benchmarked 16% of residents are male, compared to the Maryland average of 31%. This facility caters to a majority female resident pool (84% female), consistent with the broader assisted living trend where women significantly outnumber men. |
84% Female Residents — State Benchmarked 84% of residents are female, compared to the Maryland average of 69%. Women comprise the large majority, consistent with national assisted living demographics where women live longer and enter care facilities at higher rates. |
95% White Residents — State Benchmarked 95% of residents are reported as White, compared to the Maryland average of 81%. A higher White share than is typical for assisted living in Maryland in this dataset — compare with peer facilities for local context. |
3% African American Residents — State Benchmarked 3% of residents are reported as African American or Black, compared to the Maryland average of 13%. A lower African American share than is typical in Maryland; local markets still vary widely. |
2% Other Ethnicity Residents — State Benchmarked 2% of residents fall into categories other than White or African American (combined), compared to the Maryland average of 6%. This column aggregates Hispanic, Asian, multiracial, and any other labeled groups that are not classified as White or African American. Reported subgroups in this total: Asian (2%). | - |
8% Residents Age 75–84 — State Benchmarked 8% of residents are 75–84, compared to the Maryland average of 31%. Below the state norm — the resident mix may skew either younger or older than this typical middle bracket. |
83% Residents Age 85–94 — State Benchmarked 83% of residents are 85–94, compared to the Maryland average of 44%. A high concentration of very elderly residents signals a higher-acuity facility with experience caring for advanced age-related needs. |
10% Residents Age 95+ — State Benchmarked 10% of residents are 95 or older, compared to the Maryland average of 16%. Most residents here have not yet reached the oldest-old bracket, suggesting a younger overall community. |
| Brightview Mays Chapel Ridge | AL IL MC | Timonium (Dixon Hill) | 89
Facility
89
MD AVG
43
Rank
#160 / 697 | No |
52
Facility
52
MD AVG
43
Rank
#402 / 985 | Studio / 1 Bed / 2 Bed | 50
Facility
50
MD AVG
21
Rank
#1 / 208 | A+ |
13% Male Residents — State Benchmarked 13% of residents are male, compared to the Maryland average of 31%. This facility caters to a majority female resident pool (87% female), consistent with the broader assisted living trend where women significantly outnumber men. |
87% Female Residents — State Benchmarked 87% of residents are female, compared to the Maryland average of 69%. Women comprise the large majority, consistent with national assisted living demographics where women live longer and enter care facilities at higher rates. |
99% White Residents — State Benchmarked 99% of residents are reported as White, compared to the Maryland average of 81%. A higher White share than is typical for assisted living in Maryland in this dataset — compare with peer facilities for local context. |
0% African American Residents — State Benchmarked 0% of residents are reported as African American or Black, compared to the Maryland average of 13%. A lower African American share than is typical in Maryland; local markets still vary widely. |
1% Other Ethnicity Residents — State Benchmarked 1% of residents fall into categories other than White or African American (combined), compared to the Maryland average of 6%. This column aggregates Hispanic, Asian, multiracial, and any other labeled groups that are not classified as White or African American. Reported subgroups in this total: Asian (1%). |
3% Residents Age 65–74 — State Benchmarked 3% of residents are 65–74, compared to the Maryland average of 13%. Fewer younger seniors suggests the resident population skews older, likely requiring higher acuity care and more hands-on support. |
30% Residents Age 75–84 — State Benchmarked 30% of residents are 75–84, compared to the Maryland average of 31%. This is the second most common age bracket in assisted living, representing residents with moderate care needs. |
48% Residents Age 85–94 — State Benchmarked 48% of residents are 85–94, compared to the Maryland average of 44%. This is typically the most common age bracket in assisted living — this facility is in line with the statewide norm. |
18% Residents Age 95+ — State Benchmarked 18% of residents are 95 or older, compared to the Maryland average of 16%. In line with the statewide profile for the oldest resident bracket. |
| Brightview Crofton Riverwalk | AL IL MC | Crofton | 92
Facility
92
MD AVG
43
Rank
#155 / 697 | Yes |
45
Facility
45
MD AVG
43
Rank
#475 / 985 | Studio / 1 Bed / 2 Bed | 6
Facility
6
MD AVG
21
Rank
#176 / 208 | - |
27% Male Residents — State Benchmarked 27% of residents are male, compared to the Maryland average of 31%. This facility caters to a majority female resident pool (73% female), consistent with the broader assisted living trend where women significantly outnumber men. |
73% Female Residents — State Benchmarked 73% of residents are female, compared to the Maryland average of 69%. Women comprise the large majority, consistent with national assisted living demographics where women live longer and enter care facilities at higher rates. |
0% White Residents — State Benchmarked 0% of residents are reported as White, compared to the Maryland average of 81%. A lower White share than the Maryland average — the community may draw a more diverse resident mix relative to other facilities in Maryland. |
0% African American Residents — State Benchmarked 0% of residents are reported as African American or Black, compared to the Maryland average of 13%. A lower African American share than is typical in Maryland; local markets still vary widely. |
100% Other Ethnicity Residents — State Benchmarked 100% of residents fall into categories other than White or African American (combined), compared to the Maryland average of 6%. This column aggregates Hispanic, Asian, multiracial, and any other labeled groups that are not classified as White or African American. Reported subgroups in this total: Other (100%). | - | - | - | - |
| Sunrise of Frederick | AL MC | Frederick (Waterford) | 88
Facility
88
MD AVG
43
Rank
#162 / 697 | Yes |
62
Facility
62
MD AVG
43
Rank
#286 / 985 | Studio / Suite / 2 Bed | 45
Facility
45
MD AVG
21
Rank
#4 / 208 | A- |
31% Male Residents — State Benchmarked 31% of residents are male, compared to the Maryland average of 31%. This facility caters to a majority female resident pool (69% female), consistent with the broader assisted living trend where women significantly outnumber men. |
69% Female Residents — State Benchmarked 69% of residents are female, compared to the Maryland average of 69%. Women comprise the large majority, consistent with national assisted living demographics where women live longer and enter care facilities at higher rates. |
97% White Residents — State Benchmarked 97% of residents are reported as White, compared to the Maryland average of 81%. A higher White share than is typical for assisted living in Maryland in this dataset — compare with peer facilities for local context. |
2% African American Residents — State Benchmarked 2% of residents are reported as African American or Black, compared to the Maryland average of 13%. A lower African American share than is typical in Maryland; local markets still vary widely. |
2% Other Ethnicity Residents — State Benchmarked 2% of residents fall into categories other than White or African American (combined), compared to the Maryland average of 6%. This column aggregates Hispanic, Asian, multiracial, and any other labeled groups that are not classified as White or African American. Reported subgroups in this total: Hispanic (2%). |
10% Residents Age 65–74 — State Benchmarked 10% of residents are 65–74, compared to the Maryland average of 13%. Fewer younger seniors suggests the resident population skews older, likely requiring higher acuity care and more hands-on support. |
34% Residents Age 75–84 — State Benchmarked 34% of residents are 75–84, compared to the Maryland average of 31%. This is the second most common age bracket in assisted living, representing residents with moderate care needs. |
48% Residents Age 85–94 — State Benchmarked 48% of residents are 85–94, compared to the Maryland average of 44%. This is typically the most common age bracket in assisted living — this facility is in line with the statewide norm. |
6% Residents Age 95+ — State Benchmarked 6% of residents are 95 or older, compared to the Maryland average of 16%. Most residents here have not yet reached the oldest-old bracket, suggesting a younger overall community. |
| Sunrise of Rockville | AL | Rockville (Baltimore Road) | 89
Facility
89
MD AVG
43
Rank
#160 / 697 | Yes |
89
Facility
89
MD AVG
43
Rank
#32 / 985 | Studio / 1 Bed / 2 Bed | 45
Facility
45
MD AVG
21
Rank
#4 / 208 | A- |
23% Male Residents — State Benchmarked 23% of residents are male, compared to the Maryland average of 31%. This facility caters to a majority female resident pool (77% female), consistent with the broader assisted living trend where women significantly outnumber men. |
77% Female Residents — State Benchmarked 77% of residents are female, compared to the Maryland average of 69%. Women comprise the large majority, consistent with national assisted living demographics where women live longer and enter care facilities at higher rates. |
87% White Residents — State Benchmarked 87% of residents are reported as White, compared to the Maryland average of 81%. Close to the average for this category among assisted living facilities in Maryland with reported race/ethnicity data. |
2% African American Residents — State Benchmarked 2% of residents are reported as African American or Black, compared to the Maryland average of 13%. A lower African American share than is typical in Maryland; local markets still vary widely. |
11% Other Ethnicity Residents — State Benchmarked 11% of residents fall into categories other than White or African American (combined), compared to the Maryland average of 6%. This column aggregates Hispanic, Asian, multiracial, and any other labeled groups that are not classified as White or African American. Reported subgroups in this total: Mixed Race (6%), Hispanic (3%), Asian (2%). |
3% Residents Age 65–74 — State Benchmarked 3% of residents are 65–74, compared to the Maryland average of 13%. Fewer younger seniors suggests the resident population skews older, likely requiring higher acuity care and more hands-on support. |
31% Residents Age 75–84 — State Benchmarked 31% of residents are 75–84, compared to the Maryland average of 31%. This is the second most common age bracket in assisted living, representing residents with moderate care needs. |
56% Residents Age 85–94 — State Benchmarked 56% of residents are 85–94, compared to the Maryland average of 44%. A high concentration of very elderly residents signals a higher-acuity facility with experience caring for advanced age-related needs. |
10% Residents Age 95+ — State Benchmarked 10% of residents are 95 or older, compared to the Maryland average of 16%. Most residents here have not yet reached the oldest-old bracket, suggesting a younger overall community. |
| Arbor Terrace at Waugh Chapel | AL MC | Gambrills (Waugh Chapel Towne Centre) | 96
Facility
96
MD AVG
43
Rank
#140 / 697 | No |
47
Facility
47
MD AVG
43
Rank
#459 / 985 | - | 4
Facility
4
MD AVG
21
Rank
#191 / 208 | A+ |
30% Male Residents — State Benchmarked 30% of residents are male, compared to the Maryland average of 31%. This facility caters to a majority female resident pool (70% female), consistent with the broader assisted living trend where women significantly outnumber men. |
70% Female Residents — State Benchmarked 70% of residents are female, compared to the Maryland average of 69%. Women comprise the large majority, consistent with national assisted living demographics where women live longer and enter care facilities at higher rates. |
86% White Residents — State Benchmarked 86% of residents are reported as White, compared to the Maryland average of 81%. Close to the average for this category among assisted living facilities in Maryland with reported race/ethnicity data. |
12% African American Residents — State Benchmarked 12% of residents are reported as African American or Black, compared to the Maryland average of 13%. In line with the Maryland average for African American residents among facilities reporting this breakdown. |
3% Other Ethnicity Residents — State Benchmarked 3% of residents fall into categories other than White or African American (combined), compared to the Maryland average of 6%. This column aggregates Hispanic, Asian, multiracial, and any other labeled groups that are not classified as White or African American. Reported subgroups in this total: Asian (1%), Hawaiian/Pacific Islander (1%). |
10% Residents Age 65–74 — State Benchmarked 10% of residents are 65–74, compared to the Maryland average of 13%. Fewer younger seniors suggests the resident population skews older, likely requiring higher acuity care and more hands-on support. |
43% Residents Age 75–84 — State Benchmarked 43% of residents are 75–84, compared to the Maryland average of 31%. A high concentration in this mid-range bracket, where residents typically need moderate support with daily activities. |
39% Residents Age 85–94 — State Benchmarked 39% of residents are 85–94, compared to the Maryland average of 44%. This is typically the most common age bracket in assisted living — this facility is in line with the statewide norm. |
8% Residents Age 95+ — State Benchmarked 8% of residents are 95 or older, compared to the Maryland average of 16%. Most residents here have not yet reached the oldest-old bracket, suggesting a younger overall community. |
| Celebration Villa of Manresa | AL RC | Annapolis (Arnold) | 86
Facility
86
MD AVG
43
Rank
#167 / 697 | Yes |
2
Facility
2
MD AVG
43
Rank
#940 / 985 | Studio / 1 Bed | 3
Facility
3
MD AVG
21
Rank
#201 / 208 | - |
35% Male Residents — State Benchmarked 35% of residents are male, compared to the Maryland average of 31%. This facility caters to a majority female resident pool (65% female), consistent with the broader assisted living trend where women significantly outnumber men. |
65% Female Residents — State Benchmarked 65% of residents are female, compared to the Maryland average of 69%. Women comprise the large majority, consistent with national assisted living demographics where women live longer and enter care facilities at higher rates. |
97% White Residents — State Benchmarked 97% of residents are reported as White, compared to the Maryland average of 81%. A higher White share than is typical for assisted living in Maryland in this dataset — compare with peer facilities for local context. |
3% African American Residents — State Benchmarked 3% of residents are reported as African American or Black, compared to the Maryland average of 13%. A lower African American share than is typical in Maryland; local markets still vary widely. |
0% Other Ethnicity Residents — State Benchmarked 0% of residents fall into categories other than White or African American (combined), compared to the Maryland average of 6%. This column aggregates Hispanic, Asian, multiracial, and any other labeled groups that are not classified as White or African American. |
8% Residents Age 65–74 — State Benchmarked 8% of residents are 65–74, compared to the Maryland average of 13%. Fewer younger seniors suggests the resident population skews older, likely requiring higher acuity care and more hands-on support. |
52% Residents Age 75–84 — State Benchmarked 52% of residents are 75–84, compared to the Maryland average of 31%. A high concentration in this mid-range bracket, where residents typically need moderate support with daily activities. |
27% Residents Age 85–94 — State Benchmarked 27% of residents are 85–94, compared to the Maryland average of 44%. The population here skews younger than the statewide norm, which may indicate a more active, lower-acuity community. |
13% Residents Age 95+ — State Benchmarked 13% of residents are 95 or older, compared to the Maryland average of 16%. In line with the statewide profile for the oldest resident bracket. |
| Queenstown Landing | AL MC RC | Queenstown | 78
Facility
78
MD AVG
43
Rank
#181 / 697 | No |
10
Facility
10
MD AVG
43
Rank
#837 / 985 | - | 5
Facility
5
MD AVG
21
Rank
#182 / 208 | - |
35% Male Residents — State Benchmarked 35% of residents are male, compared to the Maryland average of 31%. This facility caters to a majority female resident pool (65% female), consistent with the broader assisted living trend where women significantly outnumber men. |
65% Female Residents — State Benchmarked 65% of residents are female, compared to the Maryland average of 69%. Women comprise the large majority, consistent with national assisted living demographics where women live longer and enter care facilities at higher rates. |
98% White Residents — State Benchmarked 98% of residents are reported as White, compared to the Maryland average of 81%. A higher White share than is typical for assisted living in Maryland in this dataset — compare with peer facilities for local context. |
2% African American Residents — State Benchmarked 2% of residents are reported as African American or Black, compared to the Maryland average of 13%. A lower African American share than is typical in Maryland; local markets still vary widely. |
0% Other Ethnicity Residents — State Benchmarked 0% of residents fall into categories other than White or African American (combined), compared to the Maryland average of 6%. This column aggregates Hispanic, Asian, multiracial, and any other labeled groups that are not classified as White or African American. | - |
5% Residents Age 75–84 — State Benchmarked 5% of residents are 75–84, compared to the Maryland average of 31%. Below the state norm — the resident mix may skew either younger or older than this typical middle bracket. |
88% Residents Age 85–94 — State Benchmarked 88% of residents are 85–94, compared to the Maryland average of 44%. A high concentration of very elderly residents signals a higher-acuity facility with experience caring for advanced age-related needs. |
7% Residents Age 95+ — State Benchmarked 7% of residents are 95 or older, compared to the Maryland average of 16%. Most residents here have not yet reached the oldest-old bracket, suggesting a younger overall community. |
| Arbor Terrace Waugh Chapel | AL MC | Gambrills (Waugh Chapel Towne Centre) | 96
Facility
96
MD AVG
43
Rank
#140 / 697 | Yes |
47
Facility
47
MD AVG
43
Rank
#459 / 985 | Studio / 1 Bed / 2 Bed | 4
Facility
4
MD AVG
21
Rank
#191 / 208 | A+ |
30% Male Residents — State Benchmarked 30% of residents are male, compared to the Maryland average of 31%. This facility caters to a majority female resident pool (70% female), consistent with the broader assisted living trend where women significantly outnumber men. |
70% Female Residents — State Benchmarked 70% of residents are female, compared to the Maryland average of 69%. Women comprise the large majority, consistent with national assisted living demographics where women live longer and enter care facilities at higher rates. |
86% White Residents — State Benchmarked 86% of residents are reported as White, compared to the Maryland average of 81%. Close to the average for this category among assisted living facilities in Maryland with reported race/ethnicity data. |
12% African American Residents — State Benchmarked 12% of residents are reported as African American or Black, compared to the Maryland average of 13%. In line with the Maryland average for African American residents among facilities reporting this breakdown. |
3% Other Ethnicity Residents — State Benchmarked 3% of residents fall into categories other than White or African American (combined), compared to the Maryland average of 6%. This column aggregates Hispanic, Asian, multiracial, and any other labeled groups that are not classified as White or African American. Reported subgroups in this total: Asian (1%), Hawaiian/Pacific Islander (1%). |
10% Residents Age 65–74 — State Benchmarked 10% of residents are 65–74, compared to the Maryland average of 13%. Fewer younger seniors suggests the resident population skews older, likely requiring higher acuity care and more hands-on support. |
43% Residents Age 75–84 — State Benchmarked 43% of residents are 75–84, compared to the Maryland average of 31%. A high concentration in this mid-range bracket, where residents typically need moderate support with daily activities. |
39% Residents Age 85–94 — State Benchmarked 39% of residents are 85–94, compared to the Maryland average of 44%. This is typically the most common age bracket in assisted living — this facility is in line with the statewide norm. |
8% Residents Age 95+ — State Benchmarked 8% of residents are 95 or older, compared to the Maryland average of 16%. Most residents here have not yet reached the oldest-old bracket, suggesting a younger overall community. |
| Brookdale Olney | AL MC | Olney (Olney Estates) | 94
Facility
94
MD AVG
43
Rank
#148 / 697 | Yes |
16
Facility
16
MD AVG
43
Rank
#772 / 985 | Studio / 1 Bed / 2 Bed | 13
Facility
13
MD AVG
21
Rank
#141 / 208 | - |
33% Male Residents — State Benchmarked 33% of residents are male, compared to the Maryland average of 31%. This facility caters to a majority female resident pool (67% female), consistent with the broader assisted living trend where women significantly outnumber men. |
67% Female Residents — State Benchmarked 67% of residents are female, compared to the Maryland average of 69%. Women comprise the large majority, consistent with national assisted living demographics where women live longer and enter care facilities at higher rates. |
94% White Residents — State Benchmarked 94% of residents are reported as White, compared to the Maryland average of 81%. A higher White share than is typical for assisted living in Maryland in this dataset — compare with peer facilities for local context. |
3% African American Residents — State Benchmarked 3% of residents are reported as African American or Black, compared to the Maryland average of 13%. A lower African American share than is typical in Maryland; local markets still vary widely. |
3% Other Ethnicity Residents — State Benchmarked 3% of residents fall into categories other than White or African American (combined), compared to the Maryland average of 6%. This column aggregates Hispanic, Asian, multiracial, and any other labeled groups that are not classified as White or African American. Reported subgroups in this total: Asian (3%). |
8% Residents Age 65–74 — State Benchmarked 8% of residents are 65–74, compared to the Maryland average of 13%. Fewer younger seniors suggests the resident population skews older, likely requiring higher acuity care and more hands-on support. |
39% Residents Age 75–84 — State Benchmarked 39% of residents are 75–84, compared to the Maryland average of 31%. A high concentration in this mid-range bracket, where residents typically need moderate support with daily activities. |
22% Residents Age 85–94 — State Benchmarked 22% of residents are 85–94, compared to the Maryland average of 44%. The population here skews younger than the statewide norm, which may indicate a more active, lower-acuity community. |
28% Residents Age 95+ — State Benchmarked 28% of residents are 95 or older, compared to the Maryland average of 16%. A high proportion of the oldest-old suggests strong end-of-life care experience and very-high-acuity capabilities. |
| Charter Senior Living of Towson | AL MC | Baltimore (The Orchards) | 92
Facility
92
MD AVG
43
Rank
#155 / 697 | No |
36
Facility
36
MD AVG
43
Rank
#563 / 985 | Studio / 1 Bed | 5
Facility
5
MD AVG
21
Rank
#182 / 208 | - |
25% Male Residents — State Benchmarked 25% of residents are male, compared to the Maryland average of 31%. This facility caters to a majority female resident pool (75% female), consistent with the broader assisted living trend where women significantly outnumber men. |
75% Female Residents — State Benchmarked 75% of residents are female, compared to the Maryland average of 69%. Women comprise the large majority, consistent with national assisted living demographics where women live longer and enter care facilities at higher rates. |
88% White Residents — State Benchmarked 88% of residents are reported as White, compared to the Maryland average of 81%. Close to the average for this category among assisted living facilities in Maryland with reported race/ethnicity data. |
7% African American Residents — State Benchmarked 7% of residents are reported as African American or Black, compared to the Maryland average of 13%. In line with the Maryland average for African American residents among facilities reporting this breakdown. |
4% Other Ethnicity Residents — State Benchmarked 4% of residents fall into categories other than White or African American (combined), compared to the Maryland average of 6%. This column aggregates Hispanic, Asian, multiracial, and any other labeled groups that are not classified as White or African American. Reported subgroups in this total: Asian (3%), Hispanic (1%). | - |
22% Residents Age 75–84 — State Benchmarked 22% of residents are 75–84, compared to the Maryland average of 31%. Below the state norm — the resident mix may skew either younger or older than this typical middle bracket. |
60% Residents Age 85–94 — State Benchmarked 60% of residents are 85–94, compared to the Maryland average of 44%. A high concentration of very elderly residents signals a higher-acuity facility with experience caring for advanced age-related needs. |
15% Residents Age 95+ — State Benchmarked 15% of residents are 95 or older, compared to the Maryland average of 16%. In line with the statewide profile for the oldest resident bracket. |
Rows per page:

View all Nearby Homes
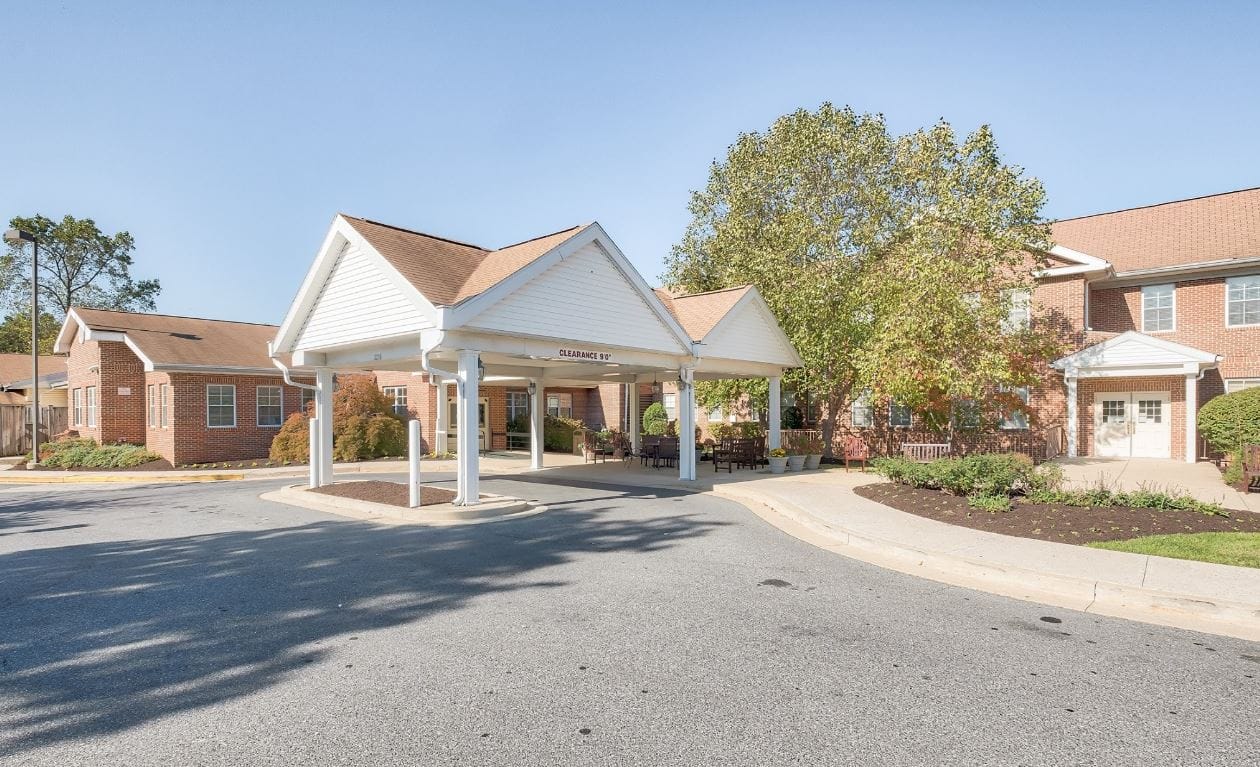
Overview of Sterling Care Hillhaven Assisted Living and Memory Care


Situated in the heart of Adelphi, MD, the Sterling Care Hillhaven Assisted Living and Memory Care is an esteemed senior living community offering assisted living, independent living, memory care, long-term skilled nursing care, short-term rehabilitation, and dialysis services. Beautifully appointed and spacious accommodations with several floor plans are available for its residents. In terms of memory care, those with cognitive conditions undergo their Life Engagement Programming which aims to foster meaningful conversations and promote a fulfilling lifestyle.
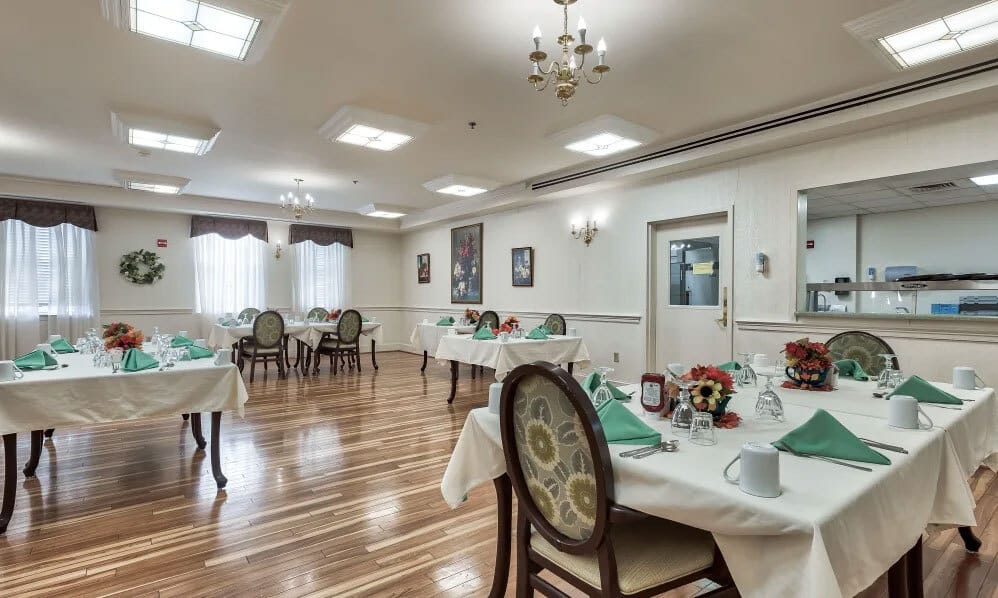
With its top-of-the-line amenities and services, residents can enjoy the following: family lounge, beauty salon, expansive wellness/rehabilitation gym, specialized diets, cable television/telephone, free wi-fi, and smoke-free community. Moreover, the community offers medical services such as diabetes management, orthopedic therapy, and medication administration. Engage in planned daily activities including outings religious services, music concerts, table games, and exercise. Meet new companions and create unforgettable memories within the amazing shared spaces of this community. Equipped with the right tools and people, seniors are guaranteed an all-encompassing living experience with Sterling Care Hillhaven Assisted Living and Memory Care.
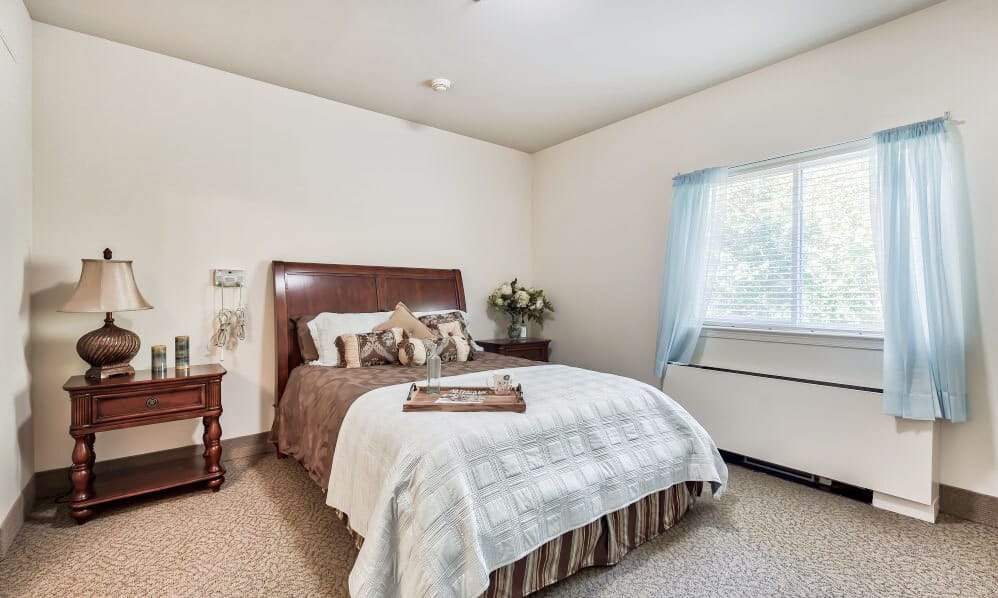
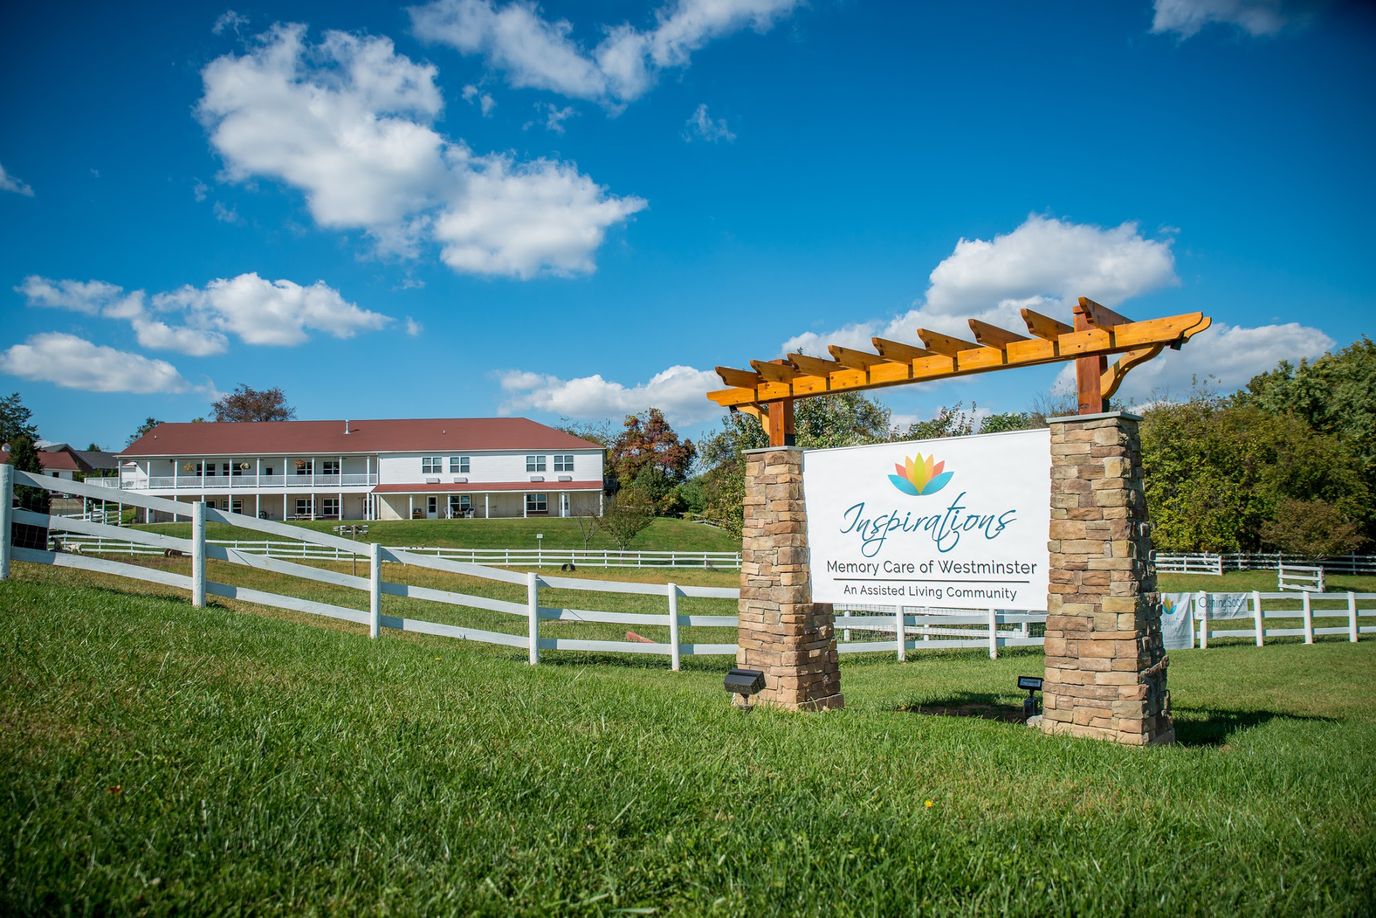
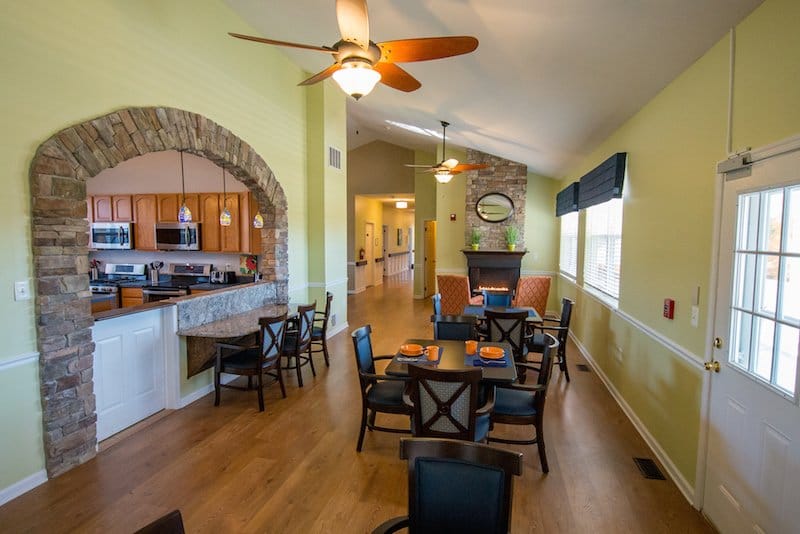
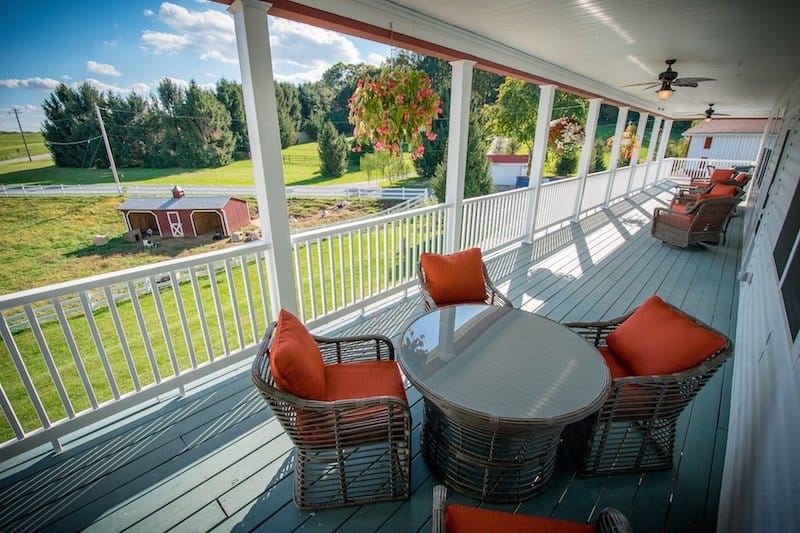
Blanketed by lush trees and vast green spaces, Inspirations Memory Care of Westminster is a peaceful community in Westminster, MD dedicated to those facing memory loss. They welcome residents into bright, colorful, and spacious accommodations that keep them cozy and safe. The community guarantees focused care and attention with its superb caregiver-to-resident ratio and customized care plans.
Taking residents’ wellness a high priority, the community regularly organizes an array of enriching activities to keep them active and healthy meals to keep them properly nourished. Additionally, their farm-like setting, secured porches, and courtyard promote relaxation and cozy spaces for gathering with friends and fellow residents. Here, residents are provided with all the care and amenities they need to live their lives as fully and comfortably as possible.
Overview of Peace Gardens Assisted Living

Peace Gardens Assisted Living has dedicated professionals who provide each senior with respectful and dignified family-like treatment. A beautiful community that is quiet and calming, the assisted living home hints at a refreshing experience through its activities that make some of the residents feel young and secure in a home-like environment. The resident-centered approach prioritizes the wellness and well-being of each resident, promoting purposeful independence and cultivating individual growth.
Their featured services include assistance with daily living (ADLs), entertainment programs, transportation services, housekeeping, mobility assistance, healthy meals, and social activities. Specialized therapy programs including speech, occupational, and physical services. A memory care therapy program is also available for those in need.
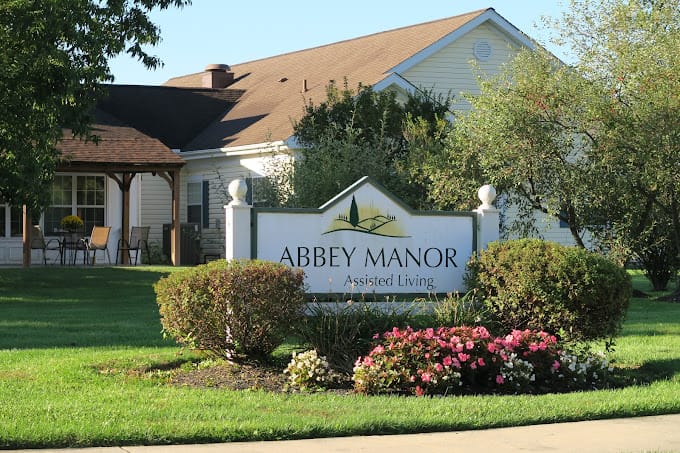
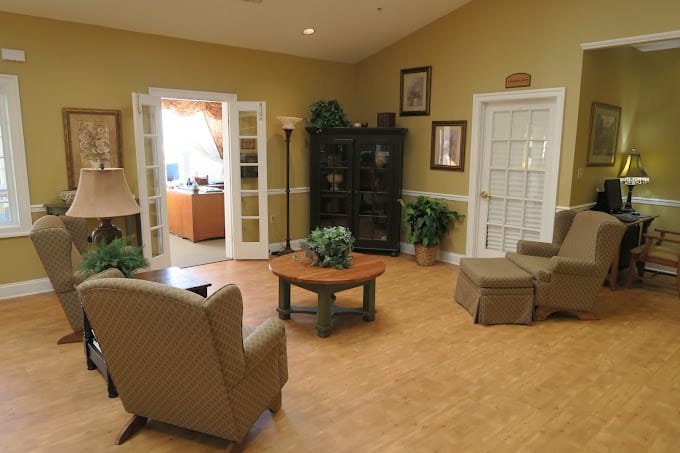
Overview of Abbey Manor in Elkton

Abbey Manor in Elkton, Maryland, offers a wide range of services, including assisted living, end-of-life care, and respite care. Conveniently located just a 30-minute drive from Wilmington, Delaware, this charming community exudes warmth and coziness. With dedicated nurses providing attentive care, Abbey Manor ensures that the elderly receive the support they need at all times. The community takes pride in its well-designed accommodations, offering impeccable care around the clock through personalized care plans. One standout feature is the low residential staff ratio, allowing each individual to receive individualized attention and assistance. Staff members are well-versed in various areas, including fall prevention, diabetes care, early-stage dementia care, and nutrition.
Additionally, residents can enjoy the lovely patio area, an enclosed porch for relaxation, and delectable meals that tantalize the taste buds. Abbey Manor promises a vibrant and fulfilling living experience, where residents can truly feel at home and cherished. The living area boasts an inviting atrium-style design, providing a comfortable and enjoyable space for residents. From engaging in friendly games of dominoes to losing themselves in captivating magazines or joining in song around the piano, the community offers a plethora of sociable and interesting activities to keep spirits high.
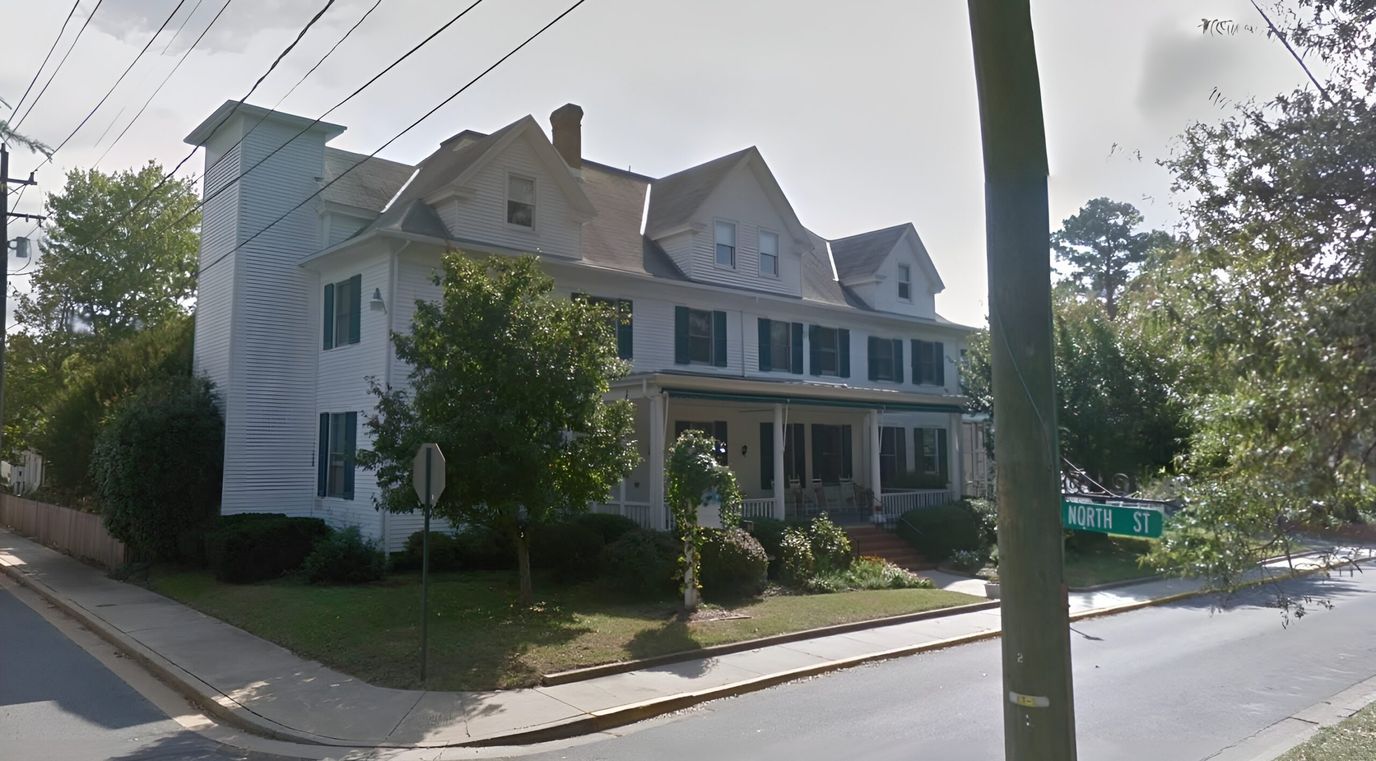
Conveniently nestled in a quiet neighborhood in Easton, MD, The Dixon House provides a relaxing setting for those needing independent living and assisted living. Their bright and spacious accommodations are carefully designed to ensure residents feel safe with 24/7 access to a team of kind and reliable RNs and caregivers. With 24/7 certified nursing care, compassionate assistance with daily living activities, and medication management, the community ensures residents are well-equipped to maintain their health and well-being.
Dedicated to helping residents live a vibrant retirement life, the community provides a wide selection of exercise activities and recreational opportunities to keep them active and engaged. Residents’ nutrition is also closely monitored and maintained by servicing them well-balanced meals with accommodations for special diets. Thoughtful amenities like salon services, housekeeping, and maintenance, are also available to make residents’ living experience more enjoyable and convenient.
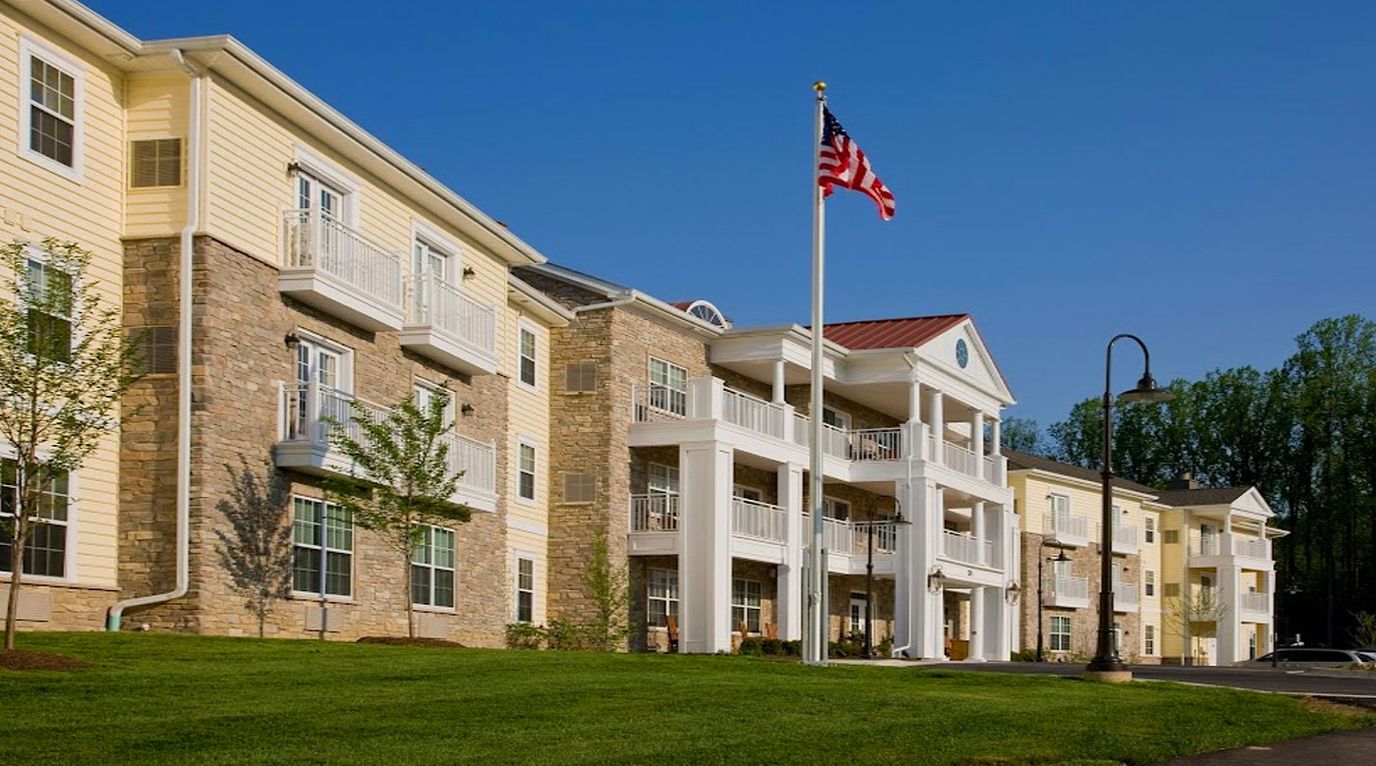
Brightview Avondell undoubtedly provides the highest care for independent living, assisted living, and memory care support in Bel Air South in Maryland. Management makes it a point that seniors are given the freedom and choice given to each resident and ensures that they attend to the unique needs of each individual with kindness and compassion. The premier retirement community strives to satisfy the holistic wellness of its residents in a cozy, nurturing, and fun-filled environment.
Brightview Avondell’s residential lifestyle encourages its seniors to live a fulfilling everyday life through the community’s extensive services. Some all-inclusive features include ALDs, medication management, specialized memory care programs, housekeeping, and laundry services tailored to their unique needs. Other amenities include a library, full baths, a cafe, a fitness center, and a multi-purpose room– to name a few of what the home offers.
Located within the picturesque landscape of Gambrills, Maryland, Arcadia of Crofton II emerges as a gem, boasting 16 private rooms enveloped by lush surroundings. Formerly known as Autumn Meadows, this charming senior residence offers an inviting atmosphere that captures the essence of worry-free assisted senior living. With a spacious dining area and numerous spaces dedicated to diverse activities, Arcadia of Crofton II is designed to cater to every facet of assisted living homes.
This community also provides round-the-clock care and vigilant supervision, ensuring peace of mind for residents and their families in the realm of assisted senior living. Beyond the cozy confines of their private rooms, seniors can relish in the comfort of three delectable home-cooked meals, perfectly complemented by an emergency call bell system and the convenience of Wi-Fi and cable services. The thoughtful inclusion of a backup electric generator, along with the assistance of housekeeping and laundry services, fosters an environment where residents can truly embrace the joys of assisted living.
Love and Light Senior Care is an assisted living community in Accokeek, MD, offering assistance with daily living activities. With its ideal setting surrounded by nature, the community ensures older adults have a calm and peaceful stay. 24-hour support, activities, and assistance with daily living activities are among the services provided to improve residents’ day-to-day living. The community also develops personalized care plans to meet residents’ unique needs and preferences.
Group exercises, social gatherings, and creative activities allow residents to explore hobbies and socialize. A variety of private and semi-private rooms, as well as shared spaces, are also available for residents’ relaxation and wellness. With two distinct homes in Accokeek and Upper Marlboro, older adults can find the best place to spend retirement within their proximity. This assisted living community is a great choice for senior living in Maryland, especially with its high-quality services and thoughtfully curated amenities.
Tucked away in a peaceful neighborhood in Burtonsville, MD, Bethel Residential Care Home is a premiere senior living community that offers excellent assisted living. Residents enjoy a restful living environment in spacious and naturally well-lit accommodations equipped with a private bathroom, emergency call system, and ample storage space. A team of experienced and compassionate caregivers are available to provide personalized care and support, including assistance with daily living activities, medication management, and health monitoring.
Dedicated to nurturing its residents’ overall well-being, the community presents residents with a wide array of engaging activities and events, from fitness classes to game nights and cultural outings. Residents never miss out on their daily nourishment with dedicated on-site chefs that prepare delicious and nutritious meals, with consideration for special dietary needs and preferences. With Bethel Residential Care Home, residents and their families can rest easy knowing that their loved ones well-being is a priority.
A community that balances country charm with unparalleled nursing support, Autumn Lake Healthcare at Braddock Heights in Frederick celebrates each unique individual with compassion and dignity. Exclusively houses only the best professional care staff who deliver excellence to the recovery of every resident, expect each senior resident to get back on their feet and be with their loved ones immediately.
Autumn Lake Healthcare at Braddock Heights specializes in long-term care, short-term rehabilitation, and skilled nursing services, seniors receive 24-hour professional care for therapy (speech, occupational, physical), restorative care, wound care, nebulizer treatment, colostomy care, enteral nutrition, respiratory care; foley care, dialysis, immunizations, burns, and psychiatric services– among many others.
Autumn Lake Healthcare at Braddock Heights is an independently owned and operated healthcare center that is licensed to use the Autumn Lake Healthcare name and receive non-healthcare related services. All healthcare-related services are provided solely by Autumn Lake Healthcare at Braddock Heights.
Ranking Methodology
How we rank these assisted living communities
Every community above is evaluated across six weighted categories using public data including state inspection records, review platforms, BBB profiles, and operator-published materials.
Weighting overview
- 35%Resident Experience
- 25%Regulatory
- 15%Visual Media
- 10%Website
- 10%Stability
- 5%Environment
01
Resident & Family Experience 35%
The single largest share of every ranking. Aggregated review sentiment and volume from major platforms — the closest signal to real resident experience.
- Includes
- Review Sentiment
- Review Volume
02
Regulatory & Safety Record 25%
State inspection records, citations, and complaint visits. We weight per-inspection rates more heavily than raw counts.
- Includes
- State Inspections
- Citations/Inspection
- % Inspections w/ Citations
- Complaint Visits
- Accreditations
- BBB Rating
03
Visual Media & Transparency 15%
Communities that publish high-quality visuals give families a real preview. No photos or tours = a negative transparency signal.
- Includes
- Video Tours
- Virtual Walkthroughs
- Photo Quantity
- Photo Quality
04
Website & Operator Transparency 10%
Site quality and whether the operator publishes basic accountability information — staff names, contact details, ownership.
- Includes
- Website Content
- Mobile Usability
- Staff Info Available
- Owner Info Available
05
Community Stability 10%
Operational signals indicating whether a community is well-run and meeting demand.
- Includes
- Occupancy Rate
- Bed Options
06
Environment & Pricing 5%
Walkability and pricing transparency. Walk Score is weighted higher for Independent Living than for Memory Care, where most residents do not leave unaccompanied.
- Includes
- Walk Score
- Pricing Transparency
Who we are
Your Senior Care Partner, Every Step of the Way
We help families find affordable senior communities and unlock same day discounts, Medicaid, and Medicare options tailored to your needs.
Contact us Today
Frequently Asked Questions about Assisted Living in Maryland
What's the difference between assisted living and memory care in Maryland?
Assisted living in Maryland supports residents with daily activities (bathing, dressing, medication management) while preserving independence. Memory care is a specialized form of assisted living for residents living with Alzheimer's or dementia, and adds 24/7 secured environments, dementia-trained staff, and structured routines designed to reduce confusion and wandering.
What's the difference between assisted living and a nursing home in Maryland?
Assisted living in Maryland is a residential model focused on housing, hospitality, and help with daily activities. Nursing homes (skilled nursing facilities) provide 24/7 medical care from licensed nurses for residents with significant health needs, and are regulated more strictly under both state and federal CMS rules.
Does Maryland Medicaid cover assisted living?
Maryland Medicaid does not directly pay room-and-board for assisted living, but most states (including Maryland) offer Home and Community-Based Services (HCBS) waivers that can offset the cost of care services delivered inside a licensed community. Eligibility, waitlists, and covered services vary — check directly with the state Medicaid agency.
What is assisted living?
Assisted living combines private or semi-private apartments with help on activities of daily living (meals, bathing, dressing, medication management) and a social calendar — for residents who need some support but do not need 24/7 medical care.
How many assisted living facilities are listed on this page?
This page features 820 assisted living facilities in Maryland. Use the filters and comparison tools above to compare ratings, amenities, and pricing.
How do I choose the right assisted living facility in Maryland?
Start by matching the level of care offered to the resident's current and anticipated needs, then compare licensing status, staff-to-resident ratios, recent inspection results, and pricing. Tour at least two or three communities in Maryland, talk to current residents and families, and confirm what is included in the base rate versus billed as add-on services.
What should I look for when visiting assisted living facilities in Maryland?
Pay attention to staff interactions with residents, cleanliness and odor, food quality at meal times, the activity calendar, and how questions about pricing and care plans are answered. Ask to see the most recent state inspection report, the move-out / level-of-care-change policy, and a sample monthly bill that lists every fee.
Updated on
