


Where in Maryland are you looking?
Browse communities by city.
AberdeenAccokeekAdelphiAnnapolisAnne Arundel CountyBaltimoreBeltsvilleBethesdaBowieCambridgeCatonsvilleChevy ChaseClintonColumbiaCoral HillsEastonElktonEllicott CityForest HillFort WashingtonFrederickGaithersburgGermantownGlen BurnieHagerstownHarford CountyHoward CountyHyattsvilleMarlboroMontgomery CountyOdentonPikesvillePotomacPrince George's CountyQueenstownRockvilleSalisburySandy SpringSeverna ParkSilver SpringTemple HillsTowsonWaldorfWashington County
Compare Assisted Living around Maryland
The information below is reported by the Maryland Department of Health, Office of Health Care Quality.
| Sunrise of Silver Spring | AL HC MC RC | Silver Spring (New Hampshire Avenue) | 84
Facility
84
MD AVG
43
Rank
#170 / 697 | Yes |
40
Facility
40
MD AVG
43
Rank
#523 / 985 | Studio / 1 Bed / 2 Bed | 24
Facility
24
MD AVG
21
Rank
#92 / 208 | - |
31% Male Residents — State Benchmarked 31% of residents are male, compared to the Maryland average of 31%. This facility caters to a majority female resident pool (69% female), consistent with the broader assisted living trend where women significantly outnumber men. |
69% Female Residents — State Benchmarked 69% of residents are female, compared to the Maryland average of 69%. Women comprise the large majority, consistent with national assisted living demographics where women live longer and enter care facilities at higher rates. |
53% White Residents — State Benchmarked 53% of residents are reported as White, compared to the Maryland average of 81%. A lower White share than the Maryland average — the community may draw a more diverse resident mix relative to other facilities in Maryland. |
39% African American Residents — State Benchmarked 39% of residents are reported as African American or Black, compared to the Maryland average of 13%. A higher African American share than the typical Maryland average — useful context when comparing cultural fit and community composition. |
9% Other Ethnicity Residents — State Benchmarked 9% of residents fall into categories other than White or African American (combined), compared to the Maryland average of 6%. This column aggregates Hispanic, Asian, multiracial, and any other labeled groups that are not classified as White or African American. Reported subgroups in this total: Asian (4%), Hawaiian/Pacific Islander (3%), Hispanic (1%). |
4% Residents Age 65–74 — State Benchmarked 4% of residents are 65–74, compared to the Maryland average of 13%. Fewer younger seniors suggests the resident population skews older, likely requiring higher acuity care and more hands-on support. |
43% Residents Age 75–84 — State Benchmarked 43% of residents are 75–84, compared to the Maryland average of 31%. A high concentration in this mid-range bracket, where residents typically need moderate support with daily activities. |
37% Residents Age 85–94 — State Benchmarked 37% of residents are 85–94, compared to the Maryland average of 44%. The population here skews younger than the statewide norm, which may indicate a more active, lower-acuity community. |
14% Residents Age 95+ — State Benchmarked 14% of residents are 95 or older, compared to the Maryland average of 16%. In line with the statewide profile for the oldest resident bracket. |
| Brightview Annapolis | AL IL MC | Annapolis | 85
Facility
85
MD AVG
43
Rank
#168 / 697 | Yes |
34
Facility
34
MD AVG
43
Rank
#590 / 985 | Studio / 1 Bed / 2 Bed | 8
Facility
8
MD AVG
21
Rank
#162 / 208 | - |
27% Male Residents — State Benchmarked 27% of residents are male, compared to the Maryland average of 31%. This facility caters to a majority female resident pool (73% female), consistent with the broader assisted living trend where women significantly outnumber men. |
73% Female Residents — State Benchmarked 73% of residents are female, compared to the Maryland average of 69%. Women comprise the large majority, consistent with national assisted living demographics where women live longer and enter care facilities at higher rates. |
97% White Residents — State Benchmarked 97% of residents are reported as White, compared to the Maryland average of 81%. A higher White share than is typical for assisted living in Maryland in this dataset — compare with peer facilities for local context. |
0% African American Residents — State Benchmarked 0% of residents are reported as African American or Black, compared to the Maryland average of 13%. A lower African American share than is typical in Maryland; local markets still vary widely. |
3% Other Ethnicity Residents — State Benchmarked 3% of residents fall into categories other than White or African American (combined), compared to the Maryland average of 6%. This column aggregates Hispanic, Asian, multiracial, and any other labeled groups that are not classified as White or African American. Reported subgroups in this total: Hispanic (3%). |
3% Residents Age 65–74 — State Benchmarked 3% of residents are 65–74, compared to the Maryland average of 13%. Fewer younger seniors suggests the resident population skews older, likely requiring higher acuity care and more hands-on support. |
27% Residents Age 75–84 — State Benchmarked 27% of residents are 75–84, compared to the Maryland average of 31%. This is the second most common age bracket in assisted living, representing residents with moderate care needs. |
59% Residents Age 85–94 — State Benchmarked 59% of residents are 85–94, compared to the Maryland average of 44%. A high concentration of very elderly residents signals a higher-acuity facility with experience caring for advanced age-related needs. |
9% Residents Age 95+ — State Benchmarked 9% of residents are 95 or older, compared to the Maryland average of 16%. Most residents here have not yet reached the oldest-old bracket, suggesting a younger overall community. |
| Modena Reserve at Kensington | AL IL MC | Kensington (Metropolitan Avenue) | 80
Facility
80
MD AVG
43
Rank
#176 / 697 | No |
85
Facility
85
MD AVG
43
Rank
#54 / 985 | - | 4
Facility
4
MD AVG
21
Rank
#191 / 208 | - | - | - | - | - | - | - | - | - | - |
| Bay Village of Annapolis | AL NH | Annapolis | 88
Facility
88
MD AVG
43
Rank
#162 / 697 | Yes |
75
Facility
75
MD AVG
43
Rank
#131 / 985 | Studio / 1 Bed | 5
Facility
5
MD AVG
21
Rank
#182 / 208 | - |
32% Male Residents — State Benchmarked 32% of residents are male, compared to the Maryland average of 31%. This facility caters to a majority female resident pool (68% female), consistent with the broader assisted living trend where women significantly outnumber men. |
68% Female Residents — State Benchmarked 68% of residents are female, compared to the Maryland average of 69%. Women comprise the large majority, consistent with national assisted living demographics where women live longer and enter care facilities at higher rates. |
99% White Residents — State Benchmarked 99% of residents are reported as White, compared to the Maryland average of 81%. A higher White share than is typical for assisted living in Maryland in this dataset — compare with peer facilities for local context. |
0% African American Residents — State Benchmarked 0% of residents are reported as African American or Black, compared to the Maryland average of 13%. A lower African American share than is typical in Maryland; local markets still vary widely. |
1% Other Ethnicity Residents — State Benchmarked 1% of residents fall into categories other than White or African American (combined), compared to the Maryland average of 6%. This column aggregates Hispanic, Asian, multiracial, and any other labeled groups that are not classified as White or African American. Reported subgroups in this total: Hispanic (1%). |
14% Residents Age 65–74 — State Benchmarked 14% of residents are 65–74, compared to the Maryland average of 13%. In line with the statewide profile for this youngest senior bracket in assisted living. |
28% Residents Age 75–84 — State Benchmarked 28% of residents are 75–84, compared to the Maryland average of 31%. This is the second most common age bracket in assisted living, representing residents with moderate care needs. |
50% Residents Age 85–94 — State Benchmarked 50% of residents are 85–94, compared to the Maryland average of 44%. A high concentration of very elderly residents signals a higher-acuity facility with experience caring for advanced age-related needs. |
8% Residents Age 95+ — State Benchmarked 8% of residents are 95 or older, compared to the Maryland average of 16%. Most residents here have not yet reached the oldest-old bracket, suggesting a younger overall community. |
| Brightview Rolling Hills | AL MC | Catonsville (College Hills) | 81
Facility
81
MD AVG
43
Rank
#174 / 697 | Yes |
19
Facility
19
MD AVG
43
Rank
#746 / 985 | Studio / 1 Bed /2 Bed | 8
Facility
8
MD AVG
21
Rank
#162 / 208 | - |
16% Male Residents — State Benchmarked 16% of residents are male, compared to the Maryland average of 31%. This facility caters to a majority female resident pool (84% female), consistent with the broader assisted living trend where women significantly outnumber men. |
84% Female Residents — State Benchmarked 84% of residents are female, compared to the Maryland average of 69%. Women comprise the large majority, consistent with national assisted living demographics where women live longer and enter care facilities at higher rates. |
95% White Residents — State Benchmarked 95% of residents are reported as White, compared to the Maryland average of 81%. A higher White share than is typical for assisted living in Maryland in this dataset — compare with peer facilities for local context. |
3% African American Residents — State Benchmarked 3% of residents are reported as African American or Black, compared to the Maryland average of 13%. A lower African American share than is typical in Maryland; local markets still vary widely. |
2% Other Ethnicity Residents — State Benchmarked 2% of residents fall into categories other than White or African American (combined), compared to the Maryland average of 6%. This column aggregates Hispanic, Asian, multiracial, and any other labeled groups that are not classified as White or African American. Reported subgroups in this total: Asian (2%). | - |
8% Residents Age 75–84 — State Benchmarked 8% of residents are 75–84, compared to the Maryland average of 31%. Below the state norm — the resident mix may skew either younger or older than this typical middle bracket. |
83% Residents Age 85–94 — State Benchmarked 83% of residents are 85–94, compared to the Maryland average of 44%. A high concentration of very elderly residents signals a higher-acuity facility with experience caring for advanced age-related needs. |
10% Residents Age 95+ — State Benchmarked 10% of residents are 95 or older, compared to the Maryland average of 16%. Most residents here have not yet reached the oldest-old bracket, suggesting a younger overall community. |
| Brightview Mays Chapel Ridge | AL IL MC | Timonium (Dixon Hill) | 89
Facility
89
MD AVG
43
Rank
#160 / 697 | No |
52
Facility
52
MD AVG
43
Rank
#402 / 985 | Studio / 1 Bed / 2 Bed | 50
Facility
50
MD AVG
21
Rank
#1 / 208 | A+ |
13% Male Residents — State Benchmarked 13% of residents are male, compared to the Maryland average of 31%. This facility caters to a majority female resident pool (87% female), consistent with the broader assisted living trend where women significantly outnumber men. |
87% Female Residents — State Benchmarked 87% of residents are female, compared to the Maryland average of 69%. Women comprise the large majority, consistent with national assisted living demographics where women live longer and enter care facilities at higher rates. |
99% White Residents — State Benchmarked 99% of residents are reported as White, compared to the Maryland average of 81%. A higher White share than is typical for assisted living in Maryland in this dataset — compare with peer facilities for local context. |
0% African American Residents — State Benchmarked 0% of residents are reported as African American or Black, compared to the Maryland average of 13%. A lower African American share than is typical in Maryland; local markets still vary widely. |
1% Other Ethnicity Residents — State Benchmarked 1% of residents fall into categories other than White or African American (combined), compared to the Maryland average of 6%. This column aggregates Hispanic, Asian, multiracial, and any other labeled groups that are not classified as White or African American. Reported subgroups in this total: Asian (1%). |
3% Residents Age 65–74 — State Benchmarked 3% of residents are 65–74, compared to the Maryland average of 13%. Fewer younger seniors suggests the resident population skews older, likely requiring higher acuity care and more hands-on support. |
30% Residents Age 75–84 — State Benchmarked 30% of residents are 75–84, compared to the Maryland average of 31%. This is the second most common age bracket in assisted living, representing residents with moderate care needs. |
48% Residents Age 85–94 — State Benchmarked 48% of residents are 85–94, compared to the Maryland average of 44%. This is typically the most common age bracket in assisted living — this facility is in line with the statewide norm. |
18% Residents Age 95+ — State Benchmarked 18% of residents are 95 or older, compared to the Maryland average of 16%. In line with the statewide profile for the oldest resident bracket. |
| Brightview Crofton Riverwalk | AL IL MC | Crofton | 92
Facility
92
MD AVG
43
Rank
#155 / 697 | Yes |
45
Facility
45
MD AVG
43
Rank
#475 / 985 | Studio / 1 Bed / 2 Bed | 6
Facility
6
MD AVG
21
Rank
#176 / 208 | - |
27% Male Residents — State Benchmarked 27% of residents are male, compared to the Maryland average of 31%. This facility caters to a majority female resident pool (73% female), consistent with the broader assisted living trend where women significantly outnumber men. |
73% Female Residents — State Benchmarked 73% of residents are female, compared to the Maryland average of 69%. Women comprise the large majority, consistent with national assisted living demographics where women live longer and enter care facilities at higher rates. |
0% White Residents — State Benchmarked 0% of residents are reported as White, compared to the Maryland average of 81%. A lower White share than the Maryland average — the community may draw a more diverse resident mix relative to other facilities in Maryland. |
0% African American Residents — State Benchmarked 0% of residents are reported as African American or Black, compared to the Maryland average of 13%. A lower African American share than is typical in Maryland; local markets still vary widely. |
100% Other Ethnicity Residents — State Benchmarked 100% of residents fall into categories other than White or African American (combined), compared to the Maryland average of 6%. This column aggregates Hispanic, Asian, multiracial, and any other labeled groups that are not classified as White or African American. Reported subgroups in this total: Other (100%). | - | - | - | - |
| Sunrise of Frederick | AL MC | Frederick (Waterford) | 88
Facility
88
MD AVG
43
Rank
#162 / 697 | Yes |
62
Facility
62
MD AVG
43
Rank
#286 / 985 | Studio / Suite / 2 Bed | 45
Facility
45
MD AVG
21
Rank
#4 / 208 | A- |
31% Male Residents — State Benchmarked 31% of residents are male, compared to the Maryland average of 31%. This facility caters to a majority female resident pool (69% female), consistent with the broader assisted living trend where women significantly outnumber men. |
69% Female Residents — State Benchmarked 69% of residents are female, compared to the Maryland average of 69%. Women comprise the large majority, consistent with national assisted living demographics where women live longer and enter care facilities at higher rates. |
97% White Residents — State Benchmarked 97% of residents are reported as White, compared to the Maryland average of 81%. A higher White share than is typical for assisted living in Maryland in this dataset — compare with peer facilities for local context. |
2% African American Residents — State Benchmarked 2% of residents are reported as African American or Black, compared to the Maryland average of 13%. A lower African American share than is typical in Maryland; local markets still vary widely. |
2% Other Ethnicity Residents — State Benchmarked 2% of residents fall into categories other than White or African American (combined), compared to the Maryland average of 6%. This column aggregates Hispanic, Asian, multiracial, and any other labeled groups that are not classified as White or African American. Reported subgroups in this total: Hispanic (2%). |
10% Residents Age 65–74 — State Benchmarked 10% of residents are 65–74, compared to the Maryland average of 13%. Fewer younger seniors suggests the resident population skews older, likely requiring higher acuity care and more hands-on support. |
34% Residents Age 75–84 — State Benchmarked 34% of residents are 75–84, compared to the Maryland average of 31%. This is the second most common age bracket in assisted living, representing residents with moderate care needs. |
48% Residents Age 85–94 — State Benchmarked 48% of residents are 85–94, compared to the Maryland average of 44%. This is typically the most common age bracket in assisted living — this facility is in line with the statewide norm. |
6% Residents Age 95+ — State Benchmarked 6% of residents are 95 or older, compared to the Maryland average of 16%. Most residents here have not yet reached the oldest-old bracket, suggesting a younger overall community. |
| Sunrise of Rockville | AL | Rockville (Baltimore Road) | 89
Facility
89
MD AVG
43
Rank
#160 / 697 | Yes |
89
Facility
89
MD AVG
43
Rank
#32 / 985 | Studio / 1 Bed / 2 Bed | 45
Facility
45
MD AVG
21
Rank
#4 / 208 | A- |
23% Male Residents — State Benchmarked 23% of residents are male, compared to the Maryland average of 31%. This facility caters to a majority female resident pool (77% female), consistent with the broader assisted living trend where women significantly outnumber men. |
77% Female Residents — State Benchmarked 77% of residents are female, compared to the Maryland average of 69%. Women comprise the large majority, consistent with national assisted living demographics where women live longer and enter care facilities at higher rates. |
87% White Residents — State Benchmarked 87% of residents are reported as White, compared to the Maryland average of 81%. Close to the average for this category among assisted living facilities in Maryland with reported race/ethnicity data. |
2% African American Residents — State Benchmarked 2% of residents are reported as African American or Black, compared to the Maryland average of 13%. A lower African American share than is typical in Maryland; local markets still vary widely. |
11% Other Ethnicity Residents — State Benchmarked 11% of residents fall into categories other than White or African American (combined), compared to the Maryland average of 6%. This column aggregates Hispanic, Asian, multiracial, and any other labeled groups that are not classified as White or African American. Reported subgroups in this total: Mixed Race (6%), Hispanic (3%), Asian (2%). |
3% Residents Age 65–74 — State Benchmarked 3% of residents are 65–74, compared to the Maryland average of 13%. Fewer younger seniors suggests the resident population skews older, likely requiring higher acuity care and more hands-on support. |
31% Residents Age 75–84 — State Benchmarked 31% of residents are 75–84, compared to the Maryland average of 31%. This is the second most common age bracket in assisted living, representing residents with moderate care needs. |
56% Residents Age 85–94 — State Benchmarked 56% of residents are 85–94, compared to the Maryland average of 44%. A high concentration of very elderly residents signals a higher-acuity facility with experience caring for advanced age-related needs. |
10% Residents Age 95+ — State Benchmarked 10% of residents are 95 or older, compared to the Maryland average of 16%. Most residents here have not yet reached the oldest-old bracket, suggesting a younger overall community. |
| Arbor Terrace at Waugh Chapel | AL MC | Gambrills (Waugh Chapel Towne Centre) | 96
Facility
96
MD AVG
43
Rank
#140 / 697 | No |
47
Facility
47
MD AVG
43
Rank
#459 / 985 | - | 4
Facility
4
MD AVG
21
Rank
#191 / 208 | A+ |
30% Male Residents — State Benchmarked 30% of residents are male, compared to the Maryland average of 31%. This facility caters to a majority female resident pool (70% female), consistent with the broader assisted living trend where women significantly outnumber men. |
70% Female Residents — State Benchmarked 70% of residents are female, compared to the Maryland average of 69%. Women comprise the large majority, consistent with national assisted living demographics where women live longer and enter care facilities at higher rates. |
86% White Residents — State Benchmarked 86% of residents are reported as White, compared to the Maryland average of 81%. Close to the average for this category among assisted living facilities in Maryland with reported race/ethnicity data. |
12% African American Residents — State Benchmarked 12% of residents are reported as African American or Black, compared to the Maryland average of 13%. In line with the Maryland average for African American residents among facilities reporting this breakdown. |
3% Other Ethnicity Residents — State Benchmarked 3% of residents fall into categories other than White or African American (combined), compared to the Maryland average of 6%. This column aggregates Hispanic, Asian, multiracial, and any other labeled groups that are not classified as White or African American. Reported subgroups in this total: Asian (1%), Hawaiian/Pacific Islander (1%). |
10% Residents Age 65–74 — State Benchmarked 10% of residents are 65–74, compared to the Maryland average of 13%. Fewer younger seniors suggests the resident population skews older, likely requiring higher acuity care and more hands-on support. |
43% Residents Age 75–84 — State Benchmarked 43% of residents are 75–84, compared to the Maryland average of 31%. A high concentration in this mid-range bracket, where residents typically need moderate support with daily activities. |
39% Residents Age 85–94 — State Benchmarked 39% of residents are 85–94, compared to the Maryland average of 44%. This is typically the most common age bracket in assisted living — this facility is in line with the statewide norm. |
8% Residents Age 95+ — State Benchmarked 8% of residents are 95 or older, compared to the Maryland average of 16%. Most residents here have not yet reached the oldest-old bracket, suggesting a younger overall community. |
| Celebration Villa of Manresa | AL RC | Annapolis (Arnold) | 86
Facility
86
MD AVG
43
Rank
#167 / 697 | Yes |
2
Facility
2
MD AVG
43
Rank
#940 / 985 | Studio / 1 Bed | 3
Facility
3
MD AVG
21
Rank
#201 / 208 | - |
35% Male Residents — State Benchmarked 35% of residents are male, compared to the Maryland average of 31%. This facility caters to a majority female resident pool (65% female), consistent with the broader assisted living trend where women significantly outnumber men. |
65% Female Residents — State Benchmarked 65% of residents are female, compared to the Maryland average of 69%. Women comprise the large majority, consistent with national assisted living demographics where women live longer and enter care facilities at higher rates. |
97% White Residents — State Benchmarked 97% of residents are reported as White, compared to the Maryland average of 81%. A higher White share than is typical for assisted living in Maryland in this dataset — compare with peer facilities for local context. |
3% African American Residents — State Benchmarked 3% of residents are reported as African American or Black, compared to the Maryland average of 13%. A lower African American share than is typical in Maryland; local markets still vary widely. |
0% Other Ethnicity Residents — State Benchmarked 0% of residents fall into categories other than White or African American (combined), compared to the Maryland average of 6%. This column aggregates Hispanic, Asian, multiracial, and any other labeled groups that are not classified as White or African American. |
8% Residents Age 65–74 — State Benchmarked 8% of residents are 65–74, compared to the Maryland average of 13%. Fewer younger seniors suggests the resident population skews older, likely requiring higher acuity care and more hands-on support. |
52% Residents Age 75–84 — State Benchmarked 52% of residents are 75–84, compared to the Maryland average of 31%. A high concentration in this mid-range bracket, where residents typically need moderate support with daily activities. |
27% Residents Age 85–94 — State Benchmarked 27% of residents are 85–94, compared to the Maryland average of 44%. The population here skews younger than the statewide norm, which may indicate a more active, lower-acuity community. |
13% Residents Age 95+ — State Benchmarked 13% of residents are 95 or older, compared to the Maryland average of 16%. In line with the statewide profile for the oldest resident bracket. |
| Queenstown Landing | AL MC RC | Queenstown | 78
Facility
78
MD AVG
43
Rank
#181 / 697 | No |
10
Facility
10
MD AVG
43
Rank
#837 / 985 | - | 5
Facility
5
MD AVG
21
Rank
#182 / 208 | - |
35% Male Residents — State Benchmarked 35% of residents are male, compared to the Maryland average of 31%. This facility caters to a majority female resident pool (65% female), consistent with the broader assisted living trend where women significantly outnumber men. |
65% Female Residents — State Benchmarked 65% of residents are female, compared to the Maryland average of 69%. Women comprise the large majority, consistent with national assisted living demographics where women live longer and enter care facilities at higher rates. |
98% White Residents — State Benchmarked 98% of residents are reported as White, compared to the Maryland average of 81%. A higher White share than is typical for assisted living in Maryland in this dataset — compare with peer facilities for local context. |
2% African American Residents — State Benchmarked 2% of residents are reported as African American or Black, compared to the Maryland average of 13%. A lower African American share than is typical in Maryland; local markets still vary widely. |
0% Other Ethnicity Residents — State Benchmarked 0% of residents fall into categories other than White or African American (combined), compared to the Maryland average of 6%. This column aggregates Hispanic, Asian, multiracial, and any other labeled groups that are not classified as White or African American. | - |
5% Residents Age 75–84 — State Benchmarked 5% of residents are 75–84, compared to the Maryland average of 31%. Below the state norm — the resident mix may skew either younger or older than this typical middle bracket. |
88% Residents Age 85–94 — State Benchmarked 88% of residents are 85–94, compared to the Maryland average of 44%. A high concentration of very elderly residents signals a higher-acuity facility with experience caring for advanced age-related needs. |
7% Residents Age 95+ — State Benchmarked 7% of residents are 95 or older, compared to the Maryland average of 16%. Most residents here have not yet reached the oldest-old bracket, suggesting a younger overall community. |
| Arbor Terrace Waugh Chapel | AL MC | Gambrills (Waugh Chapel Towne Centre) | 96
Facility
96
MD AVG
43
Rank
#140 / 697 | Yes |
47
Facility
47
MD AVG
43
Rank
#459 / 985 | Studio / 1 Bed / 2 Bed | 4
Facility
4
MD AVG
21
Rank
#191 / 208 | A+ |
30% Male Residents — State Benchmarked 30% of residents are male, compared to the Maryland average of 31%. This facility caters to a majority female resident pool (70% female), consistent with the broader assisted living trend where women significantly outnumber men. |
70% Female Residents — State Benchmarked 70% of residents are female, compared to the Maryland average of 69%. Women comprise the large majority, consistent with national assisted living demographics where women live longer and enter care facilities at higher rates. |
86% White Residents — State Benchmarked 86% of residents are reported as White, compared to the Maryland average of 81%. Close to the average for this category among assisted living facilities in Maryland with reported race/ethnicity data. |
12% African American Residents — State Benchmarked 12% of residents are reported as African American or Black, compared to the Maryland average of 13%. In line with the Maryland average for African American residents among facilities reporting this breakdown. |
3% Other Ethnicity Residents — State Benchmarked 3% of residents fall into categories other than White or African American (combined), compared to the Maryland average of 6%. This column aggregates Hispanic, Asian, multiracial, and any other labeled groups that are not classified as White or African American. Reported subgroups in this total: Asian (1%), Hawaiian/Pacific Islander (1%). |
10% Residents Age 65–74 — State Benchmarked 10% of residents are 65–74, compared to the Maryland average of 13%. Fewer younger seniors suggests the resident population skews older, likely requiring higher acuity care and more hands-on support. |
43% Residents Age 75–84 — State Benchmarked 43% of residents are 75–84, compared to the Maryland average of 31%. A high concentration in this mid-range bracket, where residents typically need moderate support with daily activities. |
39% Residents Age 85–94 — State Benchmarked 39% of residents are 85–94, compared to the Maryland average of 44%. This is typically the most common age bracket in assisted living — this facility is in line with the statewide norm. |
8% Residents Age 95+ — State Benchmarked 8% of residents are 95 or older, compared to the Maryland average of 16%. Most residents here have not yet reached the oldest-old bracket, suggesting a younger overall community. |
| Brookdale Olney | AL MC | Olney (Olney Estates) | 94
Facility
94
MD AVG
43
Rank
#148 / 697 | Yes |
16
Facility
16
MD AVG
43
Rank
#772 / 985 | Studio / 1 Bed / 2 Bed | 13
Facility
13
MD AVG
21
Rank
#141 / 208 | - |
33% Male Residents — State Benchmarked 33% of residents are male, compared to the Maryland average of 31%. This facility caters to a majority female resident pool (67% female), consistent with the broader assisted living trend where women significantly outnumber men. |
67% Female Residents — State Benchmarked 67% of residents are female, compared to the Maryland average of 69%. Women comprise the large majority, consistent with national assisted living demographics where women live longer and enter care facilities at higher rates. |
94% White Residents — State Benchmarked 94% of residents are reported as White, compared to the Maryland average of 81%. A higher White share than is typical for assisted living in Maryland in this dataset — compare with peer facilities for local context. |
3% African American Residents — State Benchmarked 3% of residents are reported as African American or Black, compared to the Maryland average of 13%. A lower African American share than is typical in Maryland; local markets still vary widely. |
3% Other Ethnicity Residents — State Benchmarked 3% of residents fall into categories other than White or African American (combined), compared to the Maryland average of 6%. This column aggregates Hispanic, Asian, multiracial, and any other labeled groups that are not classified as White or African American. Reported subgroups in this total: Asian (3%). |
8% Residents Age 65–74 — State Benchmarked 8% of residents are 65–74, compared to the Maryland average of 13%. Fewer younger seniors suggests the resident population skews older, likely requiring higher acuity care and more hands-on support. |
39% Residents Age 75–84 — State Benchmarked 39% of residents are 75–84, compared to the Maryland average of 31%. A high concentration in this mid-range bracket, where residents typically need moderate support with daily activities. |
22% Residents Age 85–94 — State Benchmarked 22% of residents are 85–94, compared to the Maryland average of 44%. The population here skews younger than the statewide norm, which may indicate a more active, lower-acuity community. |
28% Residents Age 95+ — State Benchmarked 28% of residents are 95 or older, compared to the Maryland average of 16%. A high proportion of the oldest-old suggests strong end-of-life care experience and very-high-acuity capabilities. |
| Charter Senior Living of Towson | AL MC | Baltimore (The Orchards) | 92
Facility
92
MD AVG
43
Rank
#155 / 697 | No |
36
Facility
36
MD AVG
43
Rank
#563 / 985 | Studio / 1 Bed | 5
Facility
5
MD AVG
21
Rank
#182 / 208 | - |
25% Male Residents — State Benchmarked 25% of residents are male, compared to the Maryland average of 31%. This facility caters to a majority female resident pool (75% female), consistent with the broader assisted living trend where women significantly outnumber men. |
75% Female Residents — State Benchmarked 75% of residents are female, compared to the Maryland average of 69%. Women comprise the large majority, consistent with national assisted living demographics where women live longer and enter care facilities at higher rates. |
88% White Residents — State Benchmarked 88% of residents are reported as White, compared to the Maryland average of 81%. Close to the average for this category among assisted living facilities in Maryland with reported race/ethnicity data. |
7% African American Residents — State Benchmarked 7% of residents are reported as African American or Black, compared to the Maryland average of 13%. In line with the Maryland average for African American residents among facilities reporting this breakdown. |
4% Other Ethnicity Residents — State Benchmarked 4% of residents fall into categories other than White or African American (combined), compared to the Maryland average of 6%. This column aggregates Hispanic, Asian, multiracial, and any other labeled groups that are not classified as White or African American. Reported subgroups in this total: Asian (3%), Hispanic (1%). | - |
22% Residents Age 75–84 — State Benchmarked 22% of residents are 75–84, compared to the Maryland average of 31%. Below the state norm — the resident mix may skew either younger or older than this typical middle bracket. |
60% Residents Age 85–94 — State Benchmarked 60% of residents are 85–94, compared to the Maryland average of 44%. A high concentration of very elderly residents signals a higher-acuity facility with experience caring for advanced age-related needs. |
15% Residents Age 95+ — State Benchmarked 15% of residents are 95 or older, compared to the Maryland average of 16%. In line with the statewide profile for the oldest resident bracket. |
Rows per page:

View all Nearby Homes
Conveniently located near Hollins Place, Ovalstone Comfort Home – Welling Lane is a small, single-story residential community in Bowie, Maryland. The home was built around a five-bed model and offers private and semi-private room options for residents seeking a close-knit residential setting. The property is in a neighborhood with a Walkability Score of 49. Some nearby services may be accessible on foot, but families need to drive for most trips.
Families evaluating small-scale care communities may find Ovalstone a practical option. The home’s smaller size can support more individualized attention in a home-like environment, compared with the larger, multi-building complexes common in the area. Its single-story design and modest size may appeal to residents looking for quiet, familiar surroundings and closer relationships with staff.
Prospective residents and families should schedule a tour to see the private and semi-private room options, meet staff, and get a sense of daily life and operations at the community.
Dulaney Valley Assisted Living at Hunt Valley is a serene and peaceful senior living community in Hunt Valley, MD, that offers assisted living services. Residents are provided with private or semi-private accommodations set in 2 acres of gorgeous land and equipped with all the pleasures in life. Committed to residents’ well-being, the community provides residents with individualized care plans overseen by a registered nurse, a team of compassionate caregivers, and access to physical therapy and respite care.
In addition to comprehensive care services, the community makes sure residents are also presented with an abundance of opportunities for connecting with like-minded individuals, learning new things or making new experiences. From exercise programs to entertainment and other planned activities, residents are sure to find something to enjoy. Residents’ living experience is complete with three nutritious and delicious meals and snacks served in a cozy dining space.
Delivering exceptional care services to the community of Bowie, MD, Sunlife Assisted Living is a reliable senior living community that offers seniors with comprehensive assisted living services. Enjoy the comfort and peace of mind from knowing that a team of highly-skilled and caring nurses are available 24/7 to accommodate various needs and attend to any emergencies. Residents indulge in the comfort and convenience of well-designed private and semi-private bedrooms with all inclusive prices and no hidden charges.
With a wide array of care services available, including in house primary care practitioner, podiatry care, physical therapy ,occupational therapy, mobile x-rays and phlebotomy lab services, residents’ varying needs are covered. Residents’ dining experiences are guaranteed to be on time and healthy with three balanced meals per day and evening snacks offered. Here, residents are empowered to live the retirement life they’ve envisioned with the support of extensive services and a compassionate team.
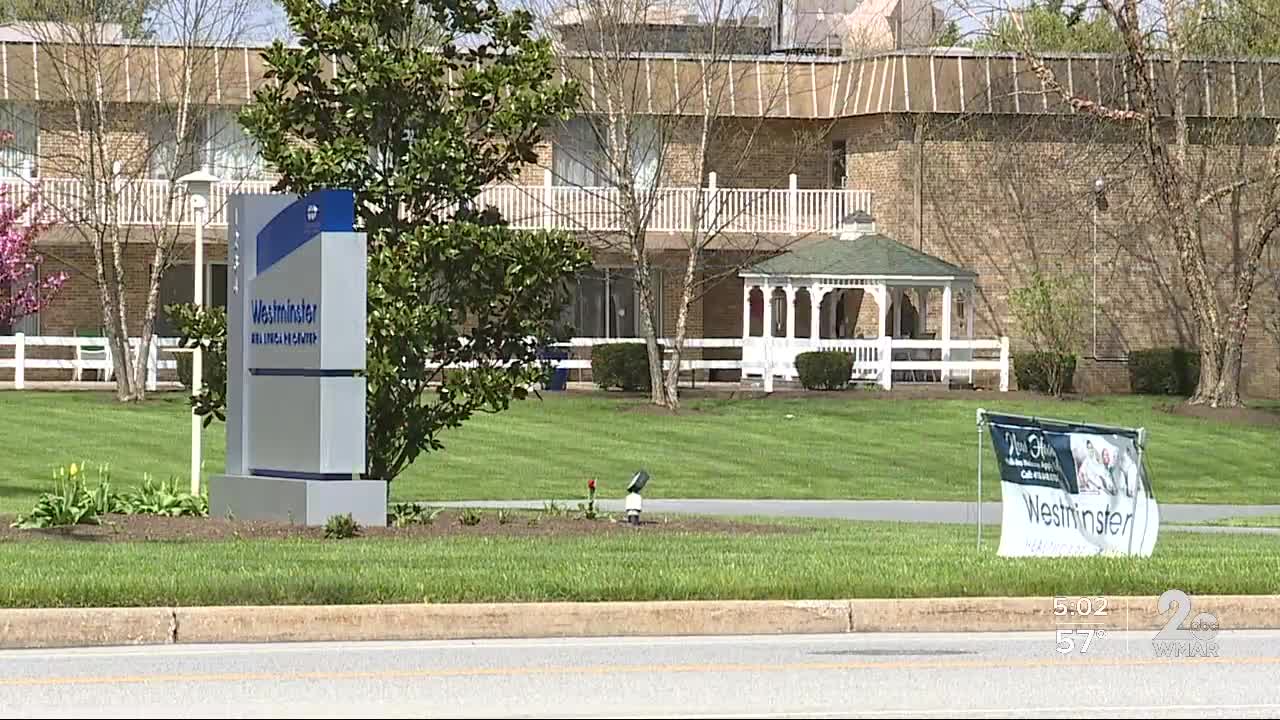
Overview of Westminster Healthcare Center


Westminster Healthcare Center, by the CommuniCare Family of Communities, is the city’s trusted skilled nursing and rehabilitation home with memory care. It offers a warm and welcoming atmosphere where residents and staff are encouraged to create friendships and build a mutual level of trust with each other. The long-term care facility aims to enhance the quality of life for its residents by ensuring that seniors can satisfy their holistic wellness.
Worthington Healthcare Center emphasizes its short- and long-term care services, which are delivered by a dedicated team of caregivers who strive to meet and follow a resident’s individualized care plan for a complete healing period. Areas of expertise include wound care, memory care training, post-surgical care, palliative care, hospice care, and therapy (physical, occupational, and speech).
Experience the serenity of Burning Tree Court, Bowie, MD, with Green Haven Assisted Living, a distinguished community that focuses on assisted living. Residents receive top-notch care and assistance for their specific needs, alongside purposely designed private and semi-private accommodations for better comfort and convenience. Housekeeping, laundry, and secure amenities are provided to ensure a hassle-free lifestyle.
Enjoy fun-filled activities and engaging programs to connect with friends and stay active. Here, residents have a delightful dining experience with delicious and healthy meals catering to their dietary needs and preferences. Respite care, medication management, and scheduled transportation are also provided for residents’ healthcare needs. The community creates a safe place for residents to spend their golden years without hassles.
K & R’s Assisted Living LLC is an assisted living community in Baltimore, MD, offering personal care and memory care. With an intimate, home-like setting, the community ensures older adults can live comfortably throughout their stay. Residents can also experience a maintenance-free lifestyle with 24-hour support, medication management, and well-balanced meals. Through personalized care plans, residents receive exceptional care tailored to their unique needs and preferences.
Light exercises, games, and social events provide residents with more opportunities for residents to explore new interests and have fun. Residents can also rest and freely interact with their surroundings with thoughtfully curated amenities and cozy rooms. Restaurants, shops, and bus stops are also available in the area, ensuring residents have easy access to their necessities and leisure. This assisted living community is a trusted option for senior living in Maryland, especially with its dedication to helping older adults thrive in retirement.
Fatima’s Assisted Living, nestled in Gaithersburg, Maryland, stands as a trustworthy haven for seniors, providing a dependable and welcoming senior living community. The residence ensures residents’ well-being with round-the-clock access to nurses and certified medical technicians for medication management. A dedicated team of on-site CNAs contributes to the attentive care, while daily living activities are supported, and a variety of therapies, including music, dance, and pet therapy, enhance the overall experience.
Embracing a vibrant lifestyle, Fatima’s Assisted Living organizes engaging social trips and fosters active community involvement, ensuring residents remain connected and fulfilled. Nutritious and delightful meals are served daily, and the care extends to providing assistance with daily living activities. The residence takes pride in upholding a clean and organized environment, offering comprehensive housekeeping and laundry services. Fatima’s Assisted Living embodies a commitment to holistic care, enhancing the lives of its residents with personalized attention and a wide range of engaging activities, all within the comforts of a trusted and reliable senior living community.
Overview of Castles of Love Assisted Living at Bowie
Nestled in Bowie, Maryland, Castles of Love is an inviting senior living community that offers residential assisted living services to residents, ages 55 and older. Residents’ care needs are immediately met with 24-hour supervision and monitoring by a compassionate team. With housekeeping and laundry services, case management services, and assistance with activities of daily living, residents are sure to live a convenient and easy lifestyle.
The community features a range of private and semi-private residences, built with safety features and modern conveniences to ensure residents live in comfort and safety. Delicious meals catered to residents’ unique needs are served daily for residents’ nourishment. A team of medication technicians and registered nurses are available to provide extensive services like podiatry services, physicians visit, and pharmacy delivery services, to ensure residents’ healthcare needs are met.
Autumn Lake Healthcare at Loch Raven offers seniors seeking a tranquil environment an ideal residence. Located within Baltimore’s metro area, this facility excels in providing round-the-clock long-term care, subacute rehabilitation, and skilled nursing care.
In addition to these core services, Autumn Lake Healthcare at Lock Raven boasts an array of offerings, including on-site physicians and nurse practitioners, as well as specialized care in hospice, palliative care, and cardio-pulmonary care. They are also equipped to provide IV therapy, joint replacement, and orthopedic care, among other essential services. For those considering nursing home qualifications and exploring nursing homes near you, this home stands as a trusted destination for seniors in search of a restful and supportive home within Baltimore’s metro area.
Autumn Lake Healthcare at Loch Raven is an independently owned and operated healthcare center that is licensed to use the Autumn Lake Healthcare name and receive non-healthcare related services. All healthcare-related services are provided solely by Autumn Lake Healthcare at Loch Raven.
Let go of your worries with the trusted community of All About Caring, located in the serene neighborhood of Baltimore, MD, that offers assisted living. A competent and well-trained team goes above and beyond to help residents maximize their independence while receiving top-notch care and assistance for their special needs and aspirations. Cleaning, laundry, and other household chores are also taken care of, ensuring residents have a hassle-free lifestyle.
Create wonderful moments with friends and join enjoyable activities and exciting events for an active and well-engaged lifestyle. Focusing on residents’ tastes and nutritional needs, the community meticulously prepares delightful meals for the finest dining experience. The community is a good place for those who want to experience the best things in their golden years, especially with its warm and nurturing setting.
Ranking Methodology
How we rank these assisted living communities
Every community above is evaluated across six weighted categories using public data including state inspection records, review platforms, BBB profiles, and operator-published materials.
Weighting overview
- 35%Resident Experience
- 25%Regulatory
- 15%Visual Media
- 10%Website
- 10%Stability
- 5%Environment
01
Resident & Family Experience 35%
The single largest share of every ranking. Aggregated review sentiment and volume from major platforms — the closest signal to real resident experience.
- Includes
- Review Sentiment
- Review Volume
02
Regulatory & Safety Record 25%
State inspection records, citations, and complaint visits. We weight per-inspection rates more heavily than raw counts.
- Includes
- State Inspections
- Citations/Inspection
- % Inspections w/ Citations
- Complaint Visits
- Accreditations
- BBB Rating
03
Visual Media & Transparency 15%
Communities that publish high-quality visuals give families a real preview. No photos or tours = a negative transparency signal.
- Includes
- Video Tours
- Virtual Walkthroughs
- Photo Quantity
- Photo Quality
04
Website & Operator Transparency 10%
Site quality and whether the operator publishes basic accountability information — staff names, contact details, ownership.
- Includes
- Website Content
- Mobile Usability
- Staff Info Available
- Owner Info Available
05
Community Stability 10%
Operational signals indicating whether a community is well-run and meeting demand.
- Includes
- Occupancy Rate
- Bed Options
06
Environment & Pricing 5%
Walkability and pricing transparency. Walk Score is weighted higher for Independent Living than for Memory Care, where most residents do not leave unaccompanied.
- Includes
- Walk Score
- Pricing Transparency
Who we are
Your Senior Care Partner, Every Step of the Way
We help families find affordable senior communities and unlock same day discounts, Medicaid, and Medicare options tailored to your needs.
Contact us Today
Frequently Asked Questions about Assisted Living in Maryland
What's the difference between assisted living and memory care in Maryland?
Assisted living in Maryland supports residents with daily activities (bathing, dressing, medication management) while preserving independence. Memory care is a specialized form of assisted living for residents living with Alzheimer's or dementia, and adds 24/7 secured environments, dementia-trained staff, and structured routines designed to reduce confusion and wandering.
What's the difference between assisted living and a nursing home in Maryland?
Assisted living in Maryland is a residential model focused on housing, hospitality, and help with daily activities. Nursing homes (skilled nursing facilities) provide 24/7 medical care from licensed nurses for residents with significant health needs, and are regulated more strictly under both state and federal CMS rules.
Does Maryland Medicaid cover assisted living?
Maryland Medicaid does not directly pay room-and-board for assisted living, but most states (including Maryland) offer Home and Community-Based Services (HCBS) waivers that can offset the cost of care services delivered inside a licensed community. Eligibility, waitlists, and covered services vary — check directly with the state Medicaid agency.
What is assisted living?
Assisted living combines private or semi-private apartments with help on activities of daily living (meals, bathing, dressing, medication management) and a social calendar — for residents who need some support but do not need 24/7 medical care.
How many assisted living facilities are listed on this page?
This page features 820 assisted living facilities in Maryland. Use the filters and comparison tools above to compare ratings, amenities, and pricing.
How do I choose the right assisted living facility in Maryland?
Start by matching the level of care offered to the resident's current and anticipated needs, then compare licensing status, staff-to-resident ratios, recent inspection results, and pricing. Tour at least two or three communities in Maryland, talk to current residents and families, and confirm what is included in the base rate versus billed as add-on services.
What should I look for when visiting assisted living facilities in Maryland?
Pay attention to staff interactions with residents, cleanliness and odor, food quality at meal times, the activity calendar, and how questions about pricing and care plans are answered. Ask to see the most recent state inspection report, the move-out / level-of-care-change policy, and a sample monthly bill that lists every fee.
Updated on
