


Where in Maryland are you looking?
Browse communities by city.
Compare Memory Care around Maryland
Info below is compiled from the MD Dept. of Health (OHCQ), senior community websites & trusted data sources such as Walk Score & BBB.
Communities are listed from highest to lowest based on our ranking methodology.
| Bedford Court, a CCRC | MC AL HOS IL NH RC SNF | Silver Spring (International Drive) | 76
Facility
76
MD AVG
42
Rank
#174 / 685 | Yes |
64
Facility
64
MD AVG
43
Rank
#261 / 985 | Studio / 1 Bed | 34
Facility
34
MD AVG
21
Rank
#22 / 210 | - |
15% Male Residents — State Benchmarked 15% of residents are male, compared to the Maryland average of 31%. This facility caters to a majority female resident pool (85% female), consistent with the broader assisted living trend where women significantly outnumber men. |
85% Female Residents — State Benchmarked 85% of residents are female, compared to the Maryland average of 69%. Women comprise the large majority, consistent with national assisted living demographics where women live longer and enter care facilities at higher rates. |
95% White Residents — State Benchmarked 95% of residents are reported as White, compared to the Maryland average of 81%. A higher White share than is typical for assisted living in Maryland in this dataset — compare with peer facilities for local context. |
3% African American Residents — State Benchmarked 3% of residents are reported as African American or Black, compared to the Maryland average of 13%. A lower African American share than is typical in Maryland; local markets still vary widely. |
2% Other Ethnicity Residents — State Benchmarked 2% of residents fall into categories other than White or African American (combined), compared to the Maryland average of 6%. This column aggregates Hispanic, Asian, multiracial, and any other labeled groups that are not classified as White or African American. Reported subgroups in this total: Asian (2%). |
2% Residents Age 65–74 — State Benchmarked 2% of residents are 65–74, compared to the Maryland average of 13%. Fewer younger seniors suggests the resident population skews older, likely requiring higher acuity care and more hands-on support. |
8% Residents Age 75–84 — State Benchmarked 8% of residents are 75–84, compared to the Maryland average of 31%. Below the state norm — the resident mix may skew either younger or older than this typical middle bracket. |
65% Residents Age 85–94 — State Benchmarked 65% of residents are 85–94, compared to the Maryland average of 44%. A high concentration of very elderly residents signals a higher-acuity facility with experience caring for advanced age-related needs. |
26% Residents Age 95+ — State Benchmarked 26% of residents are 95 or older, compared to the Maryland average of 16%. A high proportion of the oldest-old suggests strong end-of-life care experience and very-high-acuity capabilities. |
| Edenwald Senior Living | MC AL IL NH SNF | Towson (Southerly Road) | 94
Facility
94
MD AVG
42
Rank
#139 / 685 | No |
83
Facility
83
MD AVG
43
Rank
#70 / 985 | 1 Bed / 2 Bed | - | A+ |
18% Male Residents — State Benchmarked 18% of residents are male, compared to the Maryland average of 31%. This facility caters to a majority female resident pool (82% female), consistent with the broader assisted living trend where women significantly outnumber men. |
82% Female Residents — State Benchmarked 82% of residents are female, compared to the Maryland average of 69%. Women comprise the large majority, consistent with national assisted living demographics where women live longer and enter care facilities at higher rates. |
100% White Residents — State Benchmarked 100% of residents are reported as White, compared to the Maryland average of 81%. A higher White share than is typical for assisted living in Maryland in this dataset — compare with peer facilities for local context. |
0% African American Residents — State Benchmarked 0% of residents are reported as African American or Black, compared to the Maryland average of 13%. A lower African American share than is typical in Maryland; local markets still vary widely. |
0% Other Ethnicity Residents — State Benchmarked 0% of residents fall into categories other than White or African American (combined), compared to the Maryland average of 6%. This column aggregates Hispanic, Asian, multiracial, and any other labeled groups that are not classified as White or African American. | - |
13% Residents Age 75–84 — State Benchmarked 13% of residents are 75–84, compared to the Maryland average of 31%. Below the state norm — the resident mix may skew either younger or older than this typical middle bracket. |
53% Residents Age 85–94 — State Benchmarked 53% of residents are 85–94, compared to the Maryland average of 44%. A high concentration of very elderly residents signals a higher-acuity facility with experience caring for advanced age-related needs. |
35% Residents Age 95+ — State Benchmarked 35% of residents are 95 or older, compared to the Maryland average of 16%. A high proportion of the oldest-old suggests strong end-of-life care experience and very-high-acuity capabilities. |
| Sunrise of Rockville | MC AL HOS | Rockville (Baltimore Road) | 89
Facility
89
MD AVG
42
Rank
#150 / 685 | Yes |
89
Facility
89
MD AVG
43
Rank
#32 / 985 | Studio / 1 Bed / 2 Bed | 45
Facility
45
MD AVG
21
Rank
#4 / 210 | A- |
23% Male Residents — State Benchmarked 23% of residents are male, compared to the Maryland average of 31%. This facility caters to a majority female resident pool (77% female), consistent with the broader assisted living trend where women significantly outnumber men. |
77% Female Residents — State Benchmarked 77% of residents are female, compared to the Maryland average of 69%. Women comprise the large majority, consistent with national assisted living demographics where women live longer and enter care facilities at higher rates. |
87% White Residents — State Benchmarked 87% of residents are reported as White, compared to the Maryland average of 81%. Close to the average for this category among assisted living facilities in Maryland with reported race/ethnicity data. |
2% African American Residents — State Benchmarked 2% of residents are reported as African American or Black, compared to the Maryland average of 13%. A lower African American share than is typical in Maryland; local markets still vary widely. |
11% Other Ethnicity Residents — State Benchmarked 11% of residents fall into categories other than White or African American (combined), compared to the Maryland average of 6%. This column aggregates Hispanic, Asian, multiracial, and any other labeled groups that are not classified as White or African American. Reported subgroups in this total: Mixed Race (6%), Hispanic (3%), Asian (2%). |
3% Residents Age 65–74 — State Benchmarked 3% of residents are 65–74, compared to the Maryland average of 13%. Fewer younger seniors suggests the resident population skews older, likely requiring higher acuity care and more hands-on support. |
31% Residents Age 75–84 — State Benchmarked 31% of residents are 75–84, compared to the Maryland average of 31%. This is the second most common age bracket in assisted living, representing residents with moderate care needs. |
56% Residents Age 85–94 — State Benchmarked 56% of residents are 85–94, compared to the Maryland average of 44%. A high concentration of very elderly residents signals a higher-acuity facility with experience caring for advanced age-related needs. |
10% Residents Age 95+ — State Benchmarked 10% of residents are 95 or older, compared to the Maryland average of 16%. Most residents here have not yet reached the oldest-old bracket, suggesting a younger overall community. |
| Maplewood Park Place | MC AL IL NH SNF | Bethesda (Pooks Hill) | 29
Facility
29
MD AVG
42
Rank
#240 / 685 | Yes |
38
Facility
38
MD AVG
43
Rank
#542 / 985 | 1 Bed / 2 Bed | 30
Facility
30
MD AVG
21
Rank
#44 / 210 | - |
18% Male Residents — State Benchmarked 18% of residents are male, compared to the Maryland average of 31%. This facility caters to a majority female resident pool (82% female), consistent with the broader assisted living trend where women significantly outnumber men. |
82% Female Residents — State Benchmarked 82% of residents are female, compared to the Maryland average of 69%. Women comprise the large majority, consistent with national assisted living demographics where women live longer and enter care facilities at higher rates. |
100% White Residents — State Benchmarked 100% of residents are reported as White, compared to the Maryland average of 81%. A higher White share than is typical for assisted living in Maryland in this dataset — compare with peer facilities for local context. |
0% African American Residents — State Benchmarked 0% of residents are reported as African American or Black, compared to the Maryland average of 13%. A lower African American share than is typical in Maryland; local markets still vary widely. |
0% Other Ethnicity Residents — State Benchmarked 0% of residents fall into categories other than White or African American (combined), compared to the Maryland average of 6%. This column aggregates Hispanic, Asian, multiracial, and any other labeled groups that are not classified as White or African American. | - |
6% Residents Age 75–84 — State Benchmarked 6% of residents are 75–84, compared to the Maryland average of 31%. Below the state norm — the resident mix may skew either younger or older than this typical middle bracket. |
24% Residents Age 85–94 — State Benchmarked 24% of residents are 85–94, compared to the Maryland average of 44%. The population here skews younger than the statewide norm, which may indicate a more active, lower-acuity community. |
71% Residents Age 95+ — State Benchmarked 71% of residents are 95 or older, compared to the Maryland average of 16%. A high proportion of the oldest-old suggests strong end-of-life care experience and very-high-acuity capabilities. |
| Ingleside at King Farm | MC AL IL NH SNF | Rockville (King Farm) | 45
Facility
45
MD AVG
42
Rank
#219 / 685 | Yes |
73
Facility
73
MD AVG
43
Rank
#152 / 985 | 1 Bed / 2 Bed | - | - | - | - | - | - | - | - | - | - | - |
| Homewood Living Frederick | MC AL IL NH SNF | Frederick | 120
Facility
120
MD AVG
42
Rank
#73 / 685 | Yes |
14
Facility
14
MD AVG
43
Rank
#788 / 985 | 1 Bed / 2 Bed | - | - | - | - | - | - | - | - | - | - | - |
| Residences at Vantage Point | MC AL HC IL NH SNF | Columbia (Town Center) | 44
Facility
44
MD AVG
42
Rank
#222 / 685 | Yes |
52
Facility
52
MD AVG
43
Rank
#402 / 985 | Studio / 1 Bed / 2 Bed | 36
Facility
36
MD AVG
21
Rank
#16 / 210 | - | - | - | - | - | - | - | - | - | - |
| Buckingham‘s Choice | MC AL NH RC SNF | Adamstown (Baker Circle) | 42
Facility
42
MD AVG
42
Rank
#223 / 685 | No |
3
Facility
3
MD AVG
43
Rank
#930 / 985 | Private Rooms | 31
Facility
31
MD AVG
21
Rank
#39 / 210 | - | - | - | - | - | - | - | - | - | - |
| Sunrise of Pikesville | MC NH AL HOS | Pikesville (Old Court Road) | 96
Facility
96
MD AVG
42
Rank
#131 / 685 | Yes |
75
Facility
75
MD AVG
43
Rank
#131 / 985 | Studio / 1 Bed / 2 Bed | 45
Facility
45
MD AVG
21
Rank
#4 / 210 | A- |
30% Male Residents — State Benchmarked 30% of residents are male, compared to the Maryland average of 31%. This facility caters to a majority female resident pool (70% female), consistent with the broader assisted living trend where women significantly outnumber men. |
70% Female Residents — State Benchmarked 70% of residents are female, compared to the Maryland average of 69%. Women comprise the large majority, consistent with national assisted living demographics where women live longer and enter care facilities at higher rates. |
63% White Residents — State Benchmarked 63% of residents are reported as White, compared to the Maryland average of 81%. A lower White share than the Maryland average — the community may draw a more diverse resident mix relative to other facilities in Maryland. |
37% African American Residents — State Benchmarked 37% of residents are reported as African American or Black, compared to the Maryland average of 13%. A higher African American share than the typical Maryland average — useful context when comparing cultural fit and community composition. |
0% Other Ethnicity Residents — State Benchmarked 0% of residents fall into categories other than White or African American (combined), compared to the Maryland average of 6%. This column aggregates Hispanic, Asian, multiracial, and any other labeled groups that are not classified as White or African American. |
15% Residents Age 65–74 — State Benchmarked 15% of residents are 65–74, compared to the Maryland average of 13%. In line with the statewide profile for this youngest senior bracket in assisted living. |
27% Residents Age 75–84 — State Benchmarked 27% of residents are 75–84, compared to the Maryland average of 31%. This is the second most common age bracket in assisted living, representing residents with moderate care needs. |
41% Residents Age 85–94 — State Benchmarked 41% of residents are 85–94, compared to the Maryland average of 44%. This is typically the most common age bracket in assisted living — this facility is in line with the statewide norm. |
15% Residents Age 95+ — State Benchmarked 15% of residents are 95 or older, compared to the Maryland average of 16%. In line with the statewide profile for the oldest resident bracket. |
| Brighton Gardens of Friendship Heights | MC AL HOS | Chevy Chase (Friendship Boulevard) | 154
Facility
154
MD AVG
42
Rank
#39 / 685 | Yes |
86
Facility
86
MD AVG
43
Rank
#47 / 985 | Studio / 1 Bed / 2 Bed | 29
Facility
29
MD AVG
21
Rank
#48 / 210 | - |
20% Male Residents — State Benchmarked 20% of residents are male, compared to the Maryland average of 31%. This facility caters to a majority female resident pool (80% female), consistent with the broader assisted living trend where women significantly outnumber men. |
80% Female Residents — State Benchmarked 80% of residents are female, compared to the Maryland average of 69%. Women comprise the large majority, consistent with national assisted living demographics where women live longer and enter care facilities at higher rates. |
96% White Residents — State Benchmarked 96% of residents are reported as White, compared to the Maryland average of 81%. A higher White share than is typical for assisted living in Maryland in this dataset — compare with peer facilities for local context. |
1% African American Residents — State Benchmarked 1% of residents are reported as African American or Black, compared to the Maryland average of 13%. A lower African American share than is typical in Maryland; local markets still vary widely. |
3% Other Ethnicity Residents — State Benchmarked 3% of residents fall into categories other than White or African American (combined), compared to the Maryland average of 6%. This column aggregates Hispanic, Asian, multiracial, and any other labeled groups that are not classified as White or African American. Reported subgroups in this total: Asian (2%), Hispanic (1%). |
3% Residents Age 65–74 — State Benchmarked 3% of residents are 65–74, compared to the Maryland average of 13%. Fewer younger seniors suggests the resident population skews older, likely requiring higher acuity care and more hands-on support. |
31% Residents Age 75–84 — State Benchmarked 31% of residents are 75–84, compared to the Maryland average of 31%. This is the second most common age bracket in assisted living, representing residents with moderate care needs. |
49% Residents Age 85–94 — State Benchmarked 49% of residents are 85–94, compared to the Maryland average of 44%. A high concentration of very elderly residents signals a higher-acuity facility with experience caring for advanced age-related needs. |
15% Residents Age 95+ — State Benchmarked 15% of residents are 95 or older, compared to the Maryland average of 16%. In line with the statewide profile for the oldest resident bracket. |
| Sunrise of Frederick | MC AL | Frederick (Waterford) | 88
Facility
88
MD AVG
42
Rank
#152 / 685 | Yes |
62
Facility
62
MD AVG
43
Rank
#286 / 985 | Studio / Suite / 2 Bed | 45
Facility
45
MD AVG
21
Rank
#4 / 210 | A- |
31% Male Residents — State Benchmarked 31% of residents are male, compared to the Maryland average of 31%. This facility caters to a majority female resident pool (69% female), consistent with the broader assisted living trend where women significantly outnumber men. |
69% Female Residents — State Benchmarked 69% of residents are female, compared to the Maryland average of 69%. Women comprise the large majority, consistent with national assisted living demographics where women live longer and enter care facilities at higher rates. |
97% White Residents — State Benchmarked 97% of residents are reported as White, compared to the Maryland average of 81%. A higher White share than is typical for assisted living in Maryland in this dataset — compare with peer facilities for local context. |
2% African American Residents — State Benchmarked 2% of residents are reported as African American or Black, compared to the Maryland average of 13%. A lower African American share than is typical in Maryland; local markets still vary widely. |
2% Other Ethnicity Residents — State Benchmarked 2% of residents fall into categories other than White or African American (combined), compared to the Maryland average of 6%. This column aggregates Hispanic, Asian, multiracial, and any other labeled groups that are not classified as White or African American. Reported subgroups in this total: Hispanic (2%). |
10% Residents Age 65–74 — State Benchmarked 10% of residents are 65–74, compared to the Maryland average of 13%. Fewer younger seniors suggests the resident population skews older, likely requiring higher acuity care and more hands-on support. |
34% Residents Age 75–84 — State Benchmarked 34% of residents are 75–84, compared to the Maryland average of 31%. This is the second most common age bracket in assisted living, representing residents with moderate care needs. |
48% Residents Age 85–94 — State Benchmarked 48% of residents are 85–94, compared to the Maryland average of 44%. This is typically the most common age bracket in assisted living — this facility is in line with the statewide norm. |
6% Residents Age 95+ — State Benchmarked 6% of residents are 95 or older, compared to the Maryland average of 16%. Most residents here have not yet reached the oldest-old bracket, suggesting a younger overall community. |
| Sterling Care Hillhaven Assisted Living and Memory Care | MC AL HOS NH SNF | Adelphi (Knollwood) | 66
Facility
66
MD AVG
42
Rank
#188 / 685 | No |
25
Facility
25
MD AVG
43
Rank
#684 / 985 | Studio / 1 Bed | - | - | - | - | - | - | - | - | - | - | - |
| Sunrise of Columbia | MC AL HOS RC | Columbia (Hickory Ridge) | 96
Facility
96
MD AVG
42
Rank
#131 / 685 | Yes |
53
Facility
53
MD AVG
43
Rank
#393 / 985 | Studio / 1 Bed / 2 Bed | 45
Facility
45
MD AVG
21
Rank
#4 / 210 | A- |
31% Male Residents — State Benchmarked 31% of residents are male, compared to the Maryland average of 31%. This facility caters to a majority female resident pool (69% female), consistent with the broader assisted living trend where women significantly outnumber men. |
69% Female Residents — State Benchmarked 69% of residents are female, compared to the Maryland average of 69%. Women comprise the large majority, consistent with national assisted living demographics where women live longer and enter care facilities at higher rates. |
88% White Residents — State Benchmarked 88% of residents are reported as White, compared to the Maryland average of 81%. Close to the average for this category among assisted living facilities in Maryland with reported race/ethnicity data. |
5% African American Residents — State Benchmarked 5% of residents are reported as African American or Black, compared to the Maryland average of 13%. In line with the Maryland average for African American residents among facilities reporting this breakdown. |
6% Other Ethnicity Residents — State Benchmarked 6% of residents fall into categories other than White or African American (combined), compared to the Maryland average of 6%. This column aggregates Hispanic, Asian, multiracial, and any other labeled groups that are not classified as White or African American. Reported subgroups in this total: Asian (4%), American Indian (1%), Hispanic (1%). |
6% Residents Age 65–74 — State Benchmarked 6% of residents are 65–74, compared to the Maryland average of 13%. Fewer younger seniors suggests the resident population skews older, likely requiring higher acuity care and more hands-on support. |
38% Residents Age 75–84 — State Benchmarked 38% of residents are 75–84, compared to the Maryland average of 31%. A high concentration in this mid-range bracket, where residents typically need moderate support with daily activities. |
36% Residents Age 85–94 — State Benchmarked 36% of residents are 85–94, compared to the Maryland average of 44%. The population here skews younger than the statewide norm, which may indicate a more active, lower-acuity community. |
19% Residents Age 95+ — State Benchmarked 19% of residents are 95 or older, compared to the Maryland average of 16%. In line with the statewide profile for the oldest resident bracket. |
| Asbury Methodist Village | MC AL IL NH SNF | Gaithersburg (Russell Avenue) | 164
Facility
164
MD AVG
42
Rank
#26 / 685 | Yes |
41
Facility
41
MD AVG
43
Rank
#508 / 985 | - | 27
Facility
27
MD AVG
21
Rank
#62 / 210 | - |
21% Male Residents — State Benchmarked 21% of residents are male, compared to the Maryland average of 31%. This facility caters to a majority female resident pool (79% female), consistent with the broader assisted living trend where women significantly outnumber men. |
79% Female Residents — State Benchmarked 79% of residents are female, compared to the Maryland average of 69%. Women comprise the large majority, consistent with national assisted living demographics where women live longer and enter care facilities at higher rates. |
92% White Residents — State Benchmarked 92% of residents are reported as White, compared to the Maryland average of 81%. A higher White share than is typical for assisted living in Maryland in this dataset — compare with peer facilities for local context. |
1% African American Residents — State Benchmarked 1% of residents are reported as African American or Black, compared to the Maryland average of 13%. A lower African American share than is typical in Maryland; local markets still vary widely. |
7% Other Ethnicity Residents — State Benchmarked 7% of residents fall into categories other than White or African American (combined), compared to the Maryland average of 6%. This column aggregates Hispanic, Asian, multiracial, and any other labeled groups that are not classified as White or African American. Reported subgroups in this total: Asian (7%). |
1% Residents Age 65–74 — State Benchmarked 1% of residents are 65–74, compared to the Maryland average of 13%. Fewer younger seniors suggests the resident population skews older, likely requiring higher acuity care and more hands-on support. |
21% Residents Age 75–84 — State Benchmarked 21% of residents are 75–84, compared to the Maryland average of 31%. Below the state norm — the resident mix may skew either younger or older than this typical middle bracket. |
48% Residents Age 85–94 — State Benchmarked 48% of residents are 85–94, compared to the Maryland average of 44%. This is typically the most common age bracket in assisted living — this facility is in line with the statewide norm. |
30% Residents Age 95+ — State Benchmarked 30% of residents are 95 or older, compared to the Maryland average of 16%. A high proportion of the oldest-old suggests strong end-of-life care experience and very-high-acuity capabilities. |
| Morningside House At Satyr Hill | MC AL HOS RC | Parkville (Woodcroft) | 125
Facility
125
MD AVG
42
Rank
#68 / 685 | Yes |
72
Facility
72
MD AVG
43
Rank
#160 / 985 | Private Rooms / Semi-Private Rooms | 28
Facility
28
MD AVG
21
Rank
#53 / 210 | A+ |
34% Male Residents — State Benchmarked 34% of residents are male, compared to the Maryland average of 31%. This facility caters to a majority female resident pool (66% female), consistent with the broader assisted living trend where women significantly outnumber men. |
66% Female Residents — State Benchmarked 66% of residents are female, compared to the Maryland average of 69%. Women comprise the large majority, consistent with national assisted living demographics where women live longer and enter care facilities at higher rates. |
98% White Residents — State Benchmarked 98% of residents are reported as White, compared to the Maryland average of 81%. A higher White share than is typical for assisted living in Maryland in this dataset — compare with peer facilities for local context. |
2% African American Residents — State Benchmarked 2% of residents are reported as African American or Black, compared to the Maryland average of 13%. A lower African American share than is typical in Maryland; local markets still vary widely. |
0% Other Ethnicity Residents — State Benchmarked 0% of residents fall into categories other than White or African American (combined), compared to the Maryland average of 6%. This column aggregates Hispanic, Asian, multiracial, and any other labeled groups that are not classified as White or African American. |
13% Residents Age 65–74 — State Benchmarked 13% of residents are 65–74, compared to the Maryland average of 13%. In line with the statewide profile for this youngest senior bracket in assisted living. |
40% Residents Age 75–84 — State Benchmarked 40% of residents are 75–84, compared to the Maryland average of 31%. A high concentration in this mid-range bracket, where residents typically need moderate support with daily activities. |
29% Residents Age 85–94 — State Benchmarked 29% of residents are 85–94, compared to the Maryland average of 44%. The population here skews younger than the statewide norm, which may indicate a more active, lower-acuity community. |
16% Residents Age 95+ — State Benchmarked 16% of residents are 95 or older, compared to the Maryland average of 16%. In line with the statewide profile for the oldest resident bracket. |
Rows per page:

View all Nearby Homes
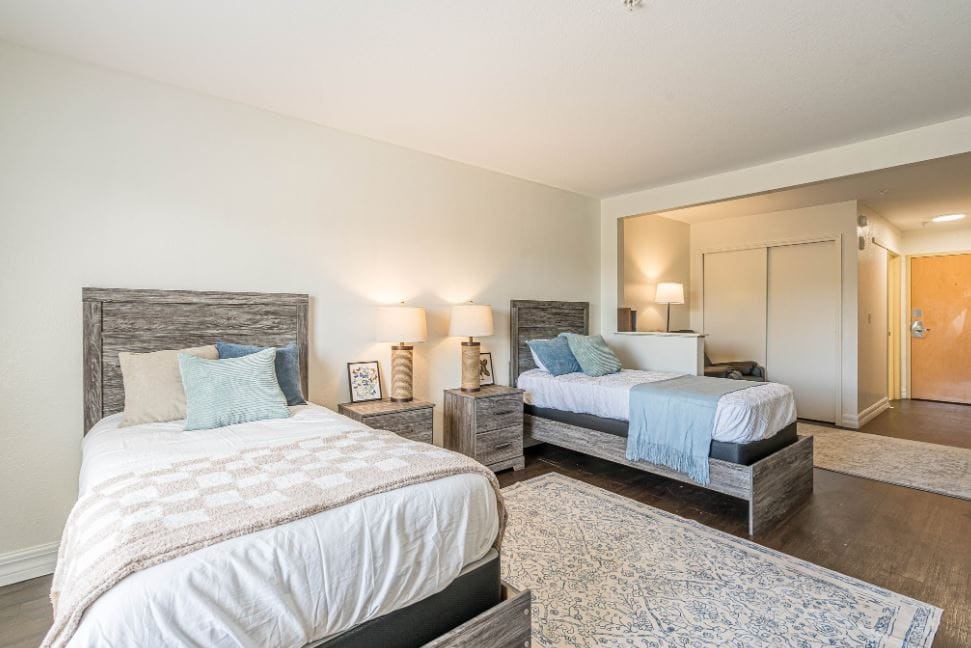
Conveniently located in the harmonious residential area of East Jefferson Street, Rockville, MD, Ring House Independent Living Apartments is a blissful retreat that offers independent living. Featuring cozy and specially designed studio to two-bedroom floor plans, residents are guaranteed to find the accommodation that best matches their preferences. The community also offers round-the-clock concierge to assist residents with their day-to-day activities.
With a carefully curated calendar of fun activities and enriching programs, residents gain meaningful experiences and meet new friends. Therapy services, including physical, occupational, and speech therapy, are also available in the community with its rehab suite. Here, residents retain their independence while doing the things they love, surrounded by the community’s welcoming spaces.
Overview of Cedar Glen Memory Care Home


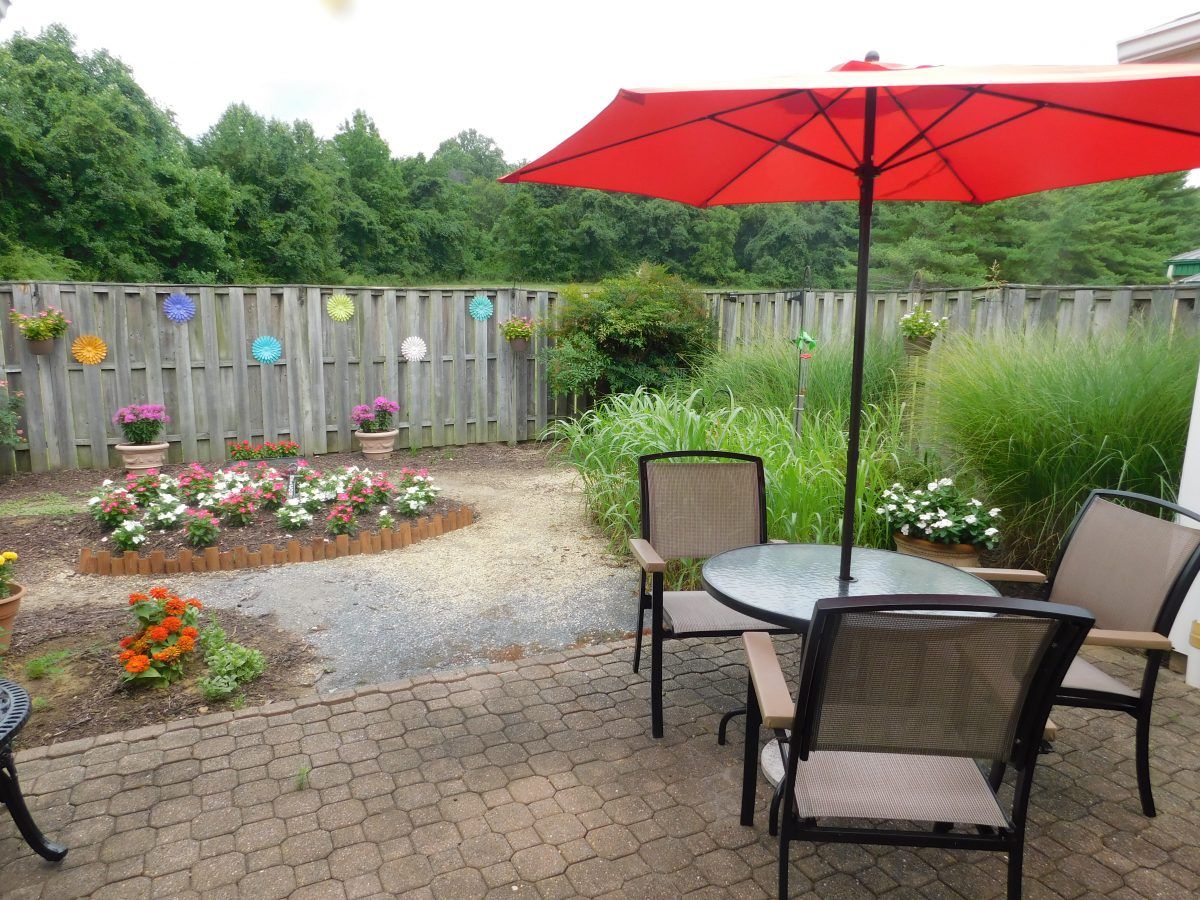
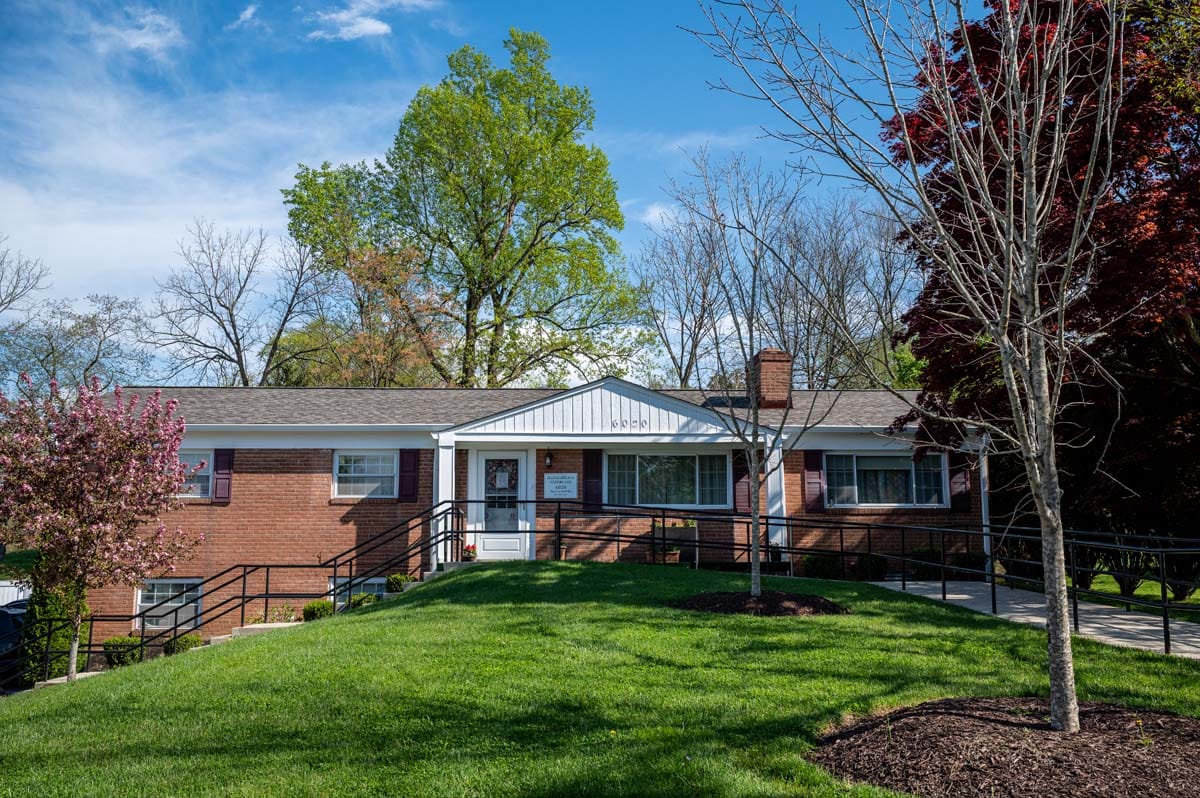
Rockville families looking at Cedar Glen Memory Care Home will find it on Pipestem Court, in a single-story building where every resident has a private room. Cars are the main way to get around this part of town. A Walk Score of 23 backs that up, marking the area as car-dependent, with most errands out of easy walking distance.
Morning staffing runs at one caregiver for every three residents. That number changes by evening, when it becomes one caregiver for every four. Day or night, someone is always on duty. Nursing services run alongside a doctor who is on staff. When residents need it, rehabilitation services and respite care are also available to them.
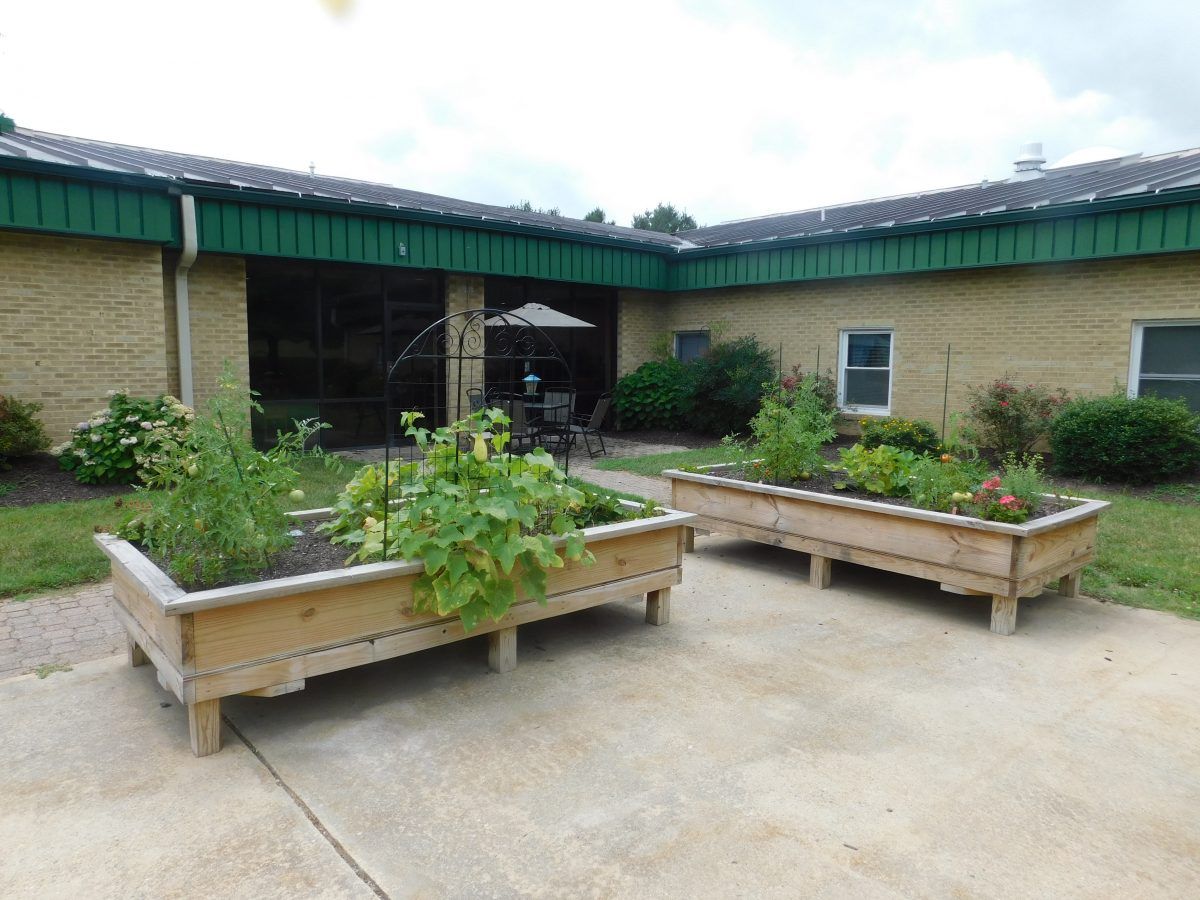
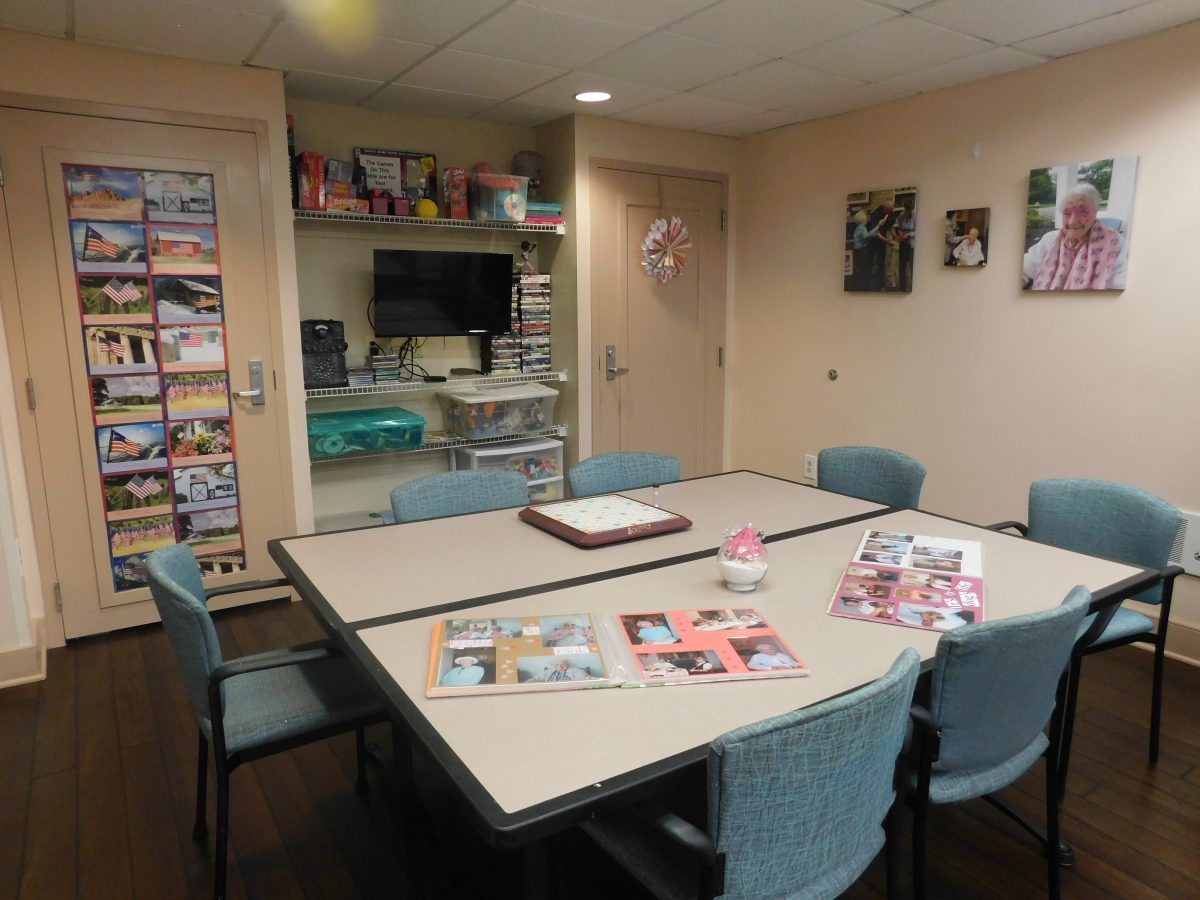
Families facing end-of-life care will find a program built specifically for that stage. Rather than sticking to a fixed schedule, staff shape daily activities around what each resident already likes to do. Art, music, and light exercise show up often in that mix. Every meal is home-cooked, not brought in from outside, and a large backyard garden gives residents room to sit or walk outdoors. Staff also handle the housekeeping, which frees up time and energy for residents and their families.
Medicare is accepted at Cedar Glen, something worth knowing for a family working out how to pay for care. The staffing numbers, the presence of medical support on site, and the dedicated end-of-life program point to a specific kind of resident: someone whose memory care needs call for steady, hands-on attention rather than a lighter touch.
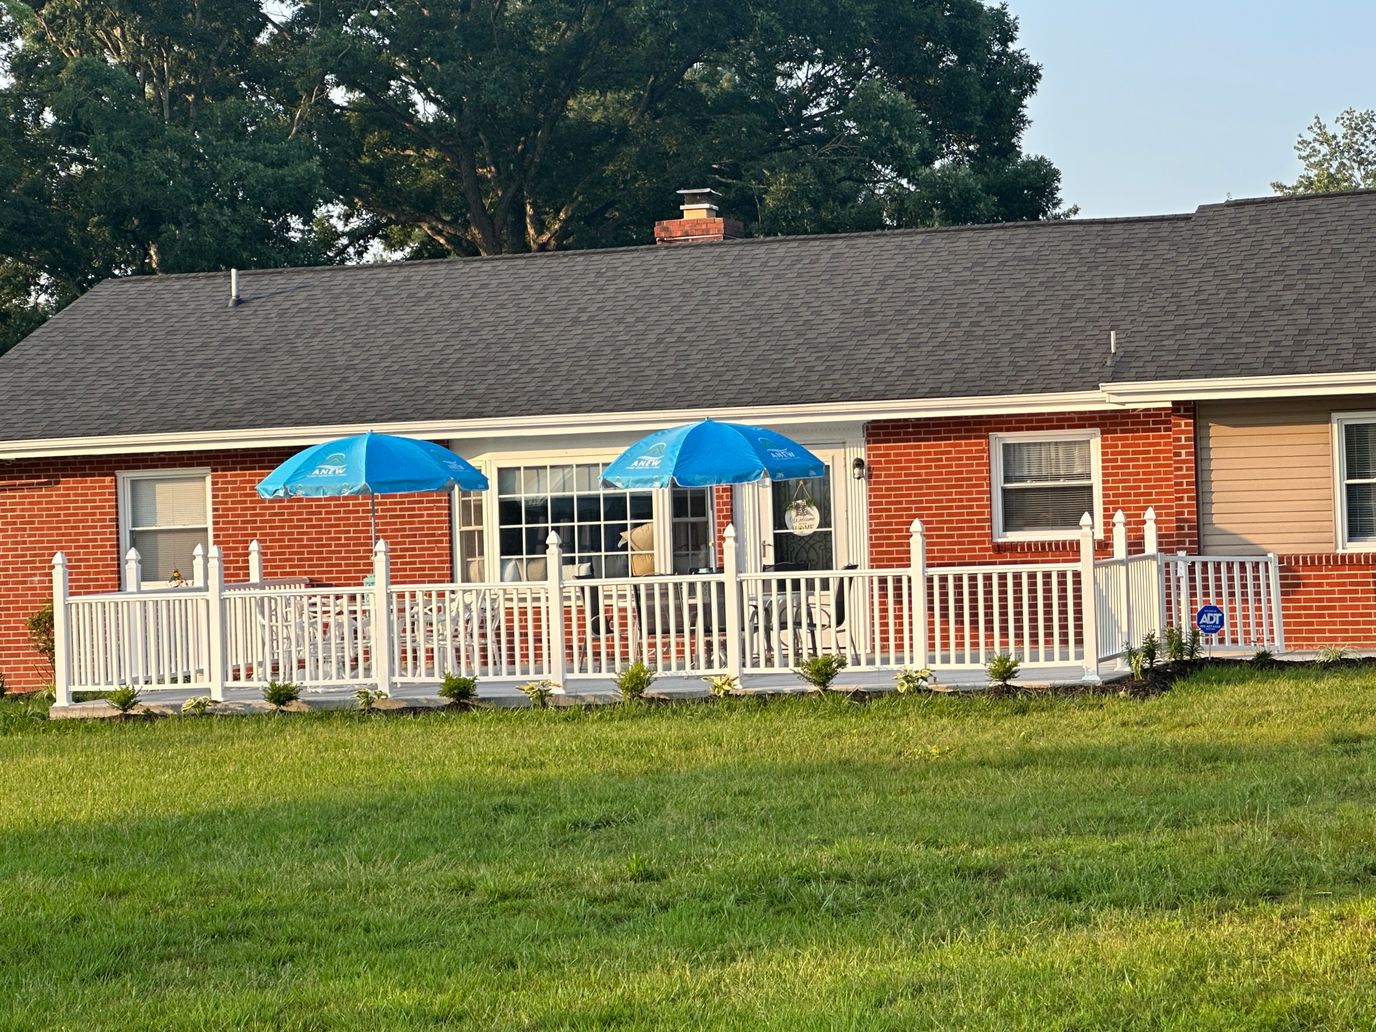
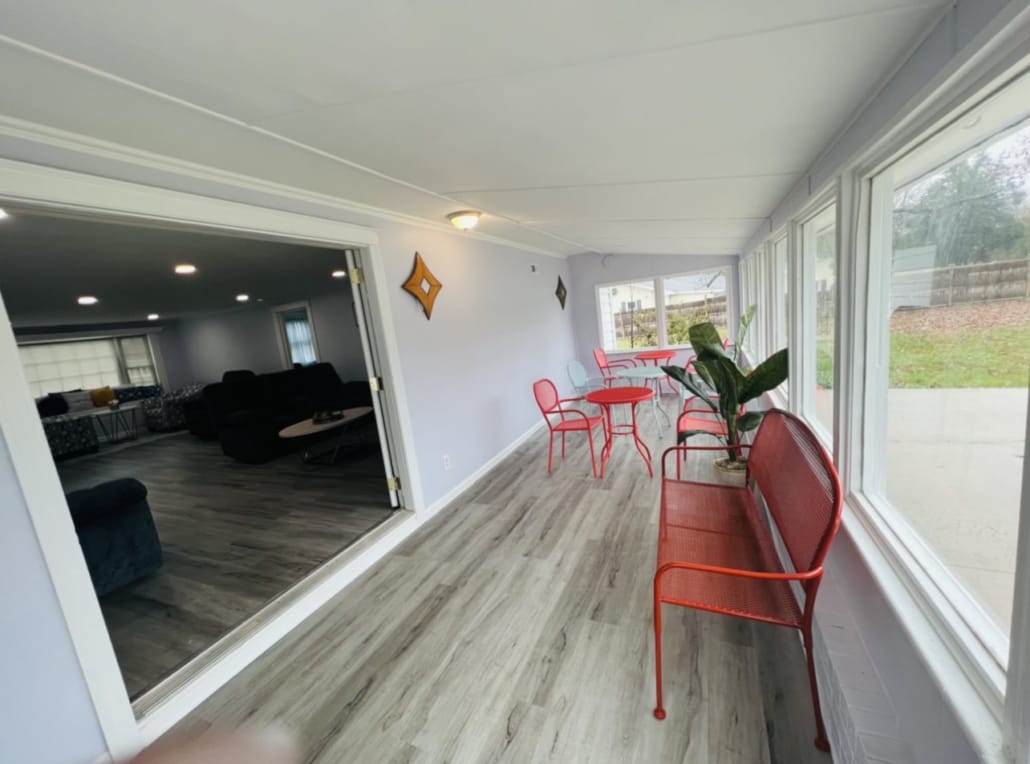
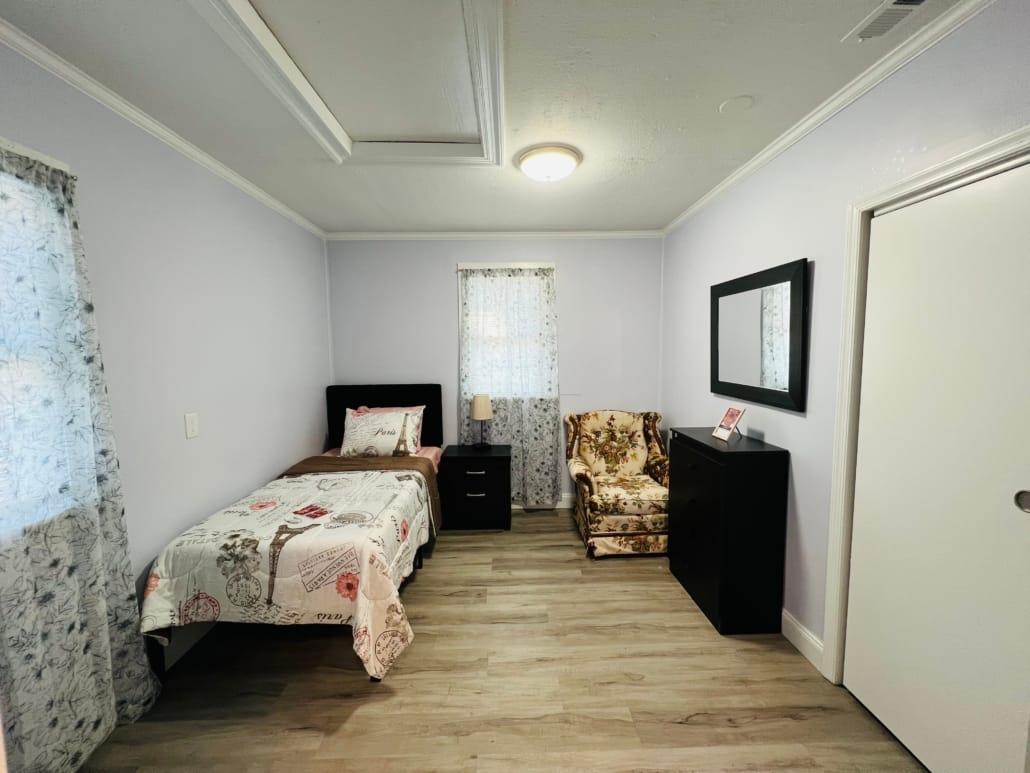
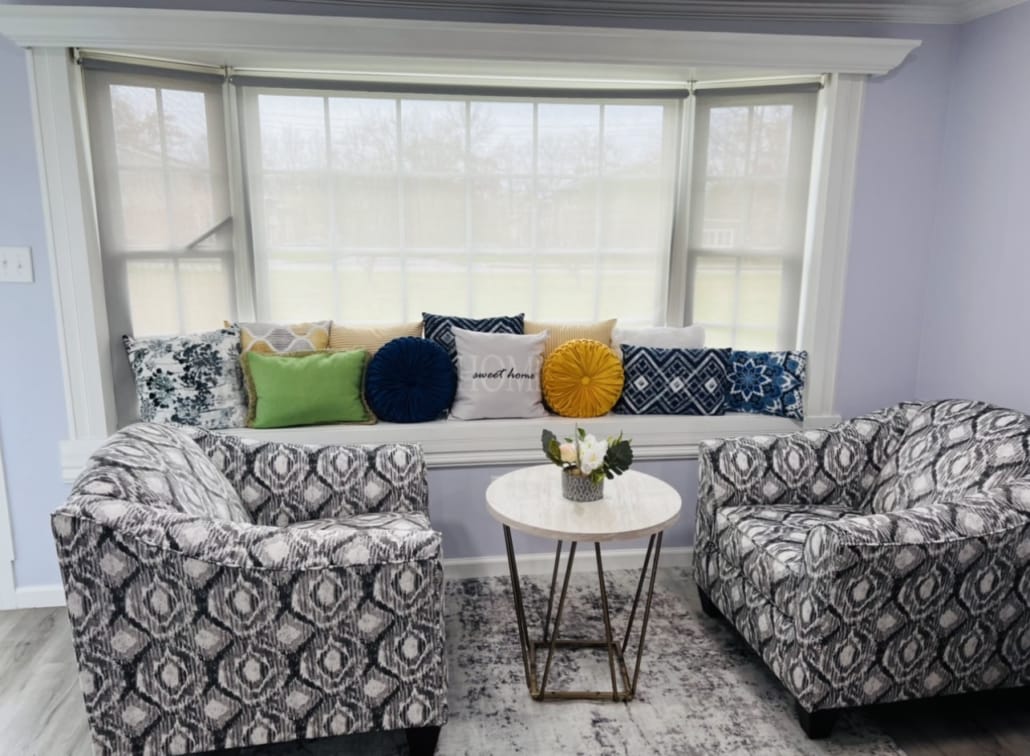
Overview of A New Home Assisted Living

A community dedicated to creating a nurturing environment built on comfort, dignity, and respect, ANew Home is a trusted assisted living home in North East, Maryland, that offers resort-style living in serene surroundings. Residents will discover world-class hospitality and family-like treatment that are vital to enriching each individual’s lifestyle. Management believes cultivating deep, genuine friendships between staff and residents enhances the retirement experience. Driven by ambition and compassion, ANew Home strives to offer the highest quality of care in a tight-knit community.
ANew Home practices an individual-focused approach to assisted living care, promoting a comfortable and secure environment that helps residents thrive. Seniors will discover world-class hospitality from its comprehensive services, such as ADLs, medication management, mobility support, incontinence, respite stays, and recreational activities. Community amenities include a library, a fitness center, an arts and crafts center, and an outdoor pool– among many others.
Montgomery Eldercare at Orchard Way is an astounding community located in the peaceful neighborhood of Orchard Way, Silver Spring, MD, offering memory care. Dedicated to enhancing residents’ quality of life, the community provides top-notch care and assistance with a kind and highly trained team available around the clock. Residents also enjoy a worry-free lifestyle with the community handling the housekeeping, laundry, and other day-to-day activities.
With the community’s various entertainment options, residents are encouraged to do the things they love and interact with their newfound friends. Delicious and healthy meals are also served for residents’ dietary needs and preferences. Hospice and respite care are also available to meet residents’ preferences and unique needs. Live a blissful retirement with the community’s cozy amenities and dedicated care.
Age gracefully at At Home Assisted Living Facility, a blissful retreat in Waldorf, MD, offering assisted living. Committed to residents’ welfare, a compassionate and well-trained team provides exceptional assistance with their daily living activities around the clock. Residents are guaranteed the utmost comfort and safety in the community’s nurturing and welcoming environment.
A thoughtfully planned calendar of exciting events and fun recreational programs is conducted, encouraging residents to live actively and make new friends. Residents have a delightful dining experience with delicious and well-balanced dining options that cater to their dietary needs and preferences. The community is a great option for those needing assistance to live comfortably in retirement.
The Residence at Eden Green is an 85-bed assisted living and memory care community located at 410 Colonial Drive in Denton, Maryland. Serving older adults in Caroline County, the facility is situated on 28 acres along the Eastern Shore and accepts Medicaid.
Monthly pricing starts at $5,725 for semi-private accommodations and $6,950 for private rooms. Current occupancy figures are not reported in the available source data, so families should inquire directly regarding availability and potential waitlists.
The Maryland Department of Health, Office of Health Care Quality, oversees the inspection of this facility. No specific inspection history is available in the current source records, and the community maintains a citations-per-inspection rate of zero. Records indicate that no civil money penalties or payment denials have been imposed by CMS within the past three years.
The facility offers 16 confirmed amenities, including a fitness center, rehabilitation clinic, craft room, library, and computer center. Outdoor spaces feature a lake, patios, and garden areas. Controlled access entry is in place for security. The dining program provides three daily meals, and resident programming includes recreational, educational, and spiritual activities. Respite care is available for short-term stays.
Families seeking assisted living or memory care in a large-scale residential setting on the Eastern Shore may find this facility suitable. Families evaluating The Residence at Eden Green should confirm the administrator, current occupancy, and the full inspection history directly with the Maryland Department of Health before making a placement decision.
CareVilla Blue Spruce is a one-of-a-kind community located near serene parks in Blue Spruce Lane, Silver Spring, MD, offering assisted living, memory care, palliative care, and short-term care. Dedicated to improving residents’ quality of life, the community promotes a cozy and quaint setting with five beds and top-notch care and assistance around the clock. Here, residents keep their peace of mind with the community’s specially designed amenities and friendly environment.
Fun activities and engaging programs are also conducted for residents to remain active and well-connected. Housekeeping, laundry services, and meal preparation are provided to ensure residents enjoy a maintenance-free lifestyle. The community also offers medication management, continence management, and diagnosis management for residents’ healthcare needs. Spend your golden years receiving the utmost care and support you deserve with the community’s genuine care and stress-free spaces.
Overview of Regency Park Assisted Living Facility

Offering assisted living and memory care services, Regency Park Assisted Living Facility is a one-story residential community in the Robert Crain Highway neighborhood of Gambrills, Maryland. This dual-care model allows occupants with different needs to stay in the same community, whether needing help with daily tasks or living with memory loss. The facility caters to residents in private or semi-private rooms, giving families and individuals flexibility in choosing spaces that fit their lifestyle and budget.
Located about 3 miles from Gambrills’ city center, Regency Park Assisted Living Facility sits in a car-dependent area (Walk Score of 23). Here, most errands require personal transportation. The nearest hospital, Fresenius Medical Care at Anne Arundel Medical Center, is around 8.2 miles away. To address mobility challenges, the home provides transportation services, ensuring occupants can access appointments and activities without depending on their vehicles. Regency Park Assisted Living Facility emphasizes staying active and engaged. Offered on-site are fitness and recreation options, giving residents built-in opportunities to maintain physical activity and connect socially without having to seek such services elsewhere. Whether it’s staying fit or enjoying recreational programs, these offerings bolster residents’ overall well-being and independence. Medicaid and private-pay occupants are welcome
Regency Park Assisted Living Facility welcomes queries from individuals and families checking out assisted living or memory care choices in Anne Arundel County.
Overview of Regency Park Senior Living
Located along the Robert Crain Highway corridor in Gambrills, Maryland, Regency Park Senior Living is a senior living community offering assisted living and memory care. The community is housed in a two-story building with studio residences. It’s a smaller setting that may appeal to families looking for a more intimate environment than a larger campus-style community.
Residents receive support with medication management, personal care, transfers, housekeeping, and laundry, providing the hands-on assistance many people need as daily care requirements increase. Transportation services and fitness and recreation programs are also available. The community welcomes pets, so residents can keep a companion animal during their stay.
The neighborhood has a Walk Score of 23, which is car-dependent. Most errands and outings require a vehicle, making the community’s transportation services useful for residents who no longer drive. Anne Arundel Medical Center is about 8.23 miles away, providing residents and families with access to nearby hospital care when needed.
Families considering Regency Park Senior Living can ask about current staffing levels, daily activity schedules, and memory care programming.
Located in the heart of Derwood, Maryland, AlfredHouse Needwood has recently undergone a thoughtful renovation, offering a fresh and inviting atmosphere. Within its walls, one finds tastefully designed private rooms, seamlessly blending affordability with uncompromised quality. The hallmark of this cherished residence is its simple yet comforting home-like environment, a haven where seniors can thrive. With a specialized focus on Alzheimer’s and dementia care, AlfredHouse Needwood provides expert attention to residents’ unique needs, offering a dedicated memory care unit that ensures the utmost comfort and support.
Convenience abounds as the community boasts easy access to essential medical facilities, shopping centers, and delightful restaurants, ensuring residents enjoy a well-rounded and fulfilling lifestyle. Since its inception in 1992, AlfredHouse Needwood has been dedicated to providing exceptional service, embracing a holistic approach to care that includes diabetic and incontinence care. A true celebration of life, the residence takes pride in crafting memorable moments, from special occasions to vibrant events and cherished holiday festivities, ensuring that every senior’s stay is both lively and meaningful within their dedicated memory care community.
Ranking Methodology
How we rank these memory care communities
Every community above is evaluated across six weighted categories using public data including state inspection records, review platforms, BBB profiles, and operator-published materials.
Weighting overview
- 35%Resident Experience
- 25%Regulatory
- 15%Visual Media
- 10%Website
- 10%Stability
- 5%Environment
01
Resident & Family Experience 35%
The single largest share of every ranking. Aggregated review sentiment and volume from major platforms — the closest signal to real resident experience.
- Includes
- Review Sentiment
- Review Volume
02
Regulatory & Safety Record 25%
State inspection records, citations, and complaint visits. We weight per-inspection rates more heavily than raw counts.
- Includes
- State Inspections
- Citations/Inspection
- % Inspections w/ Citations
- Complaint Visits
- Accreditations
- BBB Rating
03
Visual Media & Transparency 15%
Communities that publish high-quality visuals give families a real preview. No photos or tours = a negative transparency signal.
- Includes
- Video Tours
- Virtual Walkthroughs
- Photo Quantity
- Photo Quality
04
Website & Operator Transparency 10%
Site quality and whether the operator publishes basic accountability information — staff names, contact details, ownership.
- Includes
- Website Content
- Mobile Usability
- Staff Info Available
- Owner Info Available
05
Community Stability 10%
Operational signals indicating whether a community is well-run and meeting demand.
- Includes
- Occupancy Rate
- Bed Options
06
Environment & Pricing 5%
Walkability and pricing transparency. Walk Score is weighted higher for Independent Living than for Memory Care, where most residents do not leave unaccompanied.
- Includes
- Walk Score
- Pricing Transparency
Who we are
Your Senior Care Partner, Every Step of the Way
We help families find affordable senior communities and unlock same day discounts, Medicaid, and Medicare options tailored to your needs.
Contact us Today
Frequently Asked Questions about Memory Care in Maryland
What's the difference between assisted living and memory care in Maryland?
Assisted living in Maryland supports residents with daily activities (bathing, dressing, medication management) while preserving independence. Memory care is a specialized form of assisted living for residents living with Alzheimer's or dementia, and adds 24/7 secured environments, dementia-trained staff, and structured routines designed to reduce confusion and wandering.
Does Maryland Medicaid cover memory care?
Maryland Medicaid does not directly pay room-and-board for memory care, but most states (including Maryland) offer Home and Community-Based Services (HCBS) waivers that can offset the cost of care services delivered inside a licensed community. Eligibility, waitlists, and covered services vary — check directly with the state Medicaid agency.
What is memory care?
Memory care is a specialized form of assisted living for residents living with Alzheimer's disease or other forms of dementia, with secured environments, dementia-trained staff, and routines built to reduce confusion and wandering.
How many memory care communities are listed on this page?
This page features 327 memory care communities in Maryland. Use the filters and comparison tools above to compare ratings, amenities, and pricing.
How do I choose the right memory care community in Maryland?
Start by matching the level of care offered to the resident's current and anticipated needs, then compare licensing status, staff-to-resident ratios, recent inspection results, and pricing. Tour at least two or three communities in Maryland, talk to current residents and families, and confirm what is included in the base rate versus billed as add-on services.
What should I look for when visiting memory care communities in Maryland?
Pay attention to staff interactions with residents, cleanliness and odor, food quality at meal times, the activity calendar, and how questions about pricing and care plans are answered. Ask to see the most recent state inspection report, the move-out / level-of-care-change policy, and a sample monthly bill that lists every fee.
Updated on
