


Where in Maryland are you looking?
Browse communities by city.
AberdeenAccokeekAdelphiAnnapolisAnne Arundel CountyBaltimoreBeltsvilleBethesdaBowieCambridgeCatonsvilleChevy ChaseClintonColumbiaCoral HillsEastonElktonEllicott CityForest HillFort WashingtonFrederickGaithersburgGermantownGlen BurnieHagerstownHarford CountyHoward CountyHyattsvilleMarlboroMontgomery CountyOdentonPikesvillePotomacPrince George's CountyQueenstownRockvilleSalisburySandy SpringSeverna ParkSilver SpringTemple HillsTowsonWaldorfWashington County
Compare Assisted Living around Maryland
The information below is reported by the Maryland Department of Health, Office of Health Care Quality.
| Sunrise of Silver Spring | AL HC MC RC | Silver Spring (New Hampshire Avenue) | 84
Facility
84
MD AVG
43
Rank
#170 / 697 | Yes |
40
Facility
40
MD AVG
43
Rank
#523 / 985 | Studio / 1 Bed / 2 Bed | 24
Facility
24
MD AVG
21
Rank
#92 / 208 | - |
31% Male Residents — State Benchmarked 31% of residents are male, compared to the Maryland average of 31%. This facility caters to a majority female resident pool (69% female), consistent with the broader assisted living trend where women significantly outnumber men. |
69% Female Residents — State Benchmarked 69% of residents are female, compared to the Maryland average of 69%. Women comprise the large majority, consistent with national assisted living demographics where women live longer and enter care facilities at higher rates. |
53% White Residents — State Benchmarked 53% of residents are reported as White, compared to the Maryland average of 81%. A lower White share than the Maryland average — the community may draw a more diverse resident mix relative to other facilities in Maryland. |
39% African American Residents — State Benchmarked 39% of residents are reported as African American or Black, compared to the Maryland average of 13%. A higher African American share than the typical Maryland average — useful context when comparing cultural fit and community composition. |
9% Other Ethnicity Residents — State Benchmarked 9% of residents fall into categories other than White or African American (combined), compared to the Maryland average of 6%. This column aggregates Hispanic, Asian, multiracial, and any other labeled groups that are not classified as White or African American. Reported subgroups in this total: Asian (4%), Hawaiian/Pacific Islander (3%), Hispanic (1%). |
4% Residents Age 65–74 — State Benchmarked 4% of residents are 65–74, compared to the Maryland average of 13%. Fewer younger seniors suggests the resident population skews older, likely requiring higher acuity care and more hands-on support. |
43% Residents Age 75–84 — State Benchmarked 43% of residents are 75–84, compared to the Maryland average of 31%. A high concentration in this mid-range bracket, where residents typically need moderate support with daily activities. |
37% Residents Age 85–94 — State Benchmarked 37% of residents are 85–94, compared to the Maryland average of 44%. The population here skews younger than the statewide norm, which may indicate a more active, lower-acuity community. |
14% Residents Age 95+ — State Benchmarked 14% of residents are 95 or older, compared to the Maryland average of 16%. In line with the statewide profile for the oldest resident bracket. |
| Brightview Annapolis | AL IL MC | Annapolis | 85
Facility
85
MD AVG
43
Rank
#168 / 697 | Yes |
34
Facility
34
MD AVG
43
Rank
#590 / 985 | Studio / 1 Bed / 2 Bed | 8
Facility
8
MD AVG
21
Rank
#162 / 208 | - |
27% Male Residents — State Benchmarked 27% of residents are male, compared to the Maryland average of 31%. This facility caters to a majority female resident pool (73% female), consistent with the broader assisted living trend where women significantly outnumber men. |
73% Female Residents — State Benchmarked 73% of residents are female, compared to the Maryland average of 69%. Women comprise the large majority, consistent with national assisted living demographics where women live longer and enter care facilities at higher rates. |
97% White Residents — State Benchmarked 97% of residents are reported as White, compared to the Maryland average of 81%. A higher White share than is typical for assisted living in Maryland in this dataset — compare with peer facilities for local context. |
0% African American Residents — State Benchmarked 0% of residents are reported as African American or Black, compared to the Maryland average of 13%. A lower African American share than is typical in Maryland; local markets still vary widely. |
3% Other Ethnicity Residents — State Benchmarked 3% of residents fall into categories other than White or African American (combined), compared to the Maryland average of 6%. This column aggregates Hispanic, Asian, multiracial, and any other labeled groups that are not classified as White or African American. Reported subgroups in this total: Hispanic (3%). |
3% Residents Age 65–74 — State Benchmarked 3% of residents are 65–74, compared to the Maryland average of 13%. Fewer younger seniors suggests the resident population skews older, likely requiring higher acuity care and more hands-on support. |
27% Residents Age 75–84 — State Benchmarked 27% of residents are 75–84, compared to the Maryland average of 31%. This is the second most common age bracket in assisted living, representing residents with moderate care needs. |
59% Residents Age 85–94 — State Benchmarked 59% of residents are 85–94, compared to the Maryland average of 44%. A high concentration of very elderly residents signals a higher-acuity facility with experience caring for advanced age-related needs. |
9% Residents Age 95+ — State Benchmarked 9% of residents are 95 or older, compared to the Maryland average of 16%. Most residents here have not yet reached the oldest-old bracket, suggesting a younger overall community. |
| Modena Reserve at Kensington | AL IL MC | Kensington (Metropolitan Avenue) | 80
Facility
80
MD AVG
43
Rank
#176 / 697 | No |
85
Facility
85
MD AVG
43
Rank
#54 / 985 | - | 4
Facility
4
MD AVG
21
Rank
#191 / 208 | - | - | - | - | - | - | - | - | - | - |
| Bay Village of Annapolis | AL NH | Annapolis | 88
Facility
88
MD AVG
43
Rank
#162 / 697 | Yes |
75
Facility
75
MD AVG
43
Rank
#131 / 985 | Studio / 1 Bed | 5
Facility
5
MD AVG
21
Rank
#182 / 208 | - |
32% Male Residents — State Benchmarked 32% of residents are male, compared to the Maryland average of 31%. This facility caters to a majority female resident pool (68% female), consistent with the broader assisted living trend where women significantly outnumber men. |
68% Female Residents — State Benchmarked 68% of residents are female, compared to the Maryland average of 69%. Women comprise the large majority, consistent with national assisted living demographics where women live longer and enter care facilities at higher rates. |
99% White Residents — State Benchmarked 99% of residents are reported as White, compared to the Maryland average of 81%. A higher White share than is typical for assisted living in Maryland in this dataset — compare with peer facilities for local context. |
0% African American Residents — State Benchmarked 0% of residents are reported as African American or Black, compared to the Maryland average of 13%. A lower African American share than is typical in Maryland; local markets still vary widely. |
1% Other Ethnicity Residents — State Benchmarked 1% of residents fall into categories other than White or African American (combined), compared to the Maryland average of 6%. This column aggregates Hispanic, Asian, multiracial, and any other labeled groups that are not classified as White or African American. Reported subgroups in this total: Hispanic (1%). |
14% Residents Age 65–74 — State Benchmarked 14% of residents are 65–74, compared to the Maryland average of 13%. In line with the statewide profile for this youngest senior bracket in assisted living. |
28% Residents Age 75–84 — State Benchmarked 28% of residents are 75–84, compared to the Maryland average of 31%. This is the second most common age bracket in assisted living, representing residents with moderate care needs. |
50% Residents Age 85–94 — State Benchmarked 50% of residents are 85–94, compared to the Maryland average of 44%. A high concentration of very elderly residents signals a higher-acuity facility with experience caring for advanced age-related needs. |
8% Residents Age 95+ — State Benchmarked 8% of residents are 95 or older, compared to the Maryland average of 16%. Most residents here have not yet reached the oldest-old bracket, suggesting a younger overall community. |
| Brightview Rolling Hills | AL MC | Catonsville (College Hills) | 81
Facility
81
MD AVG
43
Rank
#174 / 697 | Yes |
19
Facility
19
MD AVG
43
Rank
#746 / 985 | Studio / 1 Bed /2 Bed | 8
Facility
8
MD AVG
21
Rank
#162 / 208 | - |
16% Male Residents — State Benchmarked 16% of residents are male, compared to the Maryland average of 31%. This facility caters to a majority female resident pool (84% female), consistent with the broader assisted living trend where women significantly outnumber men. |
84% Female Residents — State Benchmarked 84% of residents are female, compared to the Maryland average of 69%. Women comprise the large majority, consistent with national assisted living demographics where women live longer and enter care facilities at higher rates. |
95% White Residents — State Benchmarked 95% of residents are reported as White, compared to the Maryland average of 81%. A higher White share than is typical for assisted living in Maryland in this dataset — compare with peer facilities for local context. |
3% African American Residents — State Benchmarked 3% of residents are reported as African American or Black, compared to the Maryland average of 13%. A lower African American share than is typical in Maryland; local markets still vary widely. |
2% Other Ethnicity Residents — State Benchmarked 2% of residents fall into categories other than White or African American (combined), compared to the Maryland average of 6%. This column aggregates Hispanic, Asian, multiracial, and any other labeled groups that are not classified as White or African American. Reported subgroups in this total: Asian (2%). | - |
8% Residents Age 75–84 — State Benchmarked 8% of residents are 75–84, compared to the Maryland average of 31%. Below the state norm — the resident mix may skew either younger or older than this typical middle bracket. |
83% Residents Age 85–94 — State Benchmarked 83% of residents are 85–94, compared to the Maryland average of 44%. A high concentration of very elderly residents signals a higher-acuity facility with experience caring for advanced age-related needs. |
10% Residents Age 95+ — State Benchmarked 10% of residents are 95 or older, compared to the Maryland average of 16%. Most residents here have not yet reached the oldest-old bracket, suggesting a younger overall community. |
| Brightview Mays Chapel Ridge | AL IL MC | Timonium (Dixon Hill) | 89
Facility
89
MD AVG
43
Rank
#160 / 697 | No |
52
Facility
52
MD AVG
43
Rank
#402 / 985 | Studio / 1 Bed / 2 Bed | 50
Facility
50
MD AVG
21
Rank
#1 / 208 | A+ |
13% Male Residents — State Benchmarked 13% of residents are male, compared to the Maryland average of 31%. This facility caters to a majority female resident pool (87% female), consistent with the broader assisted living trend where women significantly outnumber men. |
87% Female Residents — State Benchmarked 87% of residents are female, compared to the Maryland average of 69%. Women comprise the large majority, consistent with national assisted living demographics where women live longer and enter care facilities at higher rates. |
99% White Residents — State Benchmarked 99% of residents are reported as White, compared to the Maryland average of 81%. A higher White share than is typical for assisted living in Maryland in this dataset — compare with peer facilities for local context. |
0% African American Residents — State Benchmarked 0% of residents are reported as African American or Black, compared to the Maryland average of 13%. A lower African American share than is typical in Maryland; local markets still vary widely. |
1% Other Ethnicity Residents — State Benchmarked 1% of residents fall into categories other than White or African American (combined), compared to the Maryland average of 6%. This column aggregates Hispanic, Asian, multiracial, and any other labeled groups that are not classified as White or African American. Reported subgroups in this total: Asian (1%). |
3% Residents Age 65–74 — State Benchmarked 3% of residents are 65–74, compared to the Maryland average of 13%. Fewer younger seniors suggests the resident population skews older, likely requiring higher acuity care and more hands-on support. |
30% Residents Age 75–84 — State Benchmarked 30% of residents are 75–84, compared to the Maryland average of 31%. This is the second most common age bracket in assisted living, representing residents with moderate care needs. |
48% Residents Age 85–94 — State Benchmarked 48% of residents are 85–94, compared to the Maryland average of 44%. This is typically the most common age bracket in assisted living — this facility is in line with the statewide norm. |
18% Residents Age 95+ — State Benchmarked 18% of residents are 95 or older, compared to the Maryland average of 16%. In line with the statewide profile for the oldest resident bracket. |
| Brightview Crofton Riverwalk | AL IL MC | Crofton | 92
Facility
92
MD AVG
43
Rank
#155 / 697 | Yes |
45
Facility
45
MD AVG
43
Rank
#475 / 985 | Studio / 1 Bed / 2 Bed | 6
Facility
6
MD AVG
21
Rank
#176 / 208 | - |
27% Male Residents — State Benchmarked 27% of residents are male, compared to the Maryland average of 31%. This facility caters to a majority female resident pool (73% female), consistent with the broader assisted living trend where women significantly outnumber men. |
73% Female Residents — State Benchmarked 73% of residents are female, compared to the Maryland average of 69%. Women comprise the large majority, consistent with national assisted living demographics where women live longer and enter care facilities at higher rates. |
0% White Residents — State Benchmarked 0% of residents are reported as White, compared to the Maryland average of 81%. A lower White share than the Maryland average — the community may draw a more diverse resident mix relative to other facilities in Maryland. |
0% African American Residents — State Benchmarked 0% of residents are reported as African American or Black, compared to the Maryland average of 13%. A lower African American share than is typical in Maryland; local markets still vary widely. |
100% Other Ethnicity Residents — State Benchmarked 100% of residents fall into categories other than White or African American (combined), compared to the Maryland average of 6%. This column aggregates Hispanic, Asian, multiracial, and any other labeled groups that are not classified as White or African American. Reported subgroups in this total: Other (100%). | - | - | - | - |
| Sunrise of Frederick | AL MC | Frederick (Waterford) | 88
Facility
88
MD AVG
43
Rank
#162 / 697 | Yes |
62
Facility
62
MD AVG
43
Rank
#286 / 985 | Studio / Suite / 2 Bed | 45
Facility
45
MD AVG
21
Rank
#4 / 208 | A- |
31% Male Residents — State Benchmarked 31% of residents are male, compared to the Maryland average of 31%. This facility caters to a majority female resident pool (69% female), consistent with the broader assisted living trend where women significantly outnumber men. |
69% Female Residents — State Benchmarked 69% of residents are female, compared to the Maryland average of 69%. Women comprise the large majority, consistent with national assisted living demographics where women live longer and enter care facilities at higher rates. |
97% White Residents — State Benchmarked 97% of residents are reported as White, compared to the Maryland average of 81%. A higher White share than is typical for assisted living in Maryland in this dataset — compare with peer facilities for local context. |
2% African American Residents — State Benchmarked 2% of residents are reported as African American or Black, compared to the Maryland average of 13%. A lower African American share than is typical in Maryland; local markets still vary widely. |
2% Other Ethnicity Residents — State Benchmarked 2% of residents fall into categories other than White or African American (combined), compared to the Maryland average of 6%. This column aggregates Hispanic, Asian, multiracial, and any other labeled groups that are not classified as White or African American. Reported subgroups in this total: Hispanic (2%). |
10% Residents Age 65–74 — State Benchmarked 10% of residents are 65–74, compared to the Maryland average of 13%. Fewer younger seniors suggests the resident population skews older, likely requiring higher acuity care and more hands-on support. |
34% Residents Age 75–84 — State Benchmarked 34% of residents are 75–84, compared to the Maryland average of 31%. This is the second most common age bracket in assisted living, representing residents with moderate care needs. |
48% Residents Age 85–94 — State Benchmarked 48% of residents are 85–94, compared to the Maryland average of 44%. This is typically the most common age bracket in assisted living — this facility is in line with the statewide norm. |
6% Residents Age 95+ — State Benchmarked 6% of residents are 95 or older, compared to the Maryland average of 16%. Most residents here have not yet reached the oldest-old bracket, suggesting a younger overall community. |
| Sunrise of Rockville | AL | Rockville (Baltimore Road) | 89
Facility
89
MD AVG
43
Rank
#160 / 697 | Yes |
89
Facility
89
MD AVG
43
Rank
#32 / 985 | Studio / 1 Bed / 2 Bed | 45
Facility
45
MD AVG
21
Rank
#4 / 208 | A- |
23% Male Residents — State Benchmarked 23% of residents are male, compared to the Maryland average of 31%. This facility caters to a majority female resident pool (77% female), consistent with the broader assisted living trend where women significantly outnumber men. |
77% Female Residents — State Benchmarked 77% of residents are female, compared to the Maryland average of 69%. Women comprise the large majority, consistent with national assisted living demographics where women live longer and enter care facilities at higher rates. |
87% White Residents — State Benchmarked 87% of residents are reported as White, compared to the Maryland average of 81%. Close to the average for this category among assisted living facilities in Maryland with reported race/ethnicity data. |
2% African American Residents — State Benchmarked 2% of residents are reported as African American or Black, compared to the Maryland average of 13%. A lower African American share than is typical in Maryland; local markets still vary widely. |
11% Other Ethnicity Residents — State Benchmarked 11% of residents fall into categories other than White or African American (combined), compared to the Maryland average of 6%. This column aggregates Hispanic, Asian, multiracial, and any other labeled groups that are not classified as White or African American. Reported subgroups in this total: Mixed Race (6%), Hispanic (3%), Asian (2%). |
3% Residents Age 65–74 — State Benchmarked 3% of residents are 65–74, compared to the Maryland average of 13%. Fewer younger seniors suggests the resident population skews older, likely requiring higher acuity care and more hands-on support. |
31% Residents Age 75–84 — State Benchmarked 31% of residents are 75–84, compared to the Maryland average of 31%. This is the second most common age bracket in assisted living, representing residents with moderate care needs. |
56% Residents Age 85–94 — State Benchmarked 56% of residents are 85–94, compared to the Maryland average of 44%. A high concentration of very elderly residents signals a higher-acuity facility with experience caring for advanced age-related needs. |
10% Residents Age 95+ — State Benchmarked 10% of residents are 95 or older, compared to the Maryland average of 16%. Most residents here have not yet reached the oldest-old bracket, suggesting a younger overall community. |
| Arbor Terrace at Waugh Chapel | AL MC | Gambrills (Waugh Chapel Towne Centre) | 96
Facility
96
MD AVG
43
Rank
#140 / 697 | No |
47
Facility
47
MD AVG
43
Rank
#459 / 985 | - | 4
Facility
4
MD AVG
21
Rank
#191 / 208 | A+ |
30% Male Residents — State Benchmarked 30% of residents are male, compared to the Maryland average of 31%. This facility caters to a majority female resident pool (70% female), consistent with the broader assisted living trend where women significantly outnumber men. |
70% Female Residents — State Benchmarked 70% of residents are female, compared to the Maryland average of 69%. Women comprise the large majority, consistent with national assisted living demographics where women live longer and enter care facilities at higher rates. |
86% White Residents — State Benchmarked 86% of residents are reported as White, compared to the Maryland average of 81%. Close to the average for this category among assisted living facilities in Maryland with reported race/ethnicity data. |
12% African American Residents — State Benchmarked 12% of residents are reported as African American or Black, compared to the Maryland average of 13%. In line with the Maryland average for African American residents among facilities reporting this breakdown. |
3% Other Ethnicity Residents — State Benchmarked 3% of residents fall into categories other than White or African American (combined), compared to the Maryland average of 6%. This column aggregates Hispanic, Asian, multiracial, and any other labeled groups that are not classified as White or African American. Reported subgroups in this total: Asian (1%), Hawaiian/Pacific Islander (1%). |
10% Residents Age 65–74 — State Benchmarked 10% of residents are 65–74, compared to the Maryland average of 13%. Fewer younger seniors suggests the resident population skews older, likely requiring higher acuity care and more hands-on support. |
43% Residents Age 75–84 — State Benchmarked 43% of residents are 75–84, compared to the Maryland average of 31%. A high concentration in this mid-range bracket, where residents typically need moderate support with daily activities. |
39% Residents Age 85–94 — State Benchmarked 39% of residents are 85–94, compared to the Maryland average of 44%. This is typically the most common age bracket in assisted living — this facility is in line with the statewide norm. |
8% Residents Age 95+ — State Benchmarked 8% of residents are 95 or older, compared to the Maryland average of 16%. Most residents here have not yet reached the oldest-old bracket, suggesting a younger overall community. |
| Celebration Villa of Manresa | AL RC | Annapolis (Arnold) | 86
Facility
86
MD AVG
43
Rank
#167 / 697 | Yes |
2
Facility
2
MD AVG
43
Rank
#940 / 985 | Studio / 1 Bed | 3
Facility
3
MD AVG
21
Rank
#201 / 208 | - |
35% Male Residents — State Benchmarked 35% of residents are male, compared to the Maryland average of 31%. This facility caters to a majority female resident pool (65% female), consistent with the broader assisted living trend where women significantly outnumber men. |
65% Female Residents — State Benchmarked 65% of residents are female, compared to the Maryland average of 69%. Women comprise the large majority, consistent with national assisted living demographics where women live longer and enter care facilities at higher rates. |
97% White Residents — State Benchmarked 97% of residents are reported as White, compared to the Maryland average of 81%. A higher White share than is typical for assisted living in Maryland in this dataset — compare with peer facilities for local context. |
3% African American Residents — State Benchmarked 3% of residents are reported as African American or Black, compared to the Maryland average of 13%. A lower African American share than is typical in Maryland; local markets still vary widely. |
0% Other Ethnicity Residents — State Benchmarked 0% of residents fall into categories other than White or African American (combined), compared to the Maryland average of 6%. This column aggregates Hispanic, Asian, multiracial, and any other labeled groups that are not classified as White or African American. |
8% Residents Age 65–74 — State Benchmarked 8% of residents are 65–74, compared to the Maryland average of 13%. Fewer younger seniors suggests the resident population skews older, likely requiring higher acuity care and more hands-on support. |
52% Residents Age 75–84 — State Benchmarked 52% of residents are 75–84, compared to the Maryland average of 31%. A high concentration in this mid-range bracket, where residents typically need moderate support with daily activities. |
27% Residents Age 85–94 — State Benchmarked 27% of residents are 85–94, compared to the Maryland average of 44%. The population here skews younger than the statewide norm, which may indicate a more active, lower-acuity community. |
13% Residents Age 95+ — State Benchmarked 13% of residents are 95 or older, compared to the Maryland average of 16%. In line with the statewide profile for the oldest resident bracket. |
| Queenstown Landing | AL MC RC | Queenstown | 78
Facility
78
MD AVG
43
Rank
#181 / 697 | No |
10
Facility
10
MD AVG
43
Rank
#837 / 985 | - | 5
Facility
5
MD AVG
21
Rank
#182 / 208 | - |
35% Male Residents — State Benchmarked 35% of residents are male, compared to the Maryland average of 31%. This facility caters to a majority female resident pool (65% female), consistent with the broader assisted living trend where women significantly outnumber men. |
65% Female Residents — State Benchmarked 65% of residents are female, compared to the Maryland average of 69%. Women comprise the large majority, consistent with national assisted living demographics where women live longer and enter care facilities at higher rates. |
98% White Residents — State Benchmarked 98% of residents are reported as White, compared to the Maryland average of 81%. A higher White share than is typical for assisted living in Maryland in this dataset — compare with peer facilities for local context. |
2% African American Residents — State Benchmarked 2% of residents are reported as African American or Black, compared to the Maryland average of 13%. A lower African American share than is typical in Maryland; local markets still vary widely. |
0% Other Ethnicity Residents — State Benchmarked 0% of residents fall into categories other than White or African American (combined), compared to the Maryland average of 6%. This column aggregates Hispanic, Asian, multiracial, and any other labeled groups that are not classified as White or African American. | - |
5% Residents Age 75–84 — State Benchmarked 5% of residents are 75–84, compared to the Maryland average of 31%. Below the state norm — the resident mix may skew either younger or older than this typical middle bracket. |
88% Residents Age 85–94 — State Benchmarked 88% of residents are 85–94, compared to the Maryland average of 44%. A high concentration of very elderly residents signals a higher-acuity facility with experience caring for advanced age-related needs. |
7% Residents Age 95+ — State Benchmarked 7% of residents are 95 or older, compared to the Maryland average of 16%. Most residents here have not yet reached the oldest-old bracket, suggesting a younger overall community. |
| Arbor Terrace Waugh Chapel | AL MC | Gambrills (Waugh Chapel Towne Centre) | 96
Facility
96
MD AVG
43
Rank
#140 / 697 | Yes |
47
Facility
47
MD AVG
43
Rank
#459 / 985 | Studio / 1 Bed / 2 Bed | 4
Facility
4
MD AVG
21
Rank
#191 / 208 | A+ |
30% Male Residents — State Benchmarked 30% of residents are male, compared to the Maryland average of 31%. This facility caters to a majority female resident pool (70% female), consistent with the broader assisted living trend where women significantly outnumber men. |
70% Female Residents — State Benchmarked 70% of residents are female, compared to the Maryland average of 69%. Women comprise the large majority, consistent with national assisted living demographics where women live longer and enter care facilities at higher rates. |
86% White Residents — State Benchmarked 86% of residents are reported as White, compared to the Maryland average of 81%. Close to the average for this category among assisted living facilities in Maryland with reported race/ethnicity data. |
12% African American Residents — State Benchmarked 12% of residents are reported as African American or Black, compared to the Maryland average of 13%. In line with the Maryland average for African American residents among facilities reporting this breakdown. |
3% Other Ethnicity Residents — State Benchmarked 3% of residents fall into categories other than White or African American (combined), compared to the Maryland average of 6%. This column aggregates Hispanic, Asian, multiracial, and any other labeled groups that are not classified as White or African American. Reported subgroups in this total: Asian (1%), Hawaiian/Pacific Islander (1%). |
10% Residents Age 65–74 — State Benchmarked 10% of residents are 65–74, compared to the Maryland average of 13%. Fewer younger seniors suggests the resident population skews older, likely requiring higher acuity care and more hands-on support. |
43% Residents Age 75–84 — State Benchmarked 43% of residents are 75–84, compared to the Maryland average of 31%. A high concentration in this mid-range bracket, where residents typically need moderate support with daily activities. |
39% Residents Age 85–94 — State Benchmarked 39% of residents are 85–94, compared to the Maryland average of 44%. This is typically the most common age bracket in assisted living — this facility is in line with the statewide norm. |
8% Residents Age 95+ — State Benchmarked 8% of residents are 95 or older, compared to the Maryland average of 16%. Most residents here have not yet reached the oldest-old bracket, suggesting a younger overall community. |
| Brookdale Olney | AL MC | Olney (Olney Estates) | 94
Facility
94
MD AVG
43
Rank
#148 / 697 | Yes |
16
Facility
16
MD AVG
43
Rank
#772 / 985 | Studio / 1 Bed / 2 Bed | 13
Facility
13
MD AVG
21
Rank
#141 / 208 | - |
33% Male Residents — State Benchmarked 33% of residents are male, compared to the Maryland average of 31%. This facility caters to a majority female resident pool (67% female), consistent with the broader assisted living trend where women significantly outnumber men. |
67% Female Residents — State Benchmarked 67% of residents are female, compared to the Maryland average of 69%. Women comprise the large majority, consistent with national assisted living demographics where women live longer and enter care facilities at higher rates. |
94% White Residents — State Benchmarked 94% of residents are reported as White, compared to the Maryland average of 81%. A higher White share than is typical for assisted living in Maryland in this dataset — compare with peer facilities for local context. |
3% African American Residents — State Benchmarked 3% of residents are reported as African American or Black, compared to the Maryland average of 13%. A lower African American share than is typical in Maryland; local markets still vary widely. |
3% Other Ethnicity Residents — State Benchmarked 3% of residents fall into categories other than White or African American (combined), compared to the Maryland average of 6%. This column aggregates Hispanic, Asian, multiracial, and any other labeled groups that are not classified as White or African American. Reported subgroups in this total: Asian (3%). |
8% Residents Age 65–74 — State Benchmarked 8% of residents are 65–74, compared to the Maryland average of 13%. Fewer younger seniors suggests the resident population skews older, likely requiring higher acuity care and more hands-on support. |
39% Residents Age 75–84 — State Benchmarked 39% of residents are 75–84, compared to the Maryland average of 31%. A high concentration in this mid-range bracket, where residents typically need moderate support with daily activities. |
22% Residents Age 85–94 — State Benchmarked 22% of residents are 85–94, compared to the Maryland average of 44%. The population here skews younger than the statewide norm, which may indicate a more active, lower-acuity community. |
28% Residents Age 95+ — State Benchmarked 28% of residents are 95 or older, compared to the Maryland average of 16%. A high proportion of the oldest-old suggests strong end-of-life care experience and very-high-acuity capabilities. |
| Charter Senior Living of Towson | AL MC | Baltimore (The Orchards) | 92
Facility
92
MD AVG
43
Rank
#155 / 697 | No |
36
Facility
36
MD AVG
43
Rank
#563 / 985 | Studio / 1 Bed | 5
Facility
5
MD AVG
21
Rank
#182 / 208 | - |
25% Male Residents — State Benchmarked 25% of residents are male, compared to the Maryland average of 31%. This facility caters to a majority female resident pool (75% female), consistent with the broader assisted living trend where women significantly outnumber men. |
75% Female Residents — State Benchmarked 75% of residents are female, compared to the Maryland average of 69%. Women comprise the large majority, consistent with national assisted living demographics where women live longer and enter care facilities at higher rates. |
88% White Residents — State Benchmarked 88% of residents are reported as White, compared to the Maryland average of 81%. Close to the average for this category among assisted living facilities in Maryland with reported race/ethnicity data. |
7% African American Residents — State Benchmarked 7% of residents are reported as African American or Black, compared to the Maryland average of 13%. In line with the Maryland average for African American residents among facilities reporting this breakdown. |
4% Other Ethnicity Residents — State Benchmarked 4% of residents fall into categories other than White or African American (combined), compared to the Maryland average of 6%. This column aggregates Hispanic, Asian, multiracial, and any other labeled groups that are not classified as White or African American. Reported subgroups in this total: Asian (3%), Hispanic (1%). | - |
22% Residents Age 75–84 — State Benchmarked 22% of residents are 75–84, compared to the Maryland average of 31%. Below the state norm — the resident mix may skew either younger or older than this typical middle bracket. |
60% Residents Age 85–94 — State Benchmarked 60% of residents are 85–94, compared to the Maryland average of 44%. A high concentration of very elderly residents signals a higher-acuity facility with experience caring for advanced age-related needs. |
15% Residents Age 95+ — State Benchmarked 15% of residents are 95 or older, compared to the Maryland average of 16%. In line with the statewide profile for the oldest resident bracket. |
Rows per page:

View all Nearby Homes
Enjoy the best of your golden years with Visiting Angels, a dedicated community based in Eastern Shore, MD, offering home care services. This home care provider features comprehensive care options, including companion, personal, palliative, memory, hospice, and respite care. With a compassionate and well-trained team attending to their needs 24/7, older adults can ease their worries and live comfortably in the safety of their homes.
Through the veterans program, eligible veterans can receive the utmost care they deserve. The community also provides long-distance care for those whose families are away, establishing trusting relationships for better care and comfort. Striving to maintain independence, a fall prevention program is also conducted to assess and mitigate risks. Older adults have the finest retirement experience accompanied by the community’s dedicated care and exceptional services.
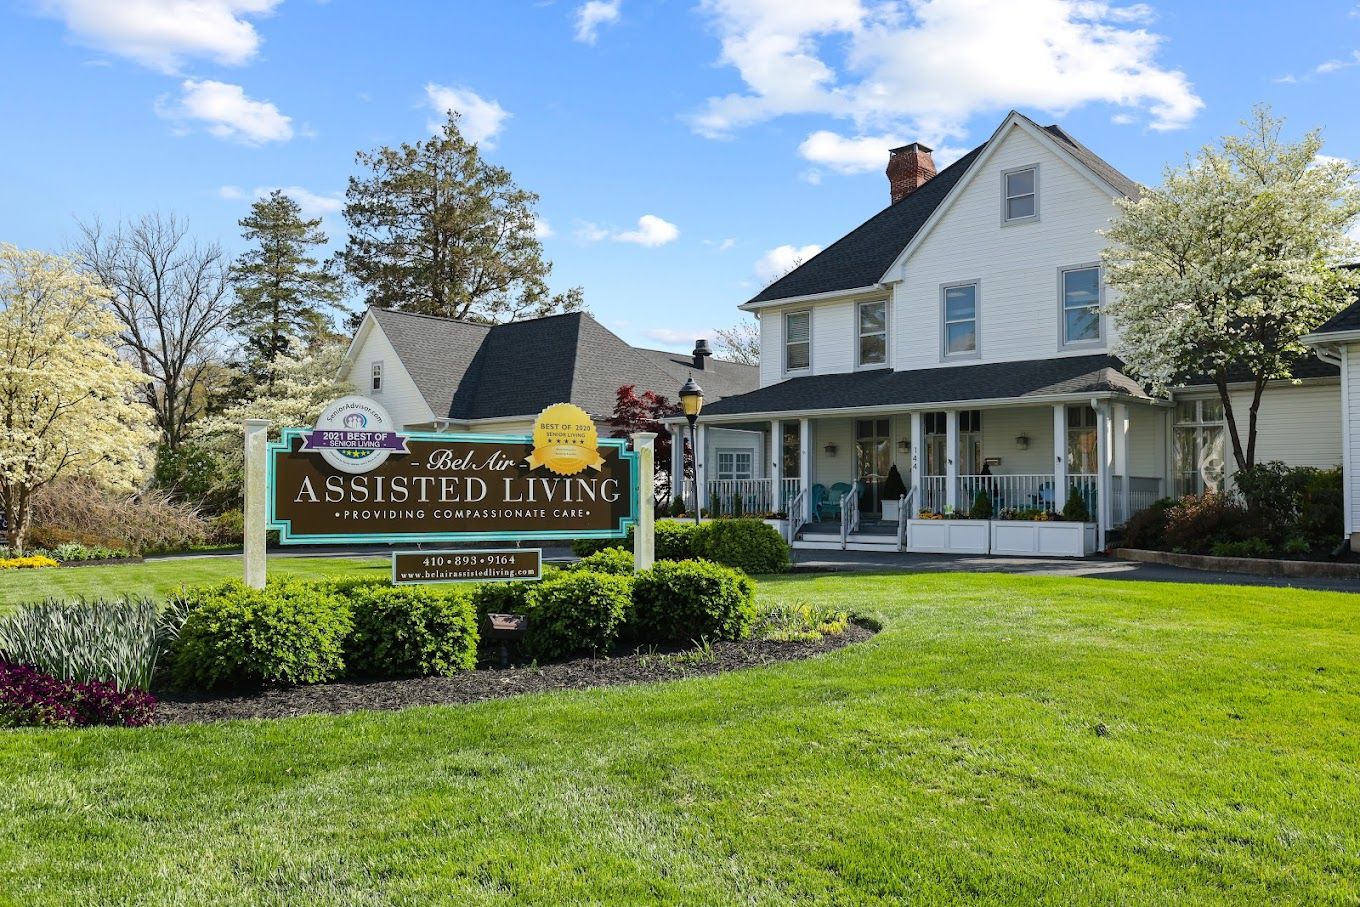
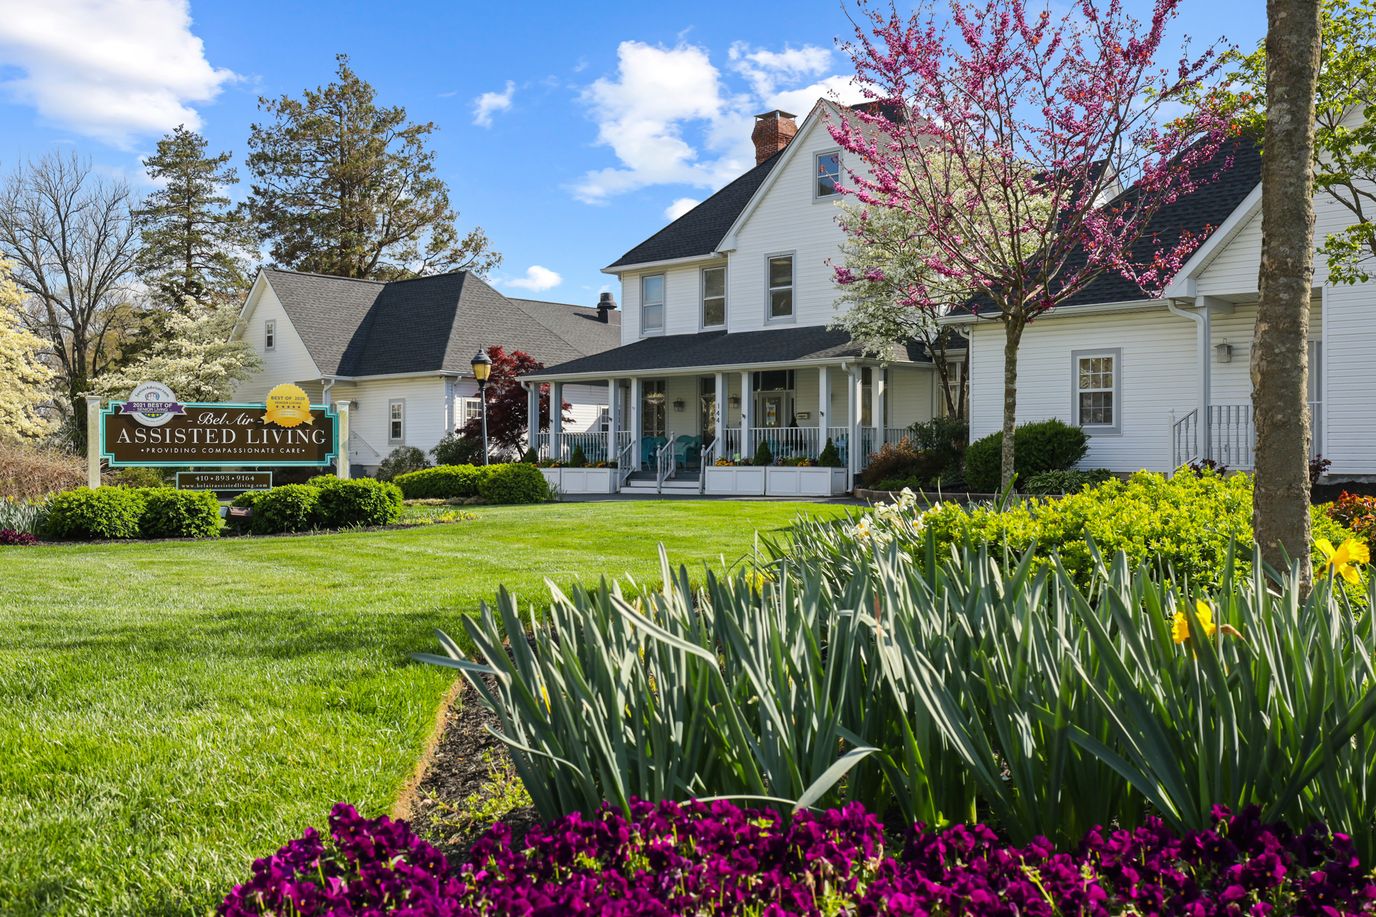
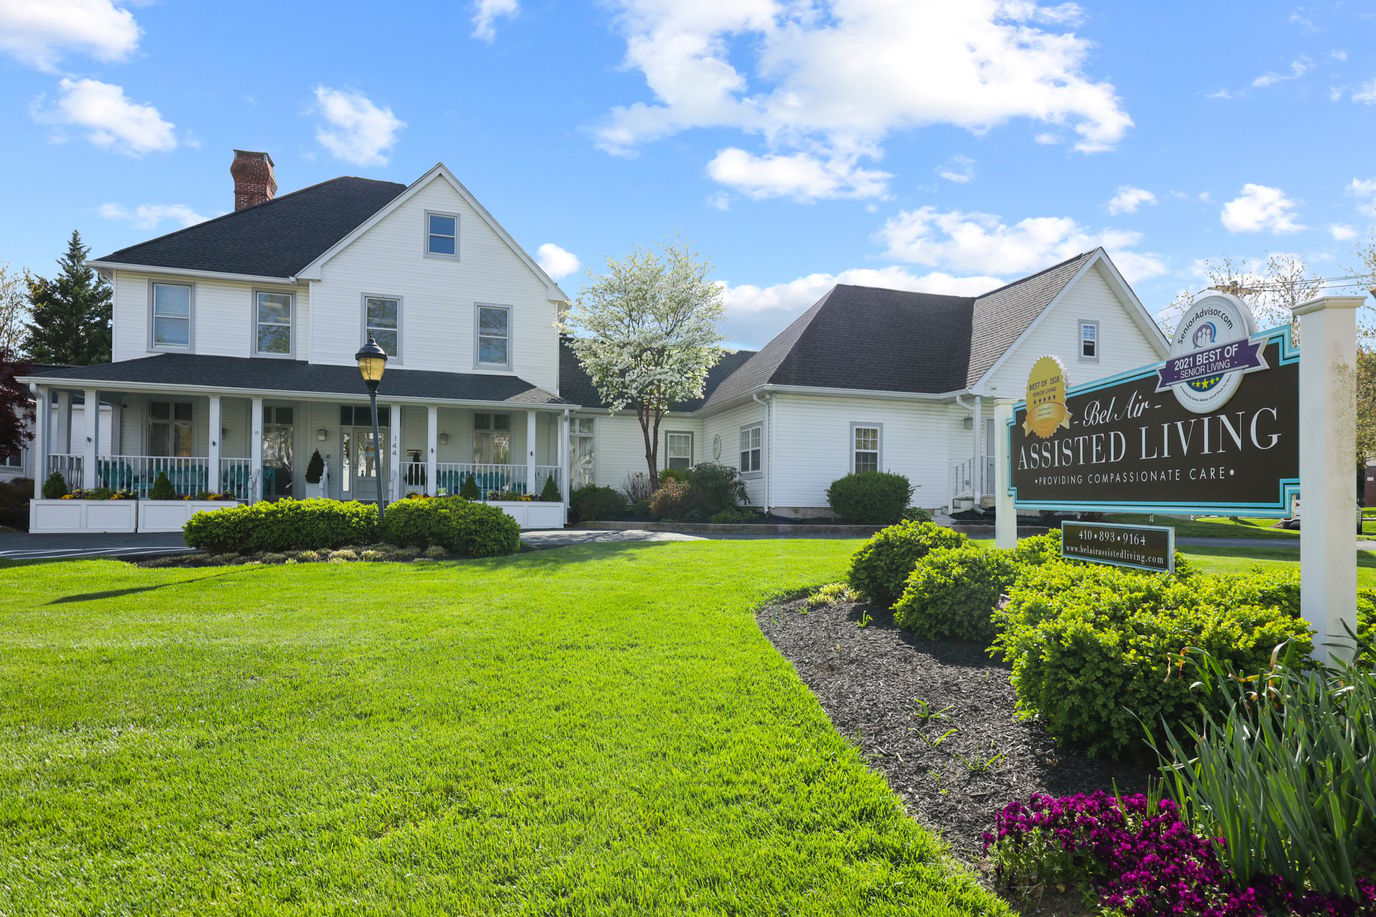
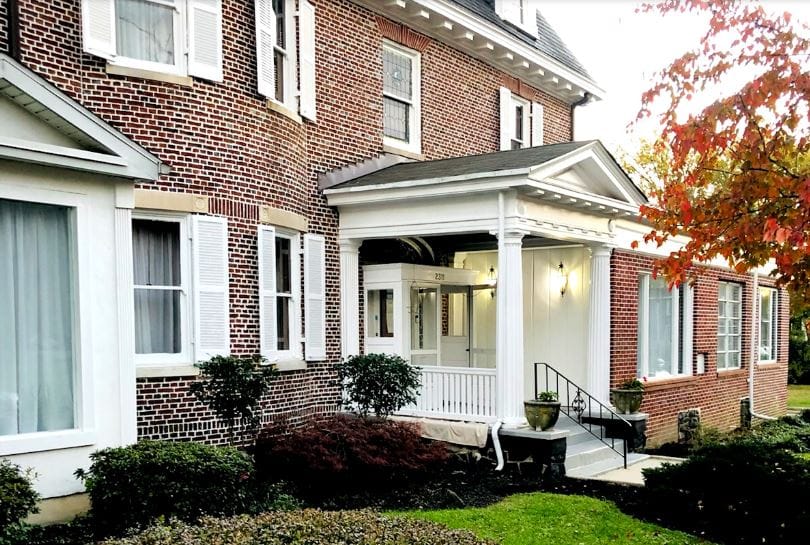
Overview of Bel Air Assisted Living | Senior Living & Memory Care


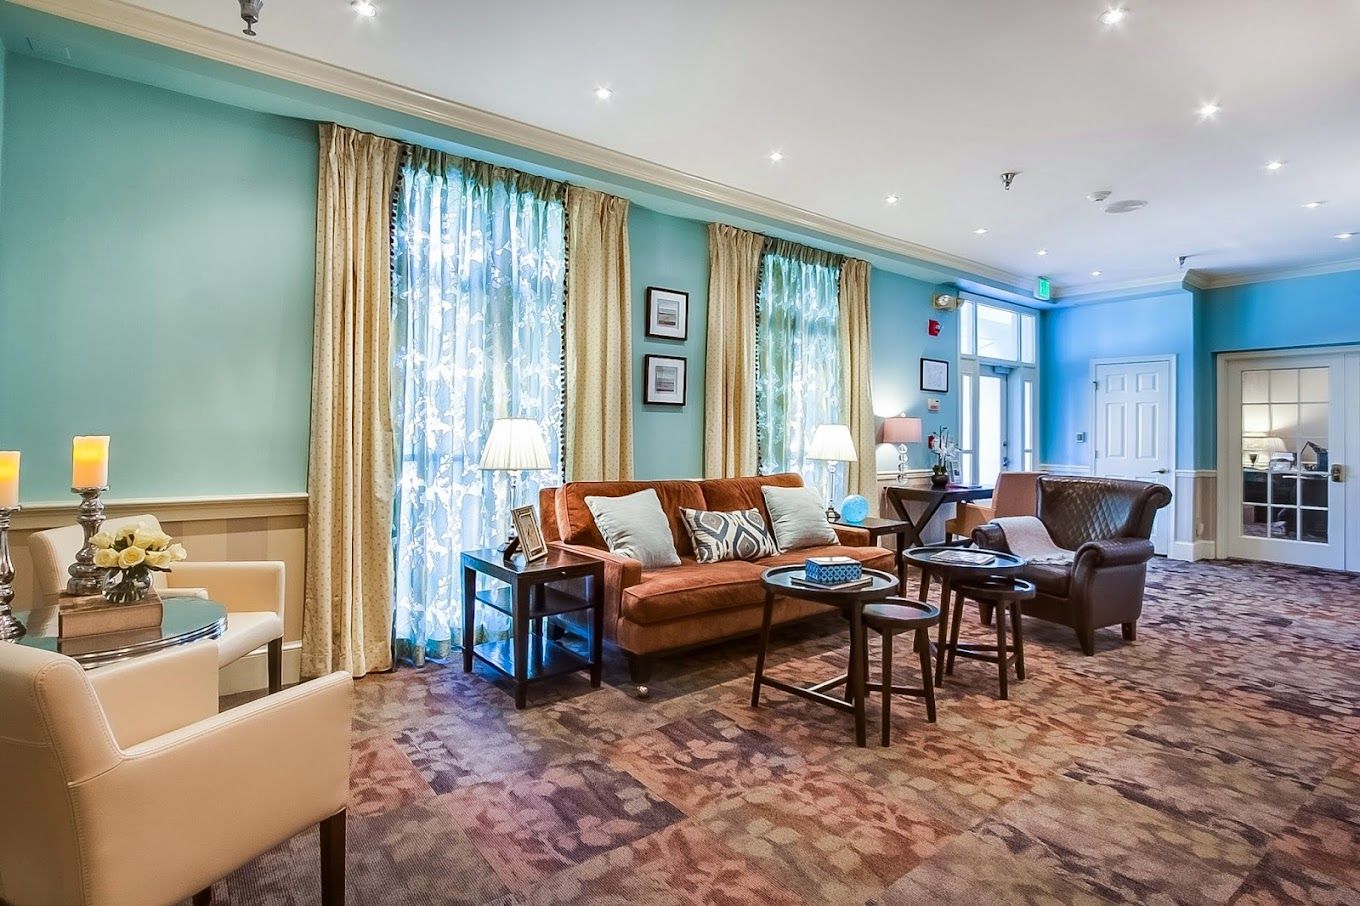
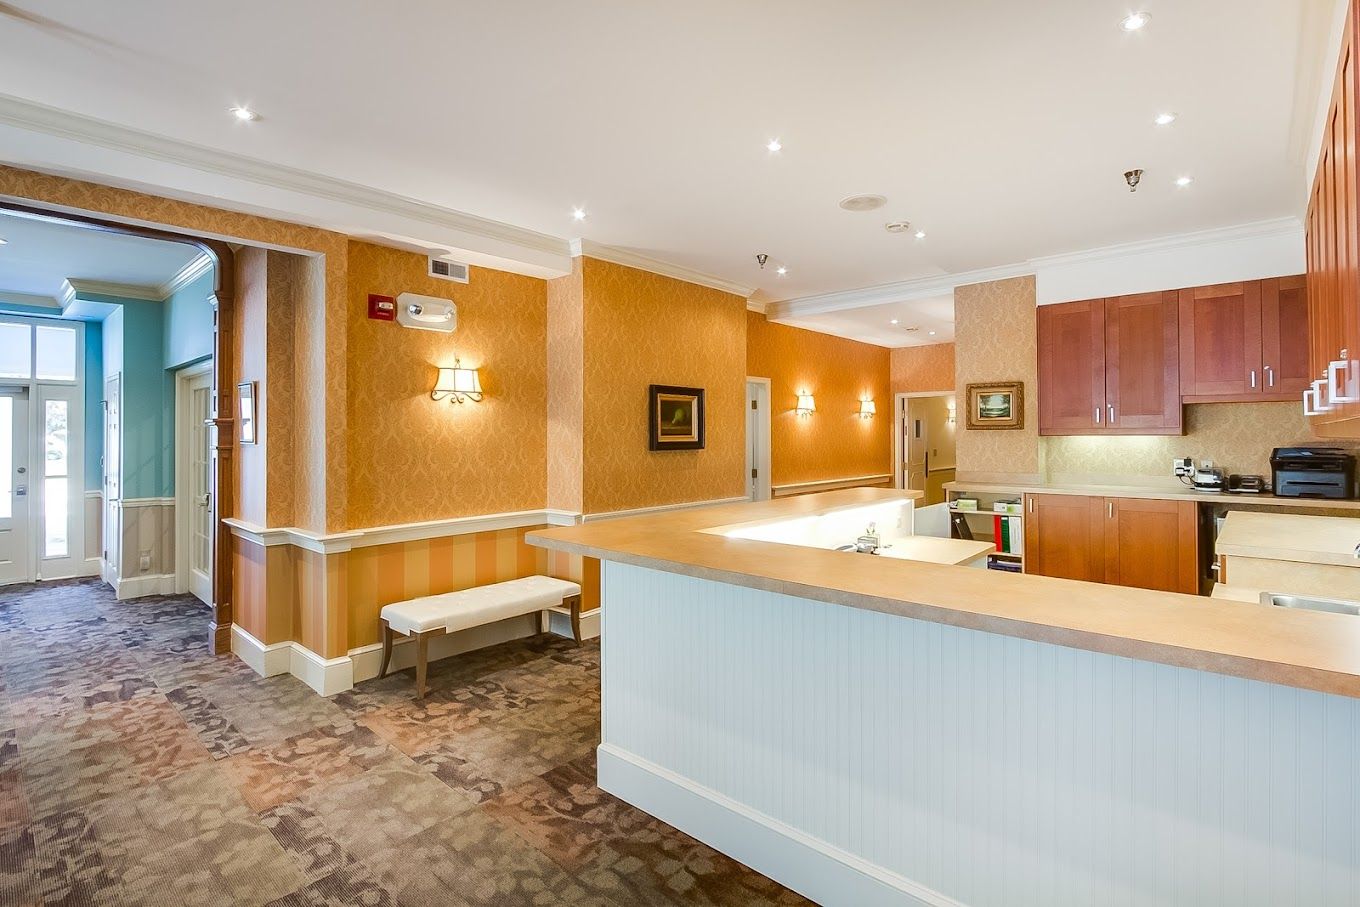
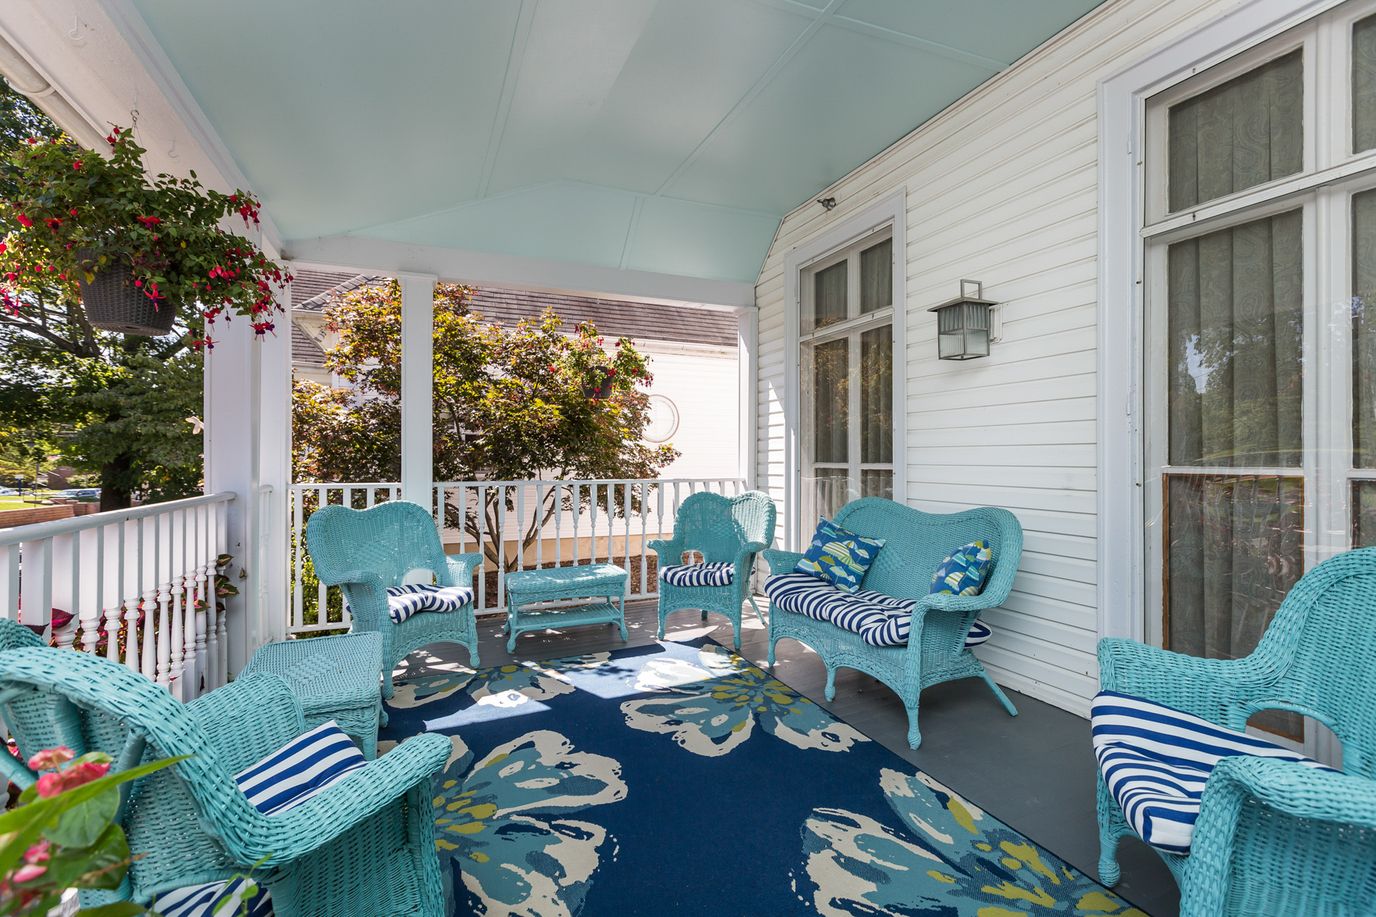
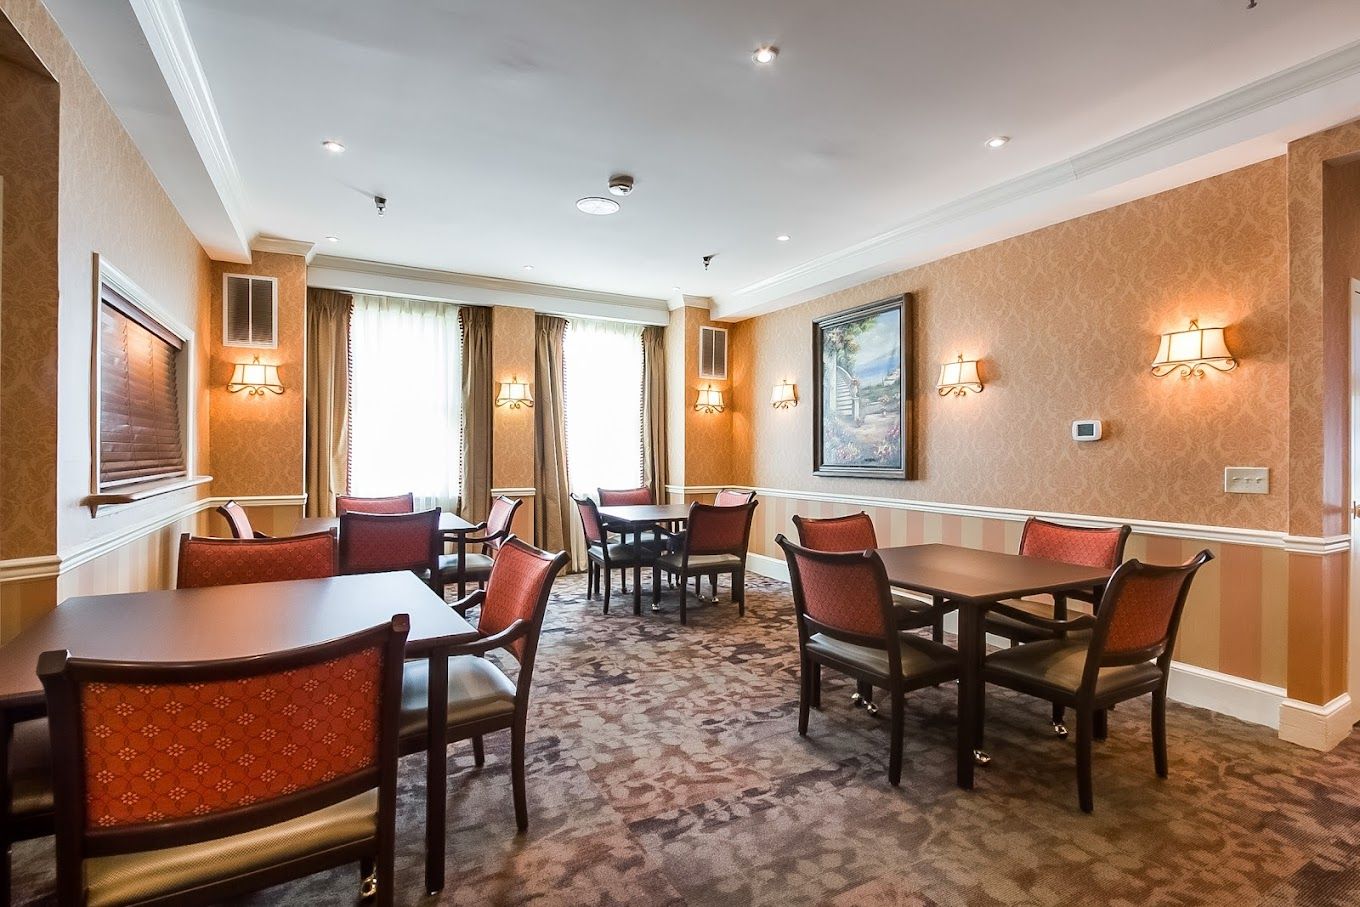
Dedicated to providing the highest quality of care, Bel Air Assisted Living in North Hickory Avenue, Bel Air, MD, is a respected senior living community offering assisted living, independent living, memory care, rehabilitation services, respite care, and hospice care. Seniors let go of their worries with a hardworking and specially trained team taking care of their daily living activities around the clock. The community also features accessible and senior-friendly accommodations and amenities to ensure a comfortable and convenient lifestyle.
Enrich retirement with stimulating activities and fun programs that are carefully curated to highlight residents’ interests and strengths. Have a delightful dining experience with healthy and delicious meals catering to nutritional needs and preferences. Bel Air Assisted Living is ideal for seniors looking to find all the care they need within one place with its comprehensive care and incredible amenities.
Overview of Sterling Care

Dedicated to improving seniors’ well-being, Sterling Care is a distinct senior living community offering assisted living, independent living, skilled nursing care, and rehabilitation across its convenient locations. The community strives to deliver top-notch care and assistance from a dedicated and highly skilled team. Enjoy your golden years doing what you love within the serene spaces of Sterling Care.
Sterling Care fosters a vibrant and welcoming environment, paving the way for residents to gain meaningful interactions and mingle with friends. Combining medical expertise and exceptional comfort, the community ensures seniors are well-cared for in every aspect of their well-being. Sterling Care is ideal for seniors aiming to spend their golden years doing what they love with its incredible amenities and peaceful setting.
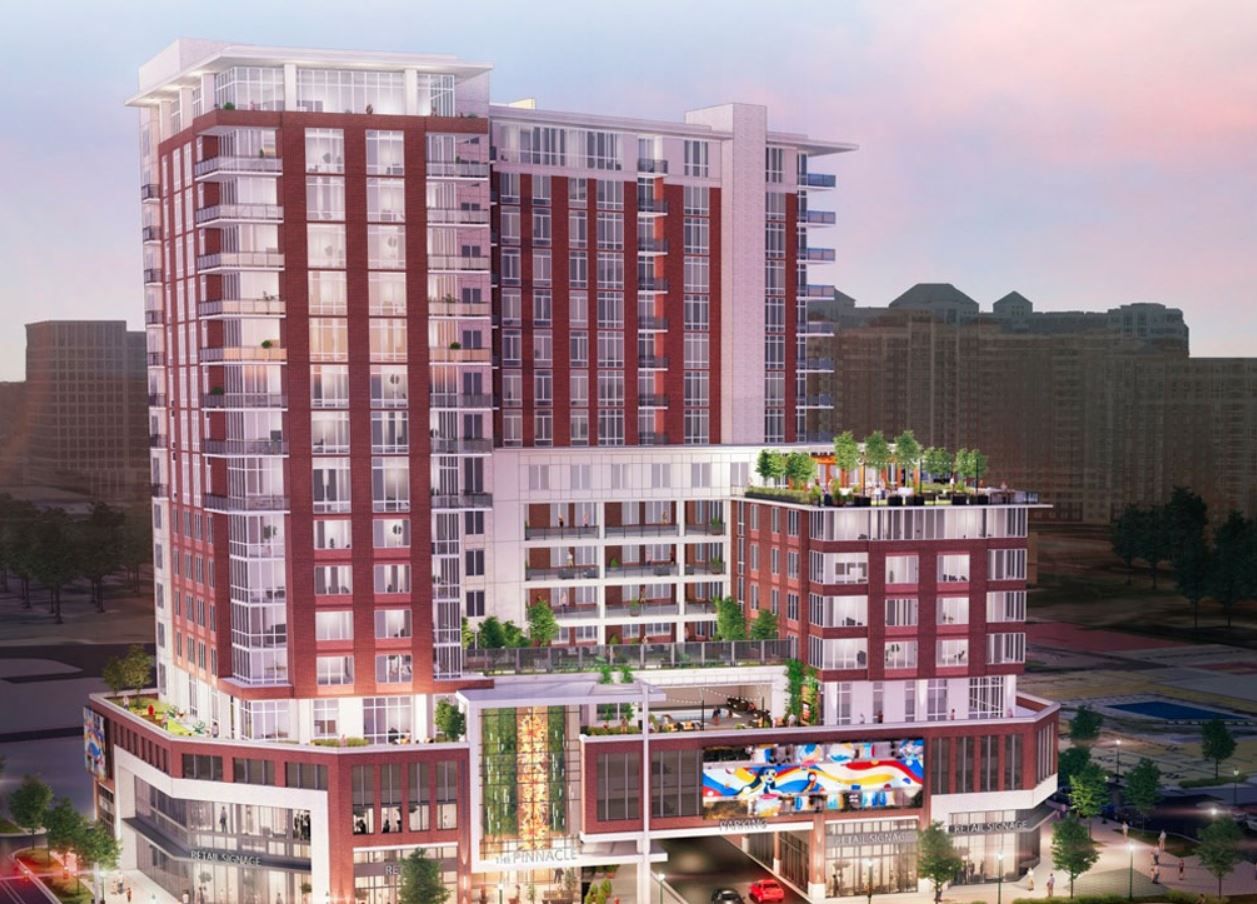
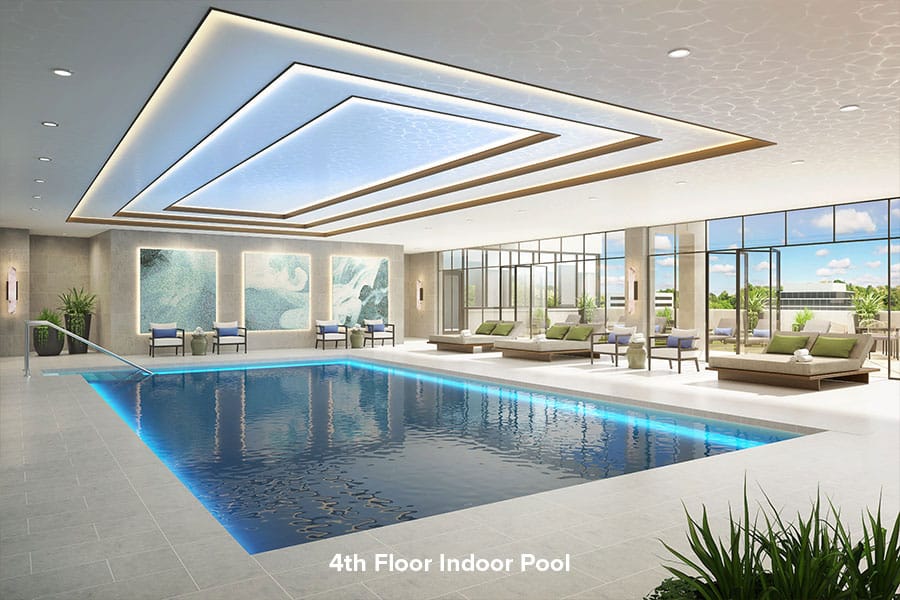
The Pinnacle is a luxurious retirement community in North Bethesda, MD, that offers independent living, assisted living, and memory care for those 62+. With its upscale and sophisticated setting, older adults experience the finest retirement during their stay. The community also provides high-quality services, including chef-prepared meals, 24/7 concierge services, and enrichment programs to enrich residents’ living experiences. Through a holistic approach to care, the community ensures residents receive the right care for their unique needs.
Educational programs, social events, and wellness activities are available for residents’ leisure and social interactions. A salon, a fitness center, and an indoor pool with an outdoor sun deck are just some of the state-of-the-art amenities that residents can use to make the most of their retirement. The area also ensures accessibility and convenience, especially with parks, dentists, bus stops, and other local shops nearby. This retirement community is a great choice for senior living in Maryland, as it has exceptional standards dedicated to older adults’ welfare.
Serenity Garden Manor is an assisted living and retirement home at 2311 Roslyn Avenue, Baltimore, Baltimore City County, Maryland 21216, in the Garwyn Oaks neighborhood. Operating for over 40 years, the facility is for-profit and Maryland Department of Health Office of Health Care Quality licensed (RCFE #30AL0850). 15 beds. Not CMS-certified for Medicare or Medicaid but accepts Medicaid.
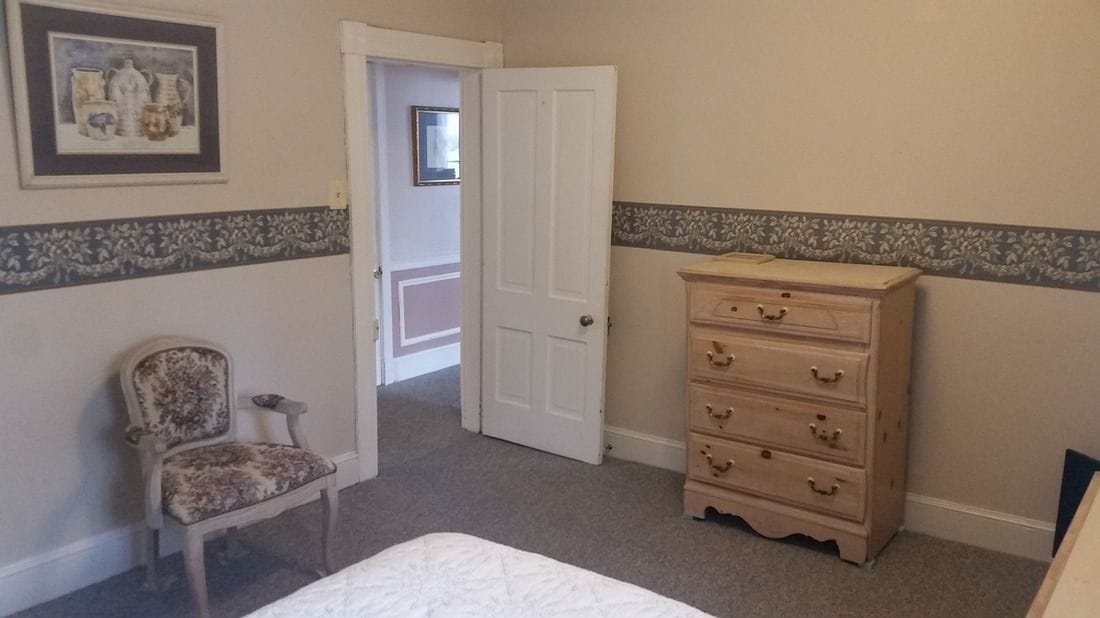
The 2-story facility offers assisted living with private and semi-private bedrooms. Services include 24-hour awake staffing, nursing services, medication dispensing, occupational therapy, physical therapy, portable oxygen care, laundry, transportation, and home health agency services. Alzheimer’s care is provided at mild and moderate levels (not severe). Regular medical check-ups and home-delivered medications are standard.
Amenities include spacious dining halls with home-style meals, comfortable lounge areas, and outdoor garden sitting areas. Activities are robust: monthly resident celebrations, annual summer picnics, bingo championships, crossword puzzle tournaments, music and singing, movie nights, off-site outings, and a senior-approved exercise program. Barber and hair services are arranged.
Located 5.3 miles from downtown Baltimore, Garwyn Oaks neighborhood. Walk Score 76 (very walkable). Most errands on foot. Grace Medical Center 2.37 miles away. The facility received an Influenza Gold Star Award from the Maryland Health Care Commission, reflecting high staff vaccination rates.
Current resident profile (snapshot): 67% male, 33% female; 33% ages 65-74, 22% ages 85-94, 44% age ≤64; 78% African American, 22% white. Population skews younger than Maryland statewide average, suggesting a more active, lower-acuity community. Semi-private room pricing: $83-$117 per day.
Financial assistance programs available to Maryland residents include Community Options Waiver, Senior Care Program, Maryland Nursing Home Medicaid, Senior Assisted Living Subsidy Program, Veterans Aid and Attendance, Senior Prescription Drug Assistance Program, Medicare Savings Programs, and Community Personal Assistance Services. Income limits vary; families should verify with a local Area Agency on Aging.
Regulatory data and inspection history with the Maryland Department of Health and Mental Hygiene are not publicly available for non-CMS-certified assisted living facilities.
Families should ask about Alzheimer’s and dementia care training, medication management, staffing ratios, occupancy, specialized services, hospice affiliations, and meal planning and dietary accommodations.
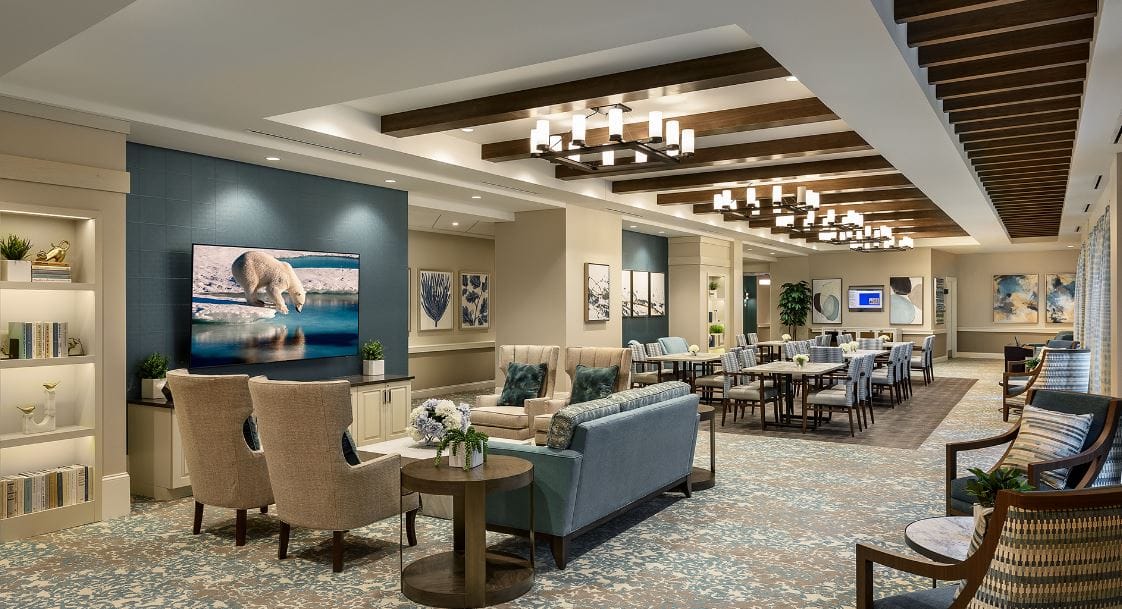
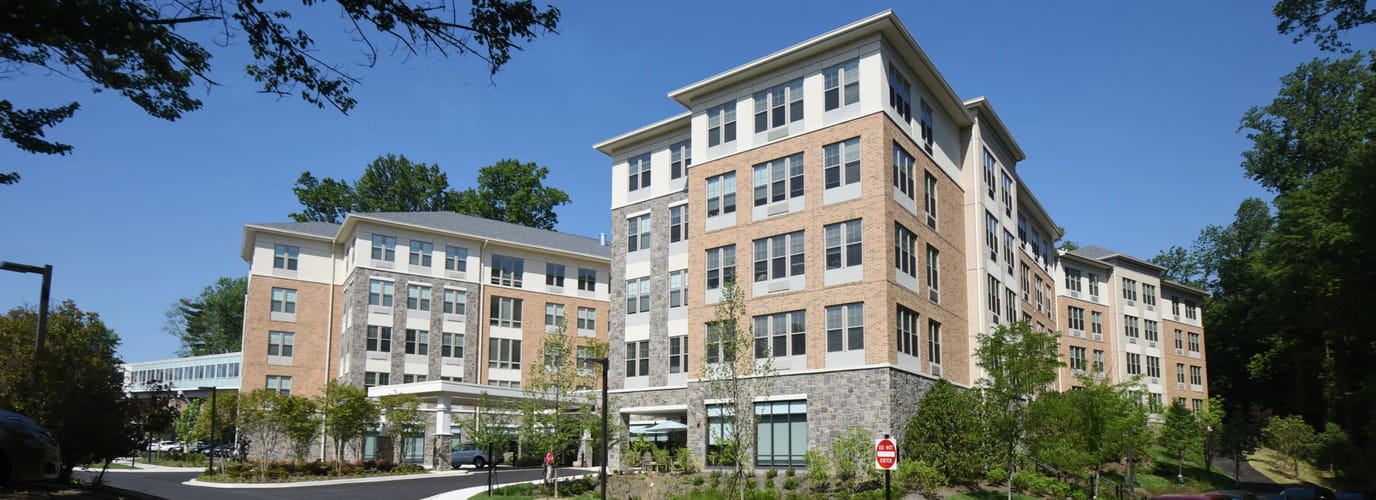
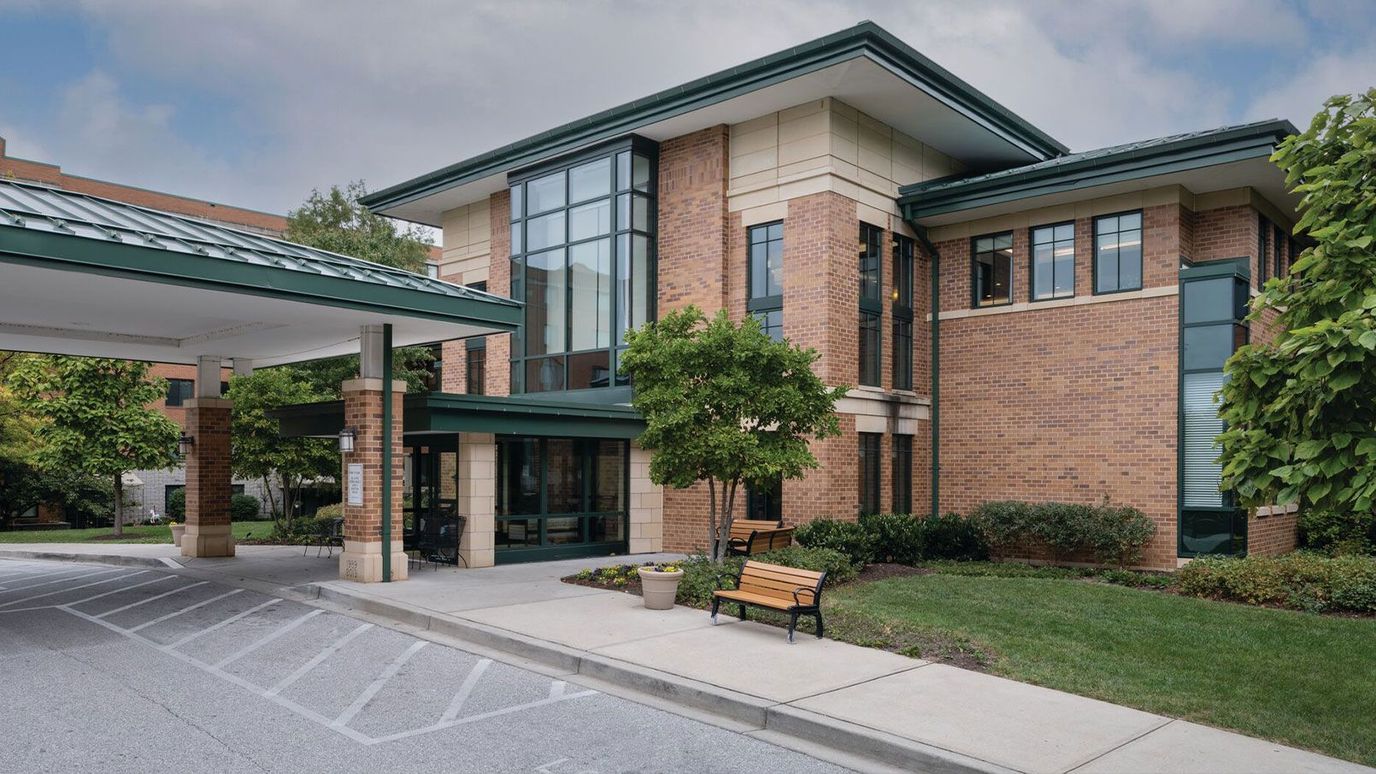
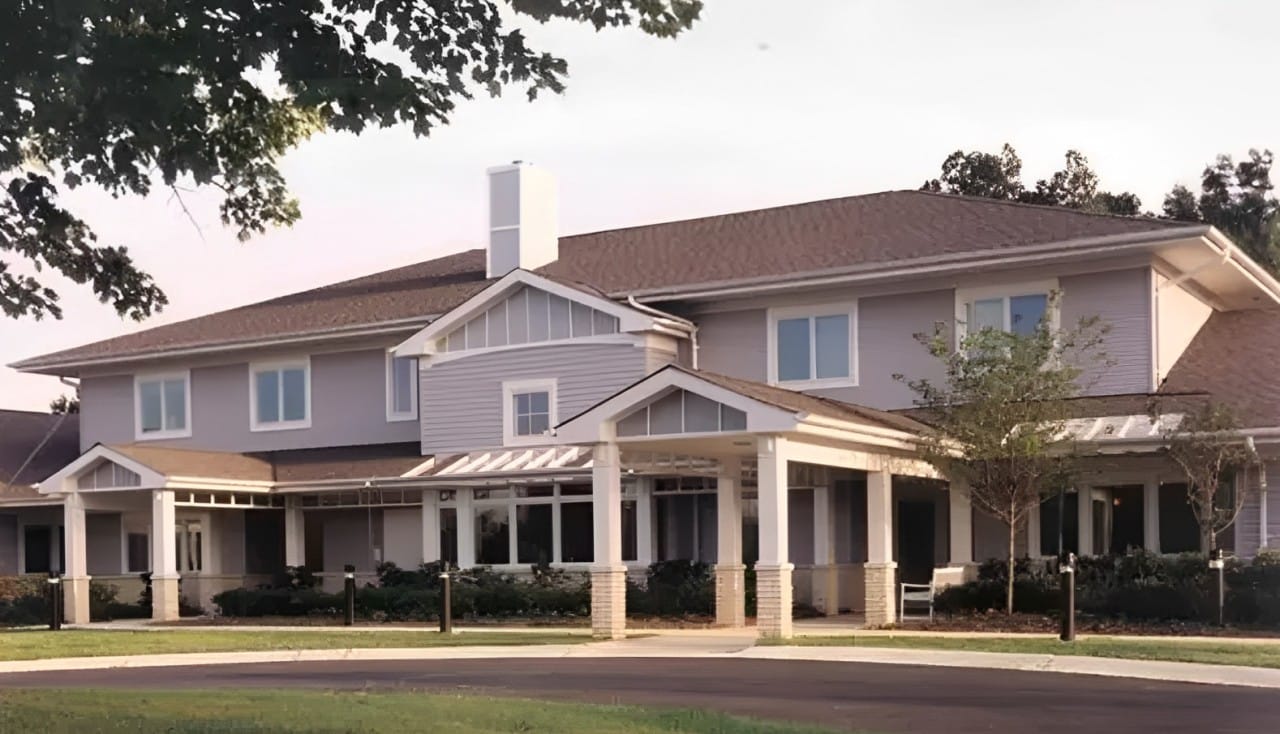
Located at 715 Maiden Choice Lane in Catonsville, Charlestown by Erickson Senior Living is a mid-rise assisted living and memory care community operated as a private-pay facility under the Erickson Senior Living organization.
The community houses residents in studios and one- and two-bedroom apartments ranging from 541 to 1,733 square feet, with pets permitted. Care services span assisted living, memory care, rehabilitation services, and respite care, supported by on-site health services, 24-hour staffing, medication management, personal assistance with activities of daily living, housekeeping, and laundry. Chef-prepared dining is offered across multiple venues positioned for resident convenience. Transportation to medical appointments and community outings is available.
Recreational and lifestyle programming centers on what the operator describes as “purposeful living” and resident growth, with activities designed to encourage active engagement. The property features a swimming pool, fitness center, salon services, walking paths, manicured gardens, and courtyard spaces. Fitness programming, recreational activities, and health services are integrated into daily operations.
The neighborhood’s walk score of 41 indicates partial walkability; while some nearby services are reachable on foot, most errands require transportation. The facility sits 2.2 miles from Catonsville city center and 1.48 miles from Ascension Saint Agnes Hospital.
Charlestown operates outside the Medicare and Medicaid certification framework. It is not CMS-certified and does not accept government insurance. The facility is not subject to the inspection protocols, citation standards, or compliance oversight applied to certified long-term care facilities. State licensing may apply.
Families considering placement should request directly from the community information regarding state licensing status, staff qualifications, care protocols, resident satisfaction data, and any outcome metrics the operator maintains.
Charlestown serves residents seeking assisted or memory care in a private-pay model with emphasis on recreational amenities and social programming.
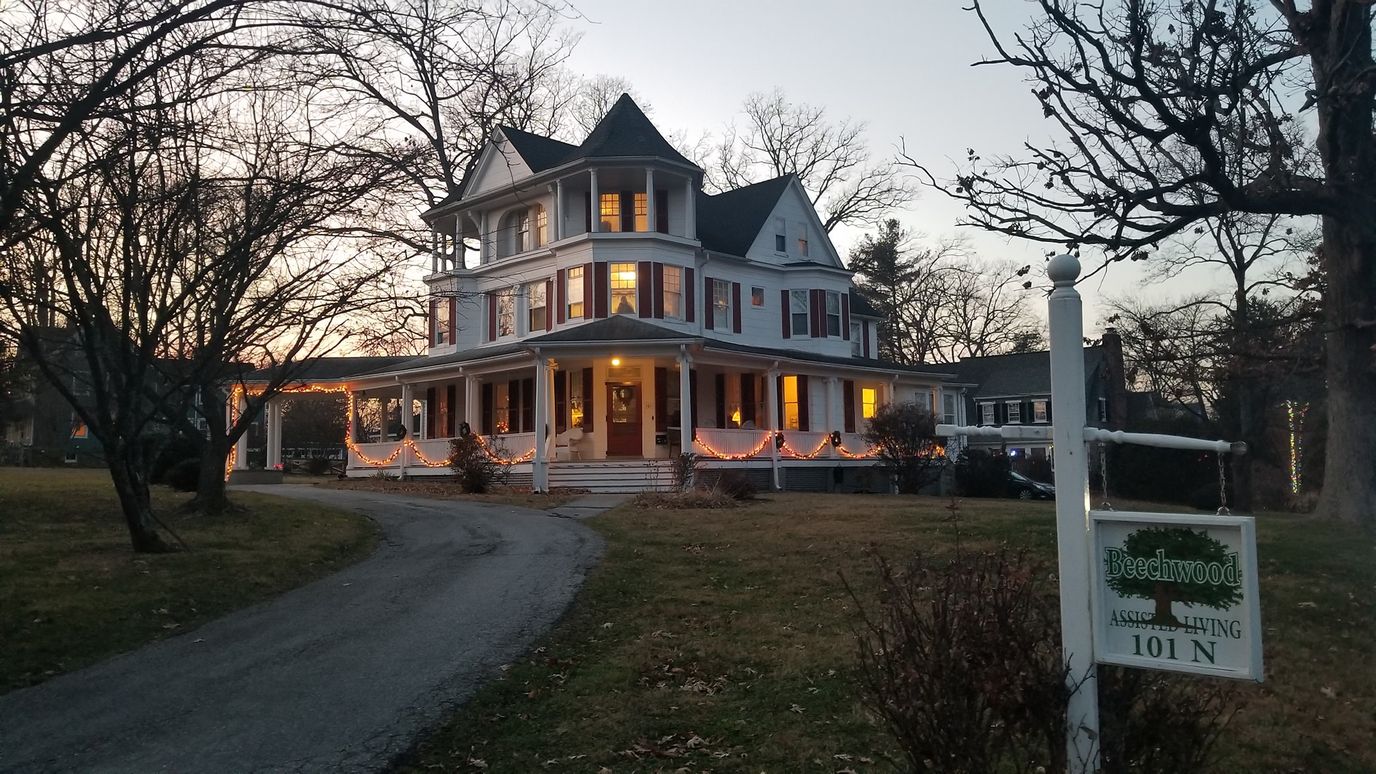
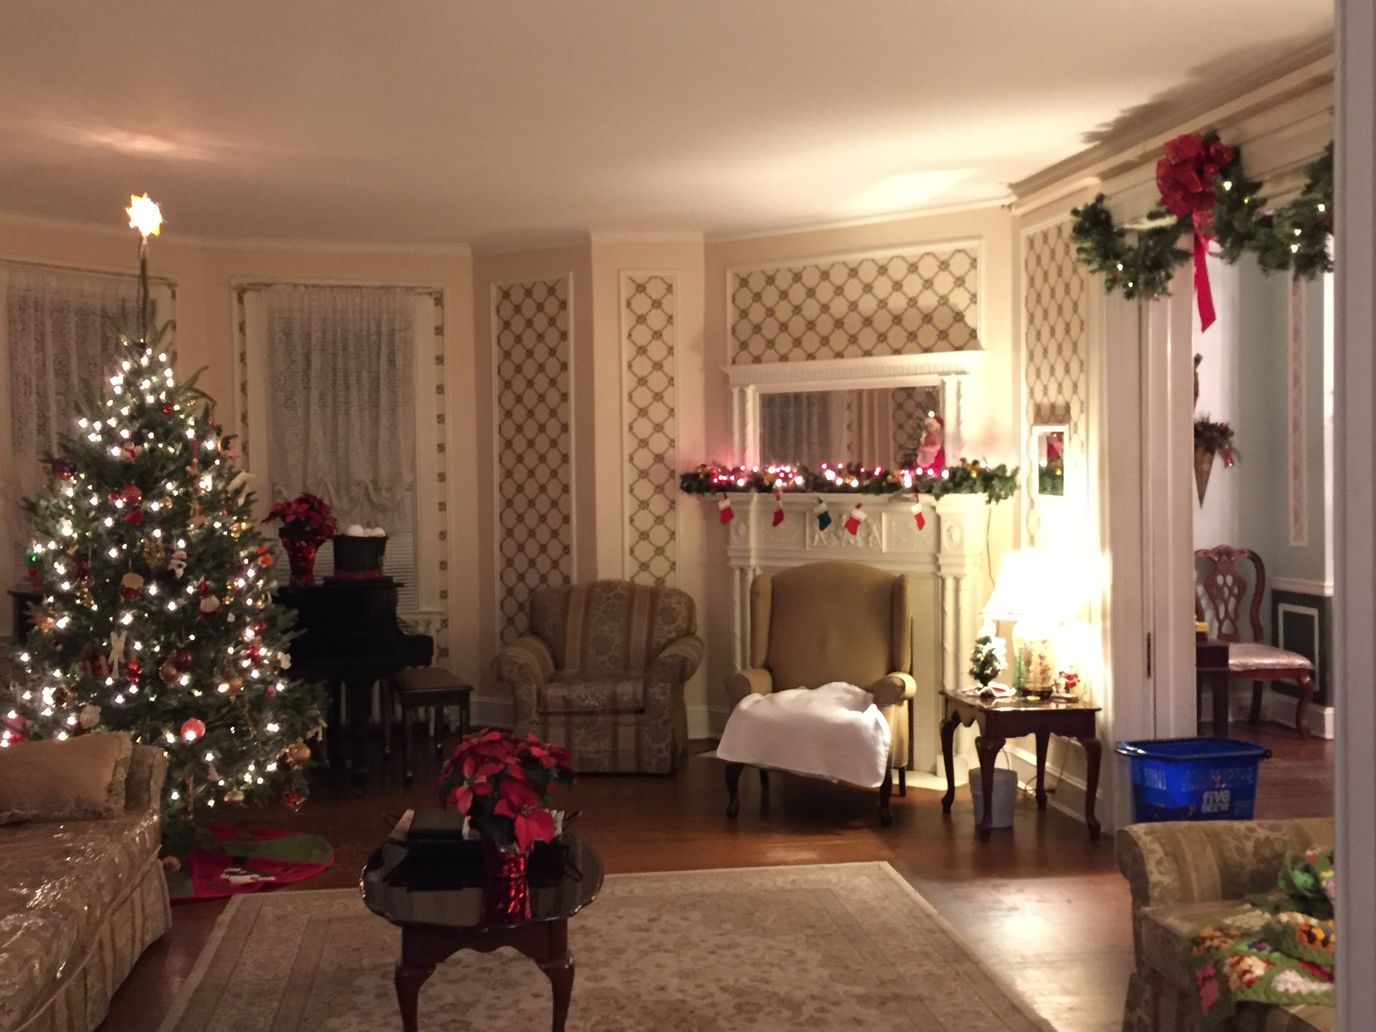
Overview of Beechwood Assisted Living
Beechwood Assisted Living is a cozy, comfortable, and elegant home with quality services in Catonsville. By offering senior assisted living services, residents maintain individuality and enrich their lifestyles through resort-style settings. Management strives to improve the lives of its residents by elevating their daily living in a quiet, charming location. The upscale senior living home ensures that quality caregiving is the top priority on their list, enabling a level of trust that many families have praised over the years.
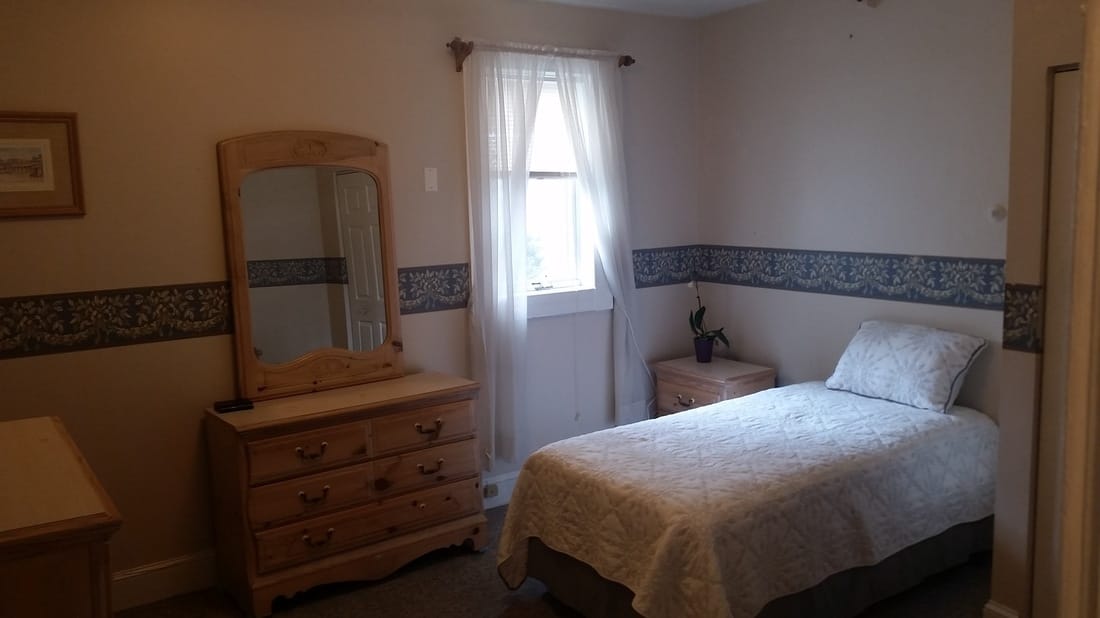
Beechwood’s accommodations for hassle-free, accessible, and stable senior living. Premium services and amenities include fitness activities, recreational programs, scheduled outings, entertainment programs, specialized programs, home-cooked meals, housekeeping, transportation, and ADLs.
Introducing Raphael House, where assisted living residents are embraced by an engaging and fulfilling lifestyle, surrounded by the familiarity and ease of home. With a dedication to providing comfort and convenience, Raphael House relieves residents of daily tasks, offering delectable meals and attentive housekeeping services. This thoughtful approach grants residents the freedom to connect with others, partake in recreational pursuits, or simply relish a moment with a captivating book.
Amid the tranquil surroundings of Raphael House in Rockville, Maryland, residents find reassurance in knowing that compassionate staff members are readily available to provide support whenever needed. Take on a journey of enriched living, where each day unfolds with possibilities and the comfort of a nurturing community.
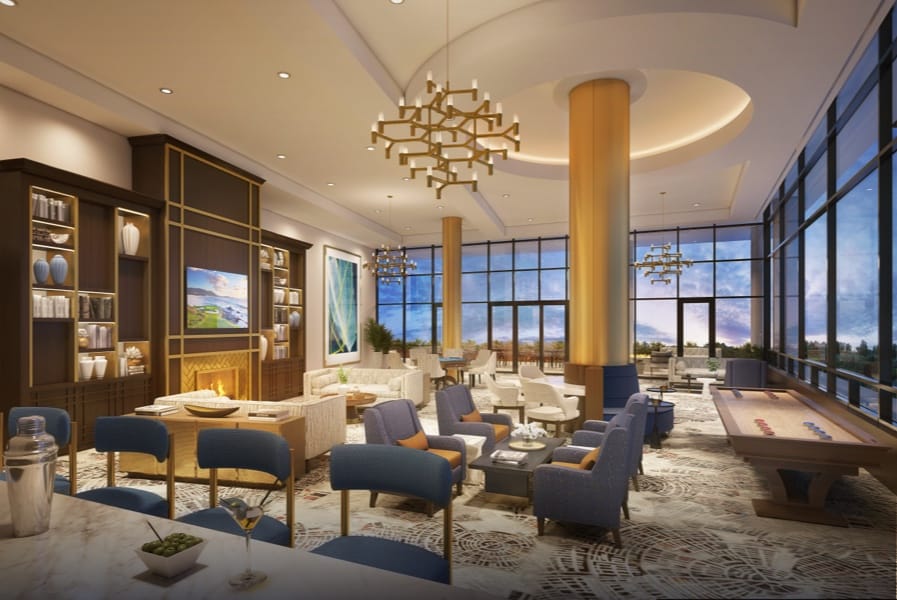
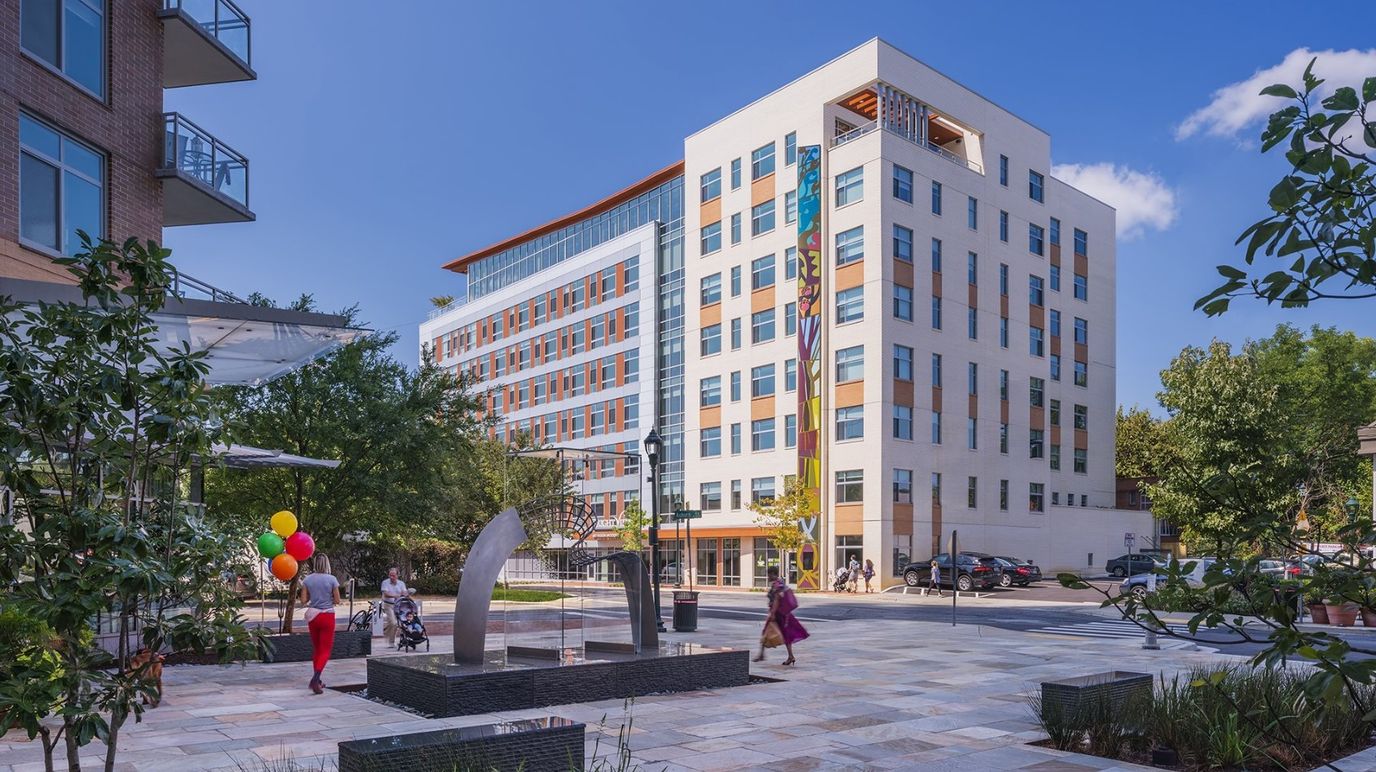
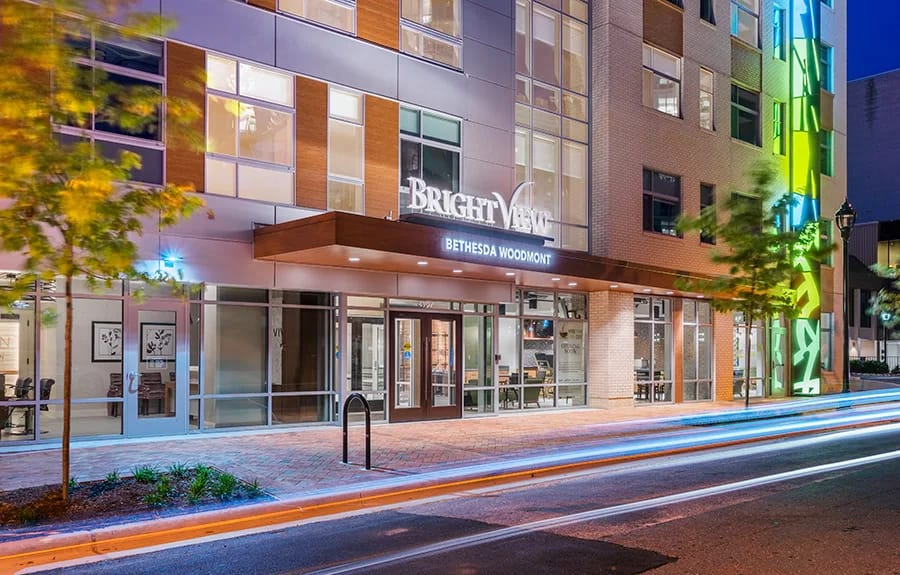
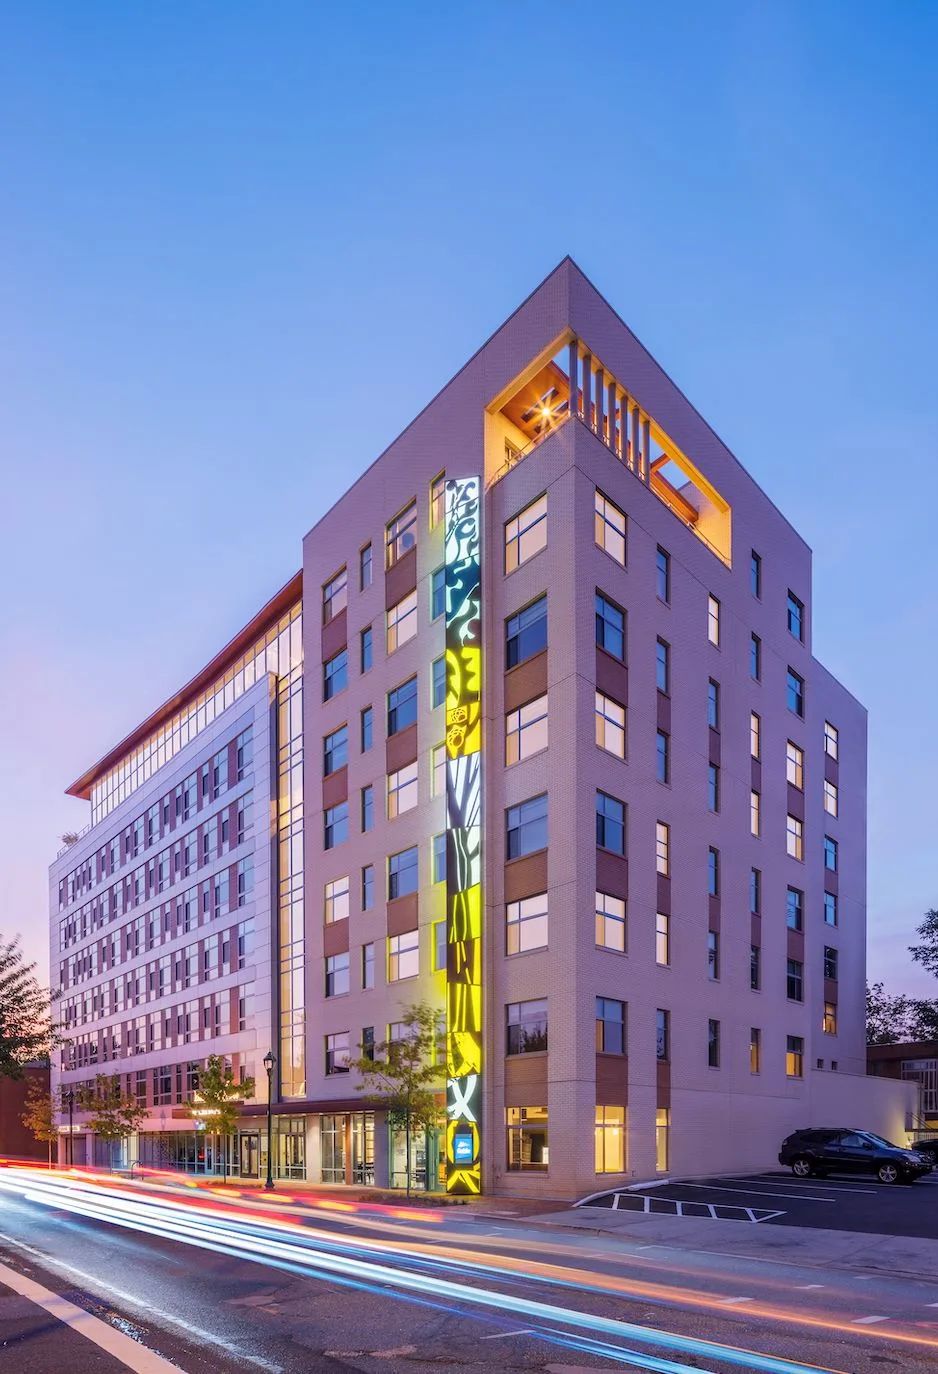
With two decades of experience in senior living, Brightview Bethesda Woodmont is a trusted choice for those seeking exceptional care. Offering a variety of floor plans, residents can find a layout that suits their needs. Gourmet dining, sophisticated amenities, and exceptional services are all part of the package, and there’s no long-term commitment required. Brightview Bethesda Woodmont is conveniently located just minutes away from the Kennedy Center and Walter Reed, offering endless opportunities for fun activities.
With a community movie theater, a beautiful rooftop deck with breathtaking views, and landscaped scenery, seniors can enjoy all that Brightview Bethesda Woodmont has to offer. They also serve delicious, freshly prepared dishes that residents can savor while taking in the sights and sounds of the cityscape.
Inspirations Assisted Living & Memory Care of Linthicum
At Inspirations Assisted Living & Memory Care of Linthicum, Maryland, residents can enjoy a picturesque setting that lets them bask in the sun and breathe in the fresh air of the tight-knit community. With all-inclusive care options, residents receive medication management and assistance with showering, dressing, mobility, incontinence, and dining. The community is private pay, and family members are welcome to visit around the clock.
The well-lit open spaces and secured environment, as well as field trips, raised gardens, free Wi-Fi and flat screen TV suites with private full bathrooms and custom ADA vanities make for a comfortable stay. The superior staff-to-resident ratio ensures that residents receive the attention and care they need, while the well-lit, homey interior creates a collected and calm atmosphere. They also offer art, music, animal, and other holistic therapies, as well as life enrichment activities that allow residents to discover their passions and achieve their dreams.
Ranking Methodology
How we rank these assisted living communities
Every community above is evaluated across six weighted categories using public data including state inspection records, review platforms, BBB profiles, and operator-published materials.
Weighting overview
- 35%Resident Experience
- 25%Regulatory
- 15%Visual Media
- 10%Website
- 10%Stability
- 5%Environment
01
Resident & Family Experience 35%
The single largest share of every ranking. Aggregated review sentiment and volume from major platforms — the closest signal to real resident experience.
- Includes
- Review Sentiment
- Review Volume
02
Regulatory & Safety Record 25%
State inspection records, citations, and complaint visits. We weight per-inspection rates more heavily than raw counts.
- Includes
- State Inspections
- Citations/Inspection
- % Inspections w/ Citations
- Complaint Visits
- Accreditations
- BBB Rating
03
Visual Media & Transparency 15%
Communities that publish high-quality visuals give families a real preview. No photos or tours = a negative transparency signal.
- Includes
- Video Tours
- Virtual Walkthroughs
- Photo Quantity
- Photo Quality
04
Website & Operator Transparency 10%
Site quality and whether the operator publishes basic accountability information — staff names, contact details, ownership.
- Includes
- Website Content
- Mobile Usability
- Staff Info Available
- Owner Info Available
05
Community Stability 10%
Operational signals indicating whether a community is well-run and meeting demand.
- Includes
- Occupancy Rate
- Bed Options
06
Environment & Pricing 5%
Walkability and pricing transparency. Walk Score is weighted higher for Independent Living than for Memory Care, where most residents do not leave unaccompanied.
- Includes
- Walk Score
- Pricing Transparency
Who we are
Your Senior Care Partner, Every Step of the Way
We help families find affordable senior communities and unlock same day discounts, Medicaid, and Medicare options tailored to your needs.
Contact us Today
Frequently Asked Questions about Assisted Living in Maryland
What's the difference between assisted living and memory care in Maryland?
Assisted living in Maryland supports residents with daily activities (bathing, dressing, medication management) while preserving independence. Memory care is a specialized form of assisted living for residents living with Alzheimer's or dementia, and adds 24/7 secured environments, dementia-trained staff, and structured routines designed to reduce confusion and wandering.
What's the difference between assisted living and a nursing home in Maryland?
Assisted living in Maryland is a residential model focused on housing, hospitality, and help with daily activities. Nursing homes (skilled nursing facilities) provide 24/7 medical care from licensed nurses for residents with significant health needs, and are regulated more strictly under both state and federal CMS rules.
Does Maryland Medicaid cover assisted living?
Maryland Medicaid does not directly pay room-and-board for assisted living, but most states (including Maryland) offer Home and Community-Based Services (HCBS) waivers that can offset the cost of care services delivered inside a licensed community. Eligibility, waitlists, and covered services vary — check directly with the state Medicaid agency.
What is assisted living?
Assisted living combines private or semi-private apartments with help on activities of daily living (meals, bathing, dressing, medication management) and a social calendar — for residents who need some support but do not need 24/7 medical care.
How many assisted living facilities are listed on this page?
This page features 820 assisted living facilities in Maryland. Use the filters and comparison tools above to compare ratings, amenities, and pricing.
How do I choose the right assisted living facility in Maryland?
Start by matching the level of care offered to the resident's current and anticipated needs, then compare licensing status, staff-to-resident ratios, recent inspection results, and pricing. Tour at least two or three communities in Maryland, talk to current residents and families, and confirm what is included in the base rate versus billed as add-on services.
What should I look for when visiting assisted living facilities in Maryland?
Pay attention to staff interactions with residents, cleanliness and odor, food quality at meal times, the activity calendar, and how questions about pricing and care plans are answered. Ask to see the most recent state inspection report, the move-out / level-of-care-change policy, and a sample monthly bill that lists every fee.
Updated on
