


Where in Maryland are you looking?
Browse communities by city.
Compare Independent Living around Maryland
| Edenwald Senior Living | IL AL MC NH SNF | Towson (Southerly Road) | 94
Facility
94
MD AVG
43
Rank
#144 / 690 | No |
83
Facility
83
MD AVG
43
Rank
#70 / 985 | 1 Bed / 2 Bed | - | A+ |
18% Male Residents — State Benchmarked 18% of residents are male, compared to the Maryland average of 31%. This facility caters to a majority female resident pool (82% female), consistent with the broader assisted living trend where women significantly outnumber men. |
82% Female Residents — State Benchmarked 82% of residents are female, compared to the Maryland average of 69%. Women comprise the large majority, consistent with national assisted living demographics where women live longer and enter care facilities at higher rates. |
100% White Residents — State Benchmarked 100% of residents are reported as White, compared to the Maryland average of 81%. A higher White share than is typical for assisted living in Maryland in this dataset — compare with peer facilities for local context. |
0% African American Residents — State Benchmarked 0% of residents are reported as African American or Black, compared to the Maryland average of 13%. A lower African American share than is typical in Maryland; local markets still vary widely. |
0% Other Ethnicity Residents — State Benchmarked 0% of residents fall into categories other than White or African American (combined), compared to the Maryland average of 6%. This column aggregates Hispanic, Asian, multiracial, and any other labeled groups that are not classified as White or African American. | - |
13% Residents Age 75–84 — State Benchmarked 13% of residents are 75–84, compared to the Maryland average of 31%. Below the state norm — the resident mix may skew either younger or older than this typical middle bracket. |
53% Residents Age 85–94 — State Benchmarked 53% of residents are 85–94, compared to the Maryland average of 44%. A high concentration of very elderly residents signals a higher-acuity facility with experience caring for advanced age-related needs. |
35% Residents Age 95+ — State Benchmarked 35% of residents are 95 or older, compared to the Maryland average of 16%. A high proportion of the oldest-old suggests strong end-of-life care experience and very-high-acuity capabilities. |
| Homewood Living Frederick | IL AL MC NH SNF | Frederick | 120
Facility
120
MD AVG
43
Rank
#76 / 690 | Yes |
14
Facility
14
MD AVG
43
Rank
#788 / 985 | 1 Bed / 2 Bed | - | - | - | - | - | - | - | - | - | - | - |
| Ingleside at King Farm | IL AL MC NH SNF | Rockville (King Farm) | 45
Facility
45
MD AVG
43
Rank
#226 / 690 | Yes |
73
Facility
73
MD AVG
43
Rank
#152 / 985 | 1 Bed / 2 Bed | - | - | - | - | - | - | - | - | - | - | - |
| Bedford Court, a CCRC | IL AL HOS MC NH RC SNF | Silver Spring (International Drive) | 76
Facility
76
MD AVG
43
Rank
#179 / 690 | Yes |
64
Facility
64
MD AVG
43
Rank
#261 / 985 | Studio / 1 Bed | 34
Facility
34
MD AVG
21
Rank
#22 / 210 | - |
15% Male Residents — State Benchmarked 15% of residents are male, compared to the Maryland average of 31%. This facility caters to a majority female resident pool (85% female), consistent with the broader assisted living trend where women significantly outnumber men. |
85% Female Residents — State Benchmarked 85% of residents are female, compared to the Maryland average of 69%. Women comprise the large majority, consistent with national assisted living demographics where women live longer and enter care facilities at higher rates. |
95% White Residents — State Benchmarked 95% of residents are reported as White, compared to the Maryland average of 81%. A higher White share than is typical for assisted living in Maryland in this dataset — compare with peer facilities for local context. |
3% African American Residents — State Benchmarked 3% of residents are reported as African American or Black, compared to the Maryland average of 13%. A lower African American share than is typical in Maryland; local markets still vary widely. |
2% Other Ethnicity Residents — State Benchmarked 2% of residents fall into categories other than White or African American (combined), compared to the Maryland average of 6%. This column aggregates Hispanic, Asian, multiracial, and any other labeled groups that are not classified as White or African American. Reported subgroups in this total: Asian (2%). |
2% Residents Age 65–74 — State Benchmarked 2% of residents are 65–74, compared to the Maryland average of 13%. Fewer younger seniors suggests the resident population skews older, likely requiring higher acuity care and more hands-on support. |
8% Residents Age 75–84 — State Benchmarked 8% of residents are 75–84, compared to the Maryland average of 31%. Below the state norm — the resident mix may skew either younger or older than this typical middle bracket. |
65% Residents Age 85–94 — State Benchmarked 65% of residents are 85–94, compared to the Maryland average of 44%. A high concentration of very elderly residents signals a higher-acuity facility with experience caring for advanced age-related needs. |
26% Residents Age 95+ — State Benchmarked 26% of residents are 95 or older, compared to the Maryland average of 16%. A high proportion of the oldest-old suggests strong end-of-life care experience and very-high-acuity capabilities. |
| Lutheran Village at Miller’s Grant | IL AL NH SNF | Ellicott City (Lutheran Village At Miller’s Grant) | 36
Facility
36
MD AVG
43
Rank
#237 / 690 | Yes |
19
Facility
19
MD AVG
43
Rank
#746 / 985 | 1 Bed / 2 Bed | 21
Facility
21
MD AVG
21
Rank
#108 / 210 | - |
17% Male Residents — State Benchmarked 17% of residents are male, compared to the Maryland average of 31%. This facility caters to a majority female resident pool (83% female), consistent with the broader assisted living trend where women significantly outnumber men. |
83% Female Residents — State Benchmarked 83% of residents are female, compared to the Maryland average of 69%. Women comprise the large majority, consistent with national assisted living demographics where women live longer and enter care facilities at higher rates. |
83% White Residents — State Benchmarked 83% of residents are reported as White, compared to the Maryland average of 81%. Close to the average for this category among assisted living facilities in Maryland with reported race/ethnicity data. |
11% African American Residents — State Benchmarked 11% of residents are reported as African American or Black, compared to the Maryland average of 13%. In line with the Maryland average for African American residents among facilities reporting this breakdown. |
6% Other Ethnicity Residents — State Benchmarked 6% of residents fall into categories other than White or African American (combined), compared to the Maryland average of 6%. This column aggregates Hispanic, Asian, multiracial, and any other labeled groups that are not classified as White or African American. Reported subgroups in this total: Asian (6%). | - |
33% Residents Age 75–84 — State Benchmarked 33% of residents are 75–84, compared to the Maryland average of 31%. This is the second most common age bracket in assisted living, representing residents with moderate care needs. |
44% Residents Age 85–94 — State Benchmarked 44% of residents are 85–94, compared to the Maryland average of 44%. This is typically the most common age bracket in assisted living — this facility is in line with the statewide norm. |
22% Residents Age 95+ — State Benchmarked 22% of residents are 95 or older, compared to the Maryland average of 16%. A high proportion of the oldest-old suggests strong end-of-life care experience and very-high-acuity capabilities. |
| Residences at Vantage Point | IL AL HC MC NH SNF | Columbia (Town Center) | 44
Facility
44
MD AVG
43
Rank
#229 / 690 | Yes |
52
Facility
52
MD AVG
43
Rank
#402 / 985 | Studio / 1 Bed / 2 Bed | 36
Facility
36
MD AVG
21
Rank
#16 / 210 | - | - | - | - | - | - | - | - | - | - |
| Maplewood Park Place | IL AL MC NH SNF | Bethesda (Pooks Hill) | 29
Facility
29
MD AVG
43
Rank
#247 / 690 | Yes |
38
Facility
38
MD AVG
43
Rank
#542 / 985 | 1 Bed / 2 Bed | 30
Facility
30
MD AVG
21
Rank
#44 / 210 | - |
18% Male Residents — State Benchmarked 18% of residents are male, compared to the Maryland average of 31%. This facility caters to a majority female resident pool (82% female), consistent with the broader assisted living trend where women significantly outnumber men. |
82% Female Residents — State Benchmarked 82% of residents are female, compared to the Maryland average of 69%. Women comprise the large majority, consistent with national assisted living demographics where women live longer and enter care facilities at higher rates. |
100% White Residents — State Benchmarked 100% of residents are reported as White, compared to the Maryland average of 81%. A higher White share than is typical for assisted living in Maryland in this dataset — compare with peer facilities for local context. |
0% African American Residents — State Benchmarked 0% of residents are reported as African American or Black, compared to the Maryland average of 13%. A lower African American share than is typical in Maryland; local markets still vary widely. |
0% Other Ethnicity Residents — State Benchmarked 0% of residents fall into categories other than White or African American (combined), compared to the Maryland average of 6%. This column aggregates Hispanic, Asian, multiracial, and any other labeled groups that are not classified as White or African American. | - |
6% Residents Age 75–84 — State Benchmarked 6% of residents are 75–84, compared to the Maryland average of 31%. Below the state norm — the resident mix may skew either younger or older than this typical middle bracket. |
24% Residents Age 85–94 — State Benchmarked 24% of residents are 85–94, compared to the Maryland average of 44%. The population here skews younger than the statewide norm, which may indicate a more active, lower-acuity community. |
71% Residents Age 95+ — State Benchmarked 71% of residents are 95 or older, compared to the Maryland average of 16%. A high proportion of the oldest-old suggests strong end-of-life care experience and very-high-acuity capabilities. |
| Friends House Retirement Community | IL AL NH SNF | Sandy Spring | 24
Facility
24
MD AVG
43
Rank
#249 / 690 | No |
6
Facility
6
MD AVG
43
Rank
#891 / 985 | - | 20
Facility
20
MD AVG
21
Rank
#112 / 210 | - |
6% Male Residents — State Benchmarked 6% of residents are male, compared to the Maryland average of 31%. This facility caters to a majority female resident pool (94% female), consistent with the broader assisted living trend where women significantly outnumber men. |
94% Female Residents — State Benchmarked 94% of residents are female, compared to the Maryland average of 69%. Women comprise the large majority, consistent with national assisted living demographics where women live longer and enter care facilities at higher rates. |
94% White Residents — State Benchmarked 94% of residents are reported as White, compared to the Maryland average of 81%. A higher White share than is typical for assisted living in Maryland in this dataset — compare with peer facilities for local context. |
0% African American Residents — State Benchmarked 0% of residents are reported as African American or Black, compared to the Maryland average of 13%. A lower African American share than is typical in Maryland; local markets still vary widely. |
6% Other Ethnicity Residents — State Benchmarked 6% of residents fall into categories other than White or African American (combined), compared to the Maryland average of 6%. This column aggregates Hispanic, Asian, multiracial, and any other labeled groups that are not classified as White or African American. Reported subgroups in this total: Asian (6%). |
6% Residents Age 65–74 — State Benchmarked 6% of residents are 65–74, compared to the Maryland average of 13%. Fewer younger seniors suggests the resident population skews older, likely requiring higher acuity care and more hands-on support. |
18% Residents Age 75–84 — State Benchmarked 18% of residents are 75–84, compared to the Maryland average of 31%. Below the state norm — the resident mix may skew either younger or older than this typical middle bracket. |
53% Residents Age 85–94 — State Benchmarked 53% of residents are 85–94, compared to the Maryland average of 44%. A high concentration of very elderly residents signals a higher-acuity facility with experience caring for advanced age-related needs. |
24% Residents Age 95+ — State Benchmarked 24% of residents are 95 or older, compared to the Maryland average of 16%. A high proportion of the oldest-old suggests strong end-of-life care experience and very-high-acuity capabilities. |
| Revitz House | IL AL HC MC NH SNF | Rockville | 558
Facility
558
MD AVG
43
Rank
#1 / 690 | Yes |
81
Facility
81
MD AVG
43
Rank
#86 / 985 | 1 Bed | - | - | - | - | - | - | - | - | - | - | - |
| Broadmead | IL AL MC NH RC SNF | Cockeysville | 40
Facility
40
MD AVG
43
Rank
#233 / 690 | No |
0
Facility
0
MD AVG
43
Rank
#959 / 985 | - | 47
Facility
47
MD AVG
21
Rank
#3 / 210 | A+ | - | - | - | - | - | - | - | - | - |
| Blakehurst (Chestnut Green) | IL AL MC NH SNF | Towson | 35
Facility
35
MD AVG
43
Rank
#239 / 690 | No |
10
Facility
10
MD AVG
43
Rank
#837 / 985 | - | 33
Facility
33
MD AVG
21
Rank
#25 / 210 | - | - | - | - | - | - | - | - | - | - |
| Asbury Methodist Village | IL AL MC NH SNF | Gaithersburg (Russell Avenue) | 164
Facility
164
MD AVG
43
Rank
#26 / 690 | Yes |
41
Facility
41
MD AVG
43
Rank
#508 / 985 | - | 27
Facility
27
MD AVG
21
Rank
#62 / 210 | - |
21% Male Residents — State Benchmarked 21% of residents are male, compared to the Maryland average of 31%. This facility caters to a majority female resident pool (79% female), consistent with the broader assisted living trend where women significantly outnumber men. |
79% Female Residents — State Benchmarked 79% of residents are female, compared to the Maryland average of 69%. Women comprise the large majority, consistent with national assisted living demographics where women live longer and enter care facilities at higher rates. |
92% White Residents — State Benchmarked 92% of residents are reported as White, compared to the Maryland average of 81%. A higher White share than is typical for assisted living in Maryland in this dataset — compare with peer facilities for local context. |
1% African American Residents — State Benchmarked 1% of residents are reported as African American or Black, compared to the Maryland average of 13%. A lower African American share than is typical in Maryland; local markets still vary widely. |
7% Other Ethnicity Residents — State Benchmarked 7% of residents fall into categories other than White or African American (combined), compared to the Maryland average of 6%. This column aggregates Hispanic, Asian, multiracial, and any other labeled groups that are not classified as White or African American. Reported subgroups in this total: Asian (7%). |
1% Residents Age 65–74 — State Benchmarked 1% of residents are 65–74, compared to the Maryland average of 13%. Fewer younger seniors suggests the resident population skews older, likely requiring higher acuity care and more hands-on support. |
21% Residents Age 75–84 — State Benchmarked 21% of residents are 75–84, compared to the Maryland average of 31%. Below the state norm — the resident mix may skew either younger or older than this typical middle bracket. |
48% Residents Age 85–94 — State Benchmarked 48% of residents are 85–94, compared to the Maryland average of 44%. This is typically the most common age bracket in assisted living — this facility is in line with the statewide norm. |
30% Residents Age 95+ — State Benchmarked 30% of residents are 95 or older, compared to the Maryland average of 16%. A high proportion of the oldest-old suggests strong end-of-life care experience and very-high-acuity capabilities. |
| Ginger Cove | IL AL HC MC NH SNF | Annapolis (River Crescent Drive) | 96
Facility
96
MD AVG
43
Rank
#136 / 690 | No |
51
Facility
51
MD AVG
43
Rank
#413 / 985 | 1 Bed / 2 Bed | 42
Facility
42
MD AVG
21
Rank
#8 / 210 | A+ |
40% Male Residents — State Benchmarked 40% of residents are male, compared to the Maryland average of 31%. A relatively balanced gender mix for assisted living, where facilities typically skew heavily female. |
60% Female Residents — State Benchmarked 60% of residents are female, compared to the Maryland average of 69%. Closer to an even gender split than most assisted living facilities, which typically have 65–75% female residents. |
100% White Residents — State Benchmarked 100% of residents are reported as White, compared to the Maryland average of 81%. A higher White share than is typical for assisted living in Maryland in this dataset — compare with peer facilities for local context. |
0% African American Residents — State Benchmarked 0% of residents are reported as African American or Black, compared to the Maryland average of 13%. A lower African American share than is typical in Maryland; local markets still vary widely. |
0% Other Ethnicity Residents — State Benchmarked 0% of residents fall into categories other than White or African American (combined), compared to the Maryland average of 6%. This column aggregates Hispanic, Asian, multiracial, and any other labeled groups that are not classified as White or African American. | - |
13% Residents Age 75–84 — State Benchmarked 13% of residents are 75–84, compared to the Maryland average of 31%. Below the state norm — the resident mix may skew either younger or older than this typical middle bracket. |
64% Residents Age 85–94 — State Benchmarked 64% of residents are 85–94, compared to the Maryland average of 44%. A high concentration of very elderly residents signals a higher-acuity facility with experience caring for advanced age-related needs. |
22% Residents Age 95+ — State Benchmarked 22% of residents are 95 or older, compared to the Maryland average of 16%. A high proportion of the oldest-old suggests strong end-of-life care experience and very-high-acuity capabilities. |
| Charlestown Community | IL NH | Baltimore | 238
Facility
238
MD AVG
43
Rank
#5 / 690 | No |
36
Facility
36
MD AVG
43
Rank
#563 / 985 | - | 35
Facility
35
MD AVG
21
Rank
#18 / 210 | - | - | - | - | - | - | - | - | - | - |
| Pickersgill Retirement Community | IL AL NH SNF | Baltimore (Chestnut Hill) | 138
Facility
138
MD AVG
43
Rank
#56 / 690 | No |
45
Facility
45
MD AVG
43
Rank
#475 / 985 | - | - | A+ |
24% Male Residents — State Benchmarked 24% of residents are male, compared to the Maryland average of 31%. This facility caters to a majority female resident pool (76% female), consistent with the broader assisted living trend where women significantly outnumber men. |
76% Female Residents — State Benchmarked 76% of residents are female, compared to the Maryland average of 69%. Women comprise the large majority, consistent with national assisted living demographics where women live longer and enter care facilities at higher rates. |
95% White Residents — State Benchmarked 95% of residents are reported as White, compared to the Maryland average of 81%. A higher White share than is typical for assisted living in Maryland in this dataset — compare with peer facilities for local context. |
1% African American Residents — State Benchmarked 1% of residents are reported as African American or Black, compared to the Maryland average of 13%. A lower African American share than is typical in Maryland; local markets still vary widely. |
4% Other Ethnicity Residents — State Benchmarked 4% of residents fall into categories other than White or African American (combined), compared to the Maryland average of 6%. This column aggregates Hispanic, Asian, multiracial, and any other labeled groups that are not classified as White or African American. Reported subgroups in this total: Asian (4%). |
3% Residents Age 65–74 — State Benchmarked 3% of residents are 65–74, compared to the Maryland average of 13%. Fewer younger seniors suggests the resident population skews older, likely requiring higher acuity care and more hands-on support. |
27% Residents Age 75–84 — State Benchmarked 27% of residents are 75–84, compared to the Maryland average of 31%. This is the second most common age bracket in assisted living, representing residents with moderate care needs. |
55% Residents Age 85–94 — State Benchmarked 55% of residents are 85–94, compared to the Maryland average of 44%. A high concentration of very elderly residents signals a higher-acuity facility with experience caring for advanced age-related needs. |
15% Residents Age 95+ — State Benchmarked 15% of residents are 95 or older, compared to the Maryland average of 16%. In line with the statewide profile for the oldest resident bracket. |
Rows per page:

View all Nearby Homes
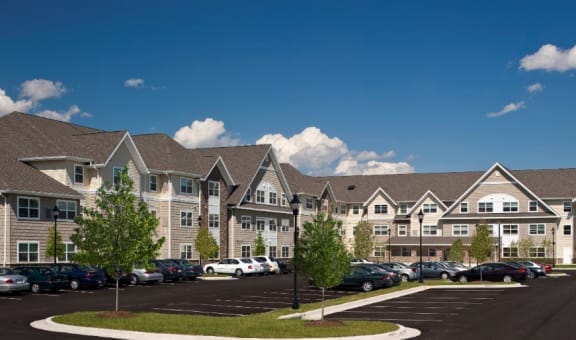
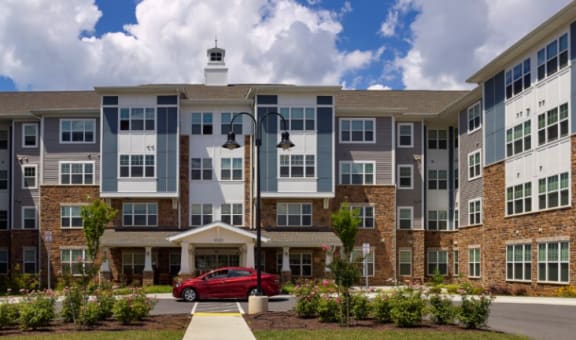
Conveniently located in the thriving neighborhood of Silver Spring, MD, The Bonifant at Silver is an astounding community that offers independent living. The community features cozy and specially designed one-bedroom floor plans, ensuring that those 62+ are comfortable and safe. On-site maintenance, management, and concierge services are also provided, so residents have a worry-free lifestyle.
Residents will not run out of things to do for leisure and wellness with a well-thought-out calendar of engaging activities and enriching programs. Delightful restaurants and shops in the area provide residents with a variety of dining options that cater to their dietary needs and preferences. Accompanied by the community’s extensive services and state-of-the-art amenities, residents are guaranteed the finest retirement experience.
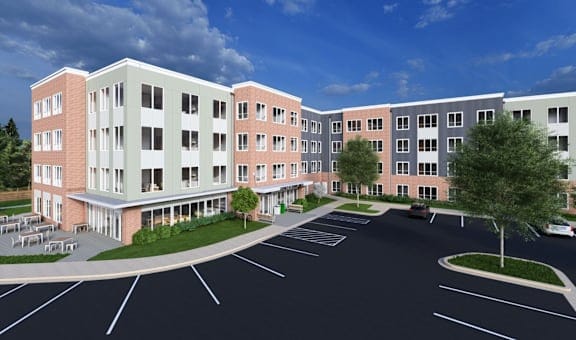
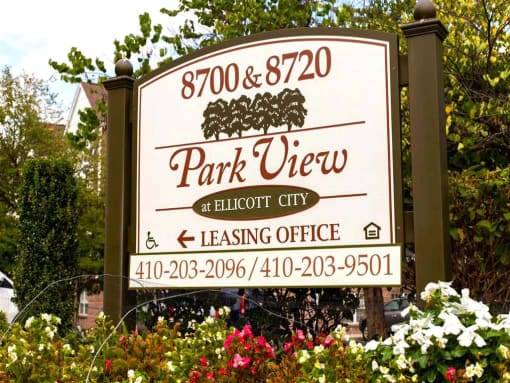
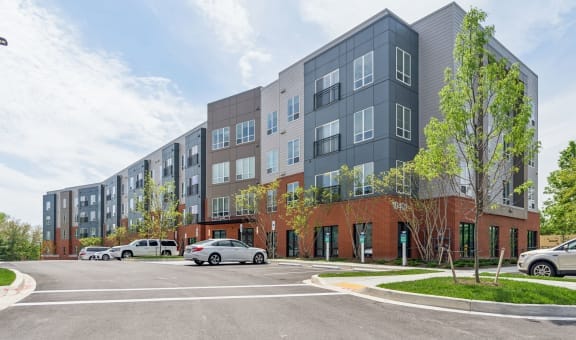
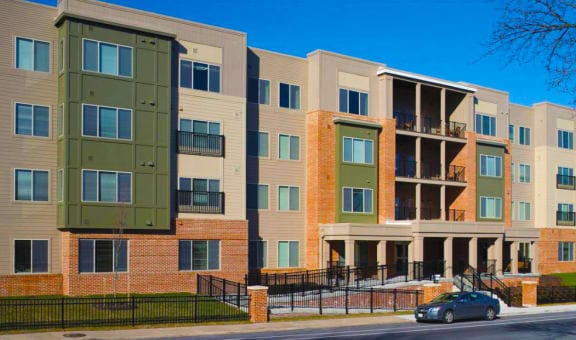
Spend your golden years at Park View at Ellicott City, a blissful haven in Ellicott City, MD, offering independent living. The community is dedicated to enhancing the quality of life of those 62+, providing thoughtfully designed and sophisticated one- and two-bedroom floor plans. Residents can keep their peace of mind with round-the-clock emergency maintenance, management, and laundry spaces.
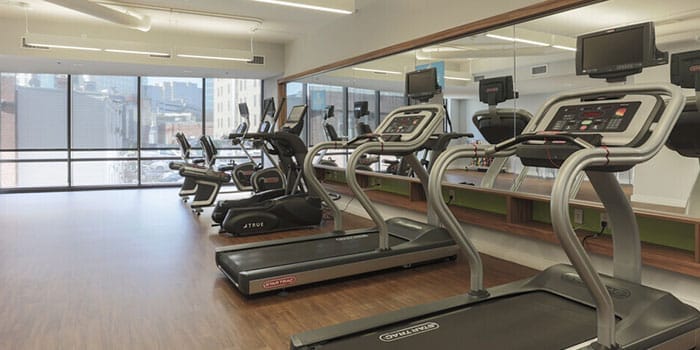
Cozy communal spaces and wellness opportunities are available, ensuring residents can live an active and vibrant lifestyle. Here, residents have easy access to plenty of dining options with restaurants and shops nearby. A library, a fitness center, a game room, a computer center, salon services, and a wellness suite are available, creating the ideal setting for residents to thrive in retirement.
Located in Hagerstown, MD, Coffman Nursing Home is a welcoming home that offers compassionate skilled nursing and rehabilitation services for over 50 years. Specializing in individualized care, the highly equipped and dedicated team at Coffman collaborates with residents and families to create personalized treatment plans. With private and shared room options, each equipped with amenities like flat-screen TVs and free internet, residents can enjoy comfort in a home-like environment tailored to meet diverse needs.
The community is committed to creating a vibrant community where residents can engage in enriching activities, including gardening, music programs, and intergenerational events with local schools. Rehabilitation offerings, such as gait training and pain management, support each resident’s wellness journey. With amenities like an outdoor pond, a serene patio, and daily sensory programs, Coffman Nursing Home provides an inviting setting where residents can thrive in warmth and care.
Oak Crest Village is a 183-bed skilled nursing and rehabilitation facility at 8830 Walther Boulevard in Parkville, Baltimore County, Maryland, operated by a voluntary non-profit within a full-continuum continuing care retirement community. Accepted are Medicare and private pay. Most residents come for short-term rehabilitation and average staying for 82 days.
CMS scores the facility 3 stars, 12 percent below Maryland’s average, with health inspection as the primary drag at 37.5 percent below state figure. Staffing is the contrasting strength at 41.2 percent above Maryland’s average, nurse hours reach 4h 24m per resident per day, ranked 23rd out of 144 Maryland skilled nursing facilities. Across 4 inspections since 2018, the facility recorded 33 total citations including 3 serious findings, 400 percent above Maryland’s average, and a $50,000 federal fine issued in September 2024, with no payment denials. The facility has some availability at 72 percent occupancy, above Maryland’s 60 percent average.
Amenities include a fitness center, aquatics center, walking paths, and on-site dining. Respite care and memory care exist alongside rehabilitation services and an active resident council.
With staffing levels well above state average, the community is built for short-term Medicare rehabilitation within a nonprofit CCRC campus in suburban Baltimore County.
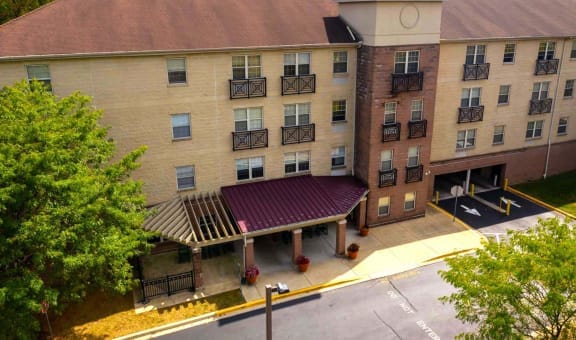
Offering personal care, rehabilitation, and short-term rehab, Baywoods of Annapolis is a 60+ assisted living community in Annapolis, Maryland, that has been operating for 17 years. The community has a current occupancy of 66.7%, with an average stay of 104 days. Dining services, transportation, and assistance with activities of daily living are also provided to support residents’ daily experiences. Pets are also welcome, allowing residents to bring animal companions.
Fitness programs, lectures, and a variety of activities are conducted to promote holistic wellness and encourage active living. The community also features one- and two-bedroom apartments in a three-story setting, ensuring residents can rest comfortably. Its location on Bay Front Drive is also slightly walkable, with a Walk Score of 28, requiring residents to access most amenities through transportation, though some services are available within walking distance. Baywoods of Annapolis also accepts Medicare and private pay, providing more payment options.
Overview of Village at Rockville


Owned by Kyle Hreben, Village at Rockville is a skilled nursing facility in Rockville, Maryland, part of a continuing care retirement community. Its location at 9701 Veirs Drive is in a very walkable area with a Walk Score of 94. The home accepts Medicare and private pay, providing multiple ways for families to cover short-term recovery and ongoing nursing care.
The community has 57 beds with a 77% occupancy rate. Residents stay an average of 104 days, including post-acute rehabilitation residents and those with longer-term care needs. Daily care is provided by a nursing team that averages 4 hours of total nursing support per resident each day. Registered nurses on staff provide 43 minutes per day per resident. The facility offers 24-hour staffing, rehabilitation services, and respite care, so it’s a great option for families navigating post-hospital recovery.
Village at Rockville has been operating for 13 years. The facility serves a neighborhood with good walkability, so it’s convenient for family members visiting on foot, especially when navigating nearby services and appointments.
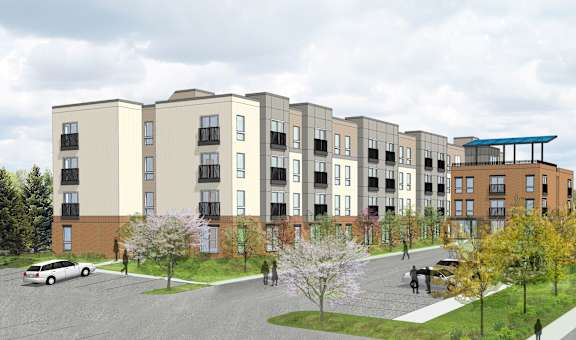
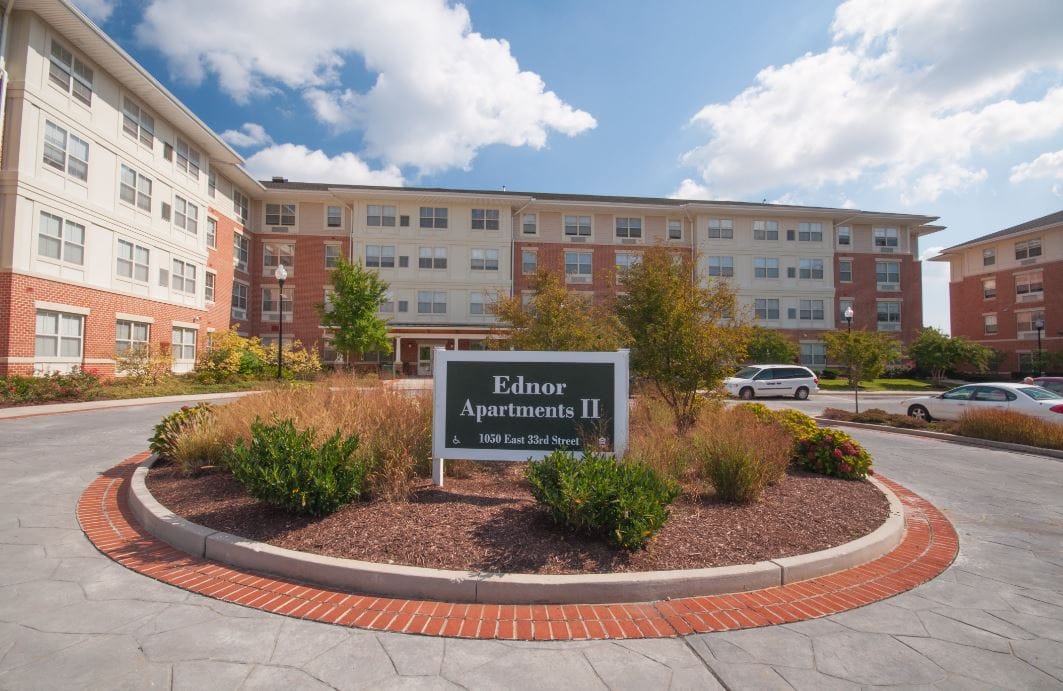
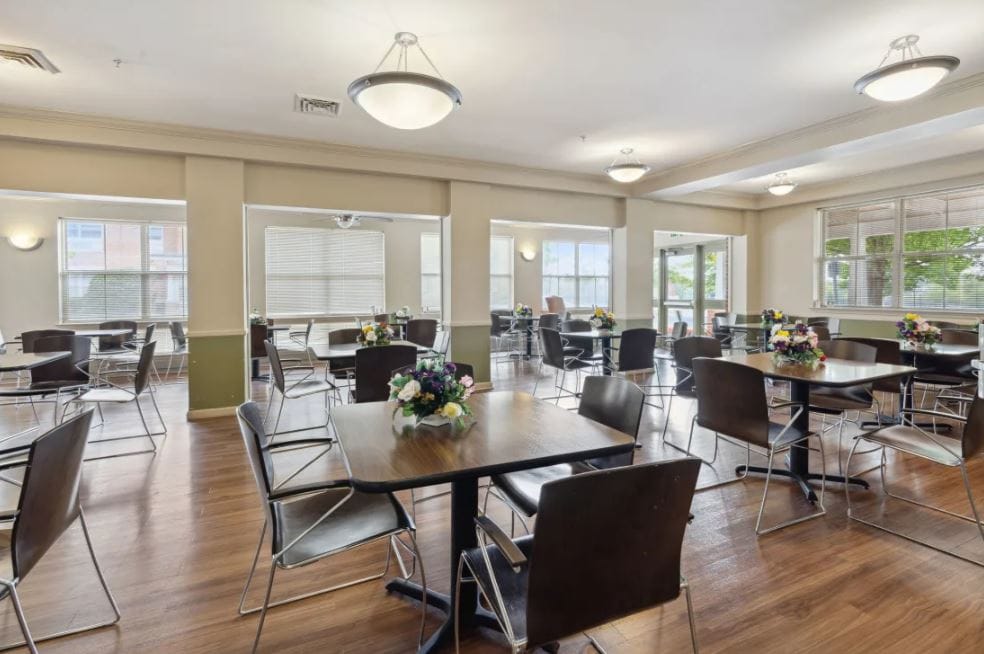
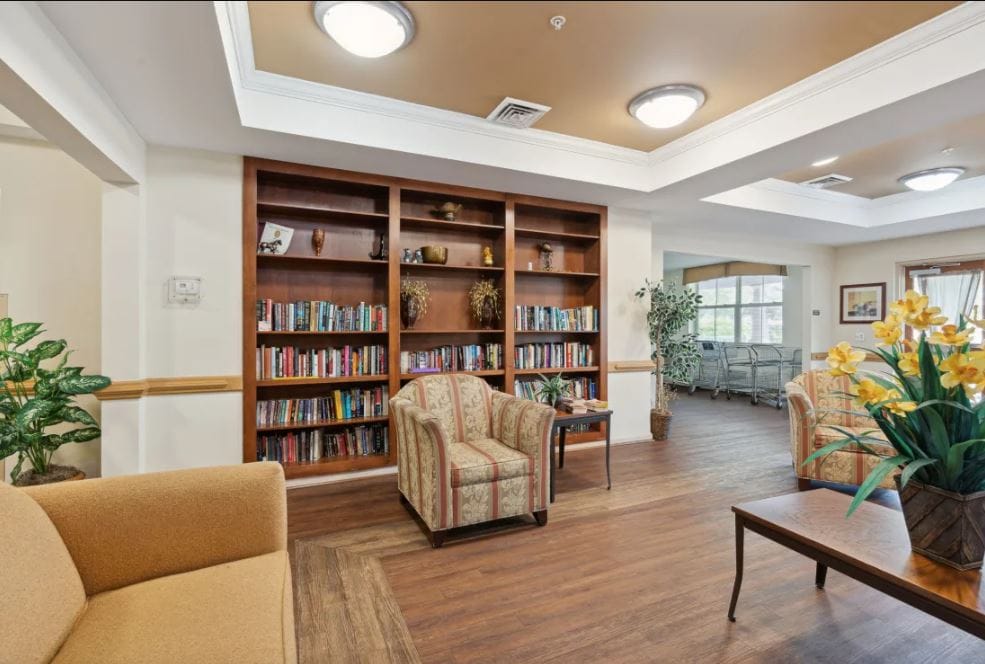
Ednor Apartments II is a senior living community located in a tranquil neighborhood, offering a comfortable and supportive environment for older adults seeking an independent lifestyle. The apartments are designed with seniors in mind, featuring spacious layouts, modern amenities, and convenient accessibility options. Residents can enjoy a range of on-site services and activities tailored to their needs and interests, including fitness classes, social gatherings, and cultural outings.
With a dedicated staff available around the clock, residents can feel secure and receive assistance whenever necessary. Ednor Apartments II strives to foster a vibrant community where seniors can maintain their independence while having access to support and care as needed.
Overview of Brooke Grove Retirement Village

ASSISTED LIVING AT BROOKEGROVE
NURTURING FREEDOM OF MOVEMENT, OF CHOICE, OF SELF-DISCOVERY
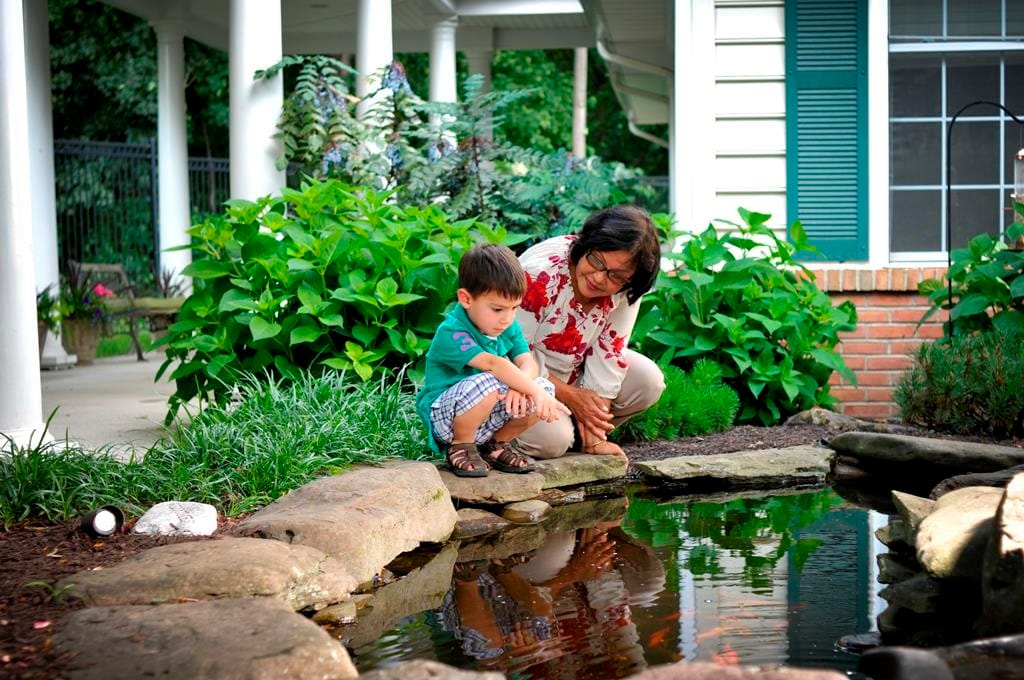
Nothing says “home” like a beloved pet greeting you … the aroma of baking brownies … the sound of a child laughing … and the many other comforting touches you’ll find in The Meadows and The Woods assisted living residences at Brooke Grove Retirement Village . Here, on a pastoral retreat in a convenient Montgomery County, Maryland, location, skilled assistance blends seamlessly with the welcome feeling of home.
… BECAUSE WHAT SURROUNDS YOU REALLY MATTERS.
AN INNOVATIVE APPROACH TO ASSISTED LIVING
Specifically designed for assisted living or memory support, each residential-style dwelling is home to only 16 residents. Over-sized windows and skylights allow natural light to warm and brighten each room. Community members gather in family rooms with fireplaces and pianos, game and craft rooms, intimate dining rooms and sunny decks.
Everything at Brooke Grove is intentionally designed to enhance lives. We do this through LIFE ® principles and programming we’ve developed to create the cheerful atmosphere, opportunities for individual discovery, partnership with families and enriching experiences that set us apart.
At Brooke Grove, safety and security are paramount but not confining. With easy access to large courtyards, residents move freely inside and out, visiting our neighborhood homes, strolling winding paths, and enjoying our peaceful wooded setting. An ornamental Koi pond, flower and sensory gardens, and a playground for visiting children charm and entertain.
Those who live here continue to grow and learn, to participate in lifelong hobbies and explore new ones, to love and care for one another, and to feel a sense of purpose with each new day.
ASSISTED LIVING AMENITIES & SERVICES
Five different residential-style homes with secure and stimulating environments that promote independence and choice
24-hour licensed, professional staff
Assistance with daily living tasks such as dressing, bathing, eating and taking medications
Specially trained staff educated in assisting people with memory loss
Spacious, private rooms with sitting areas and private baths (some efficiencies available)
Three wholesome meals a day with delicious options
Innovative LIFE® enrichment programming with meaningful activities and off-site excursions
Access to outdoor gardens, walking paths and fish pond
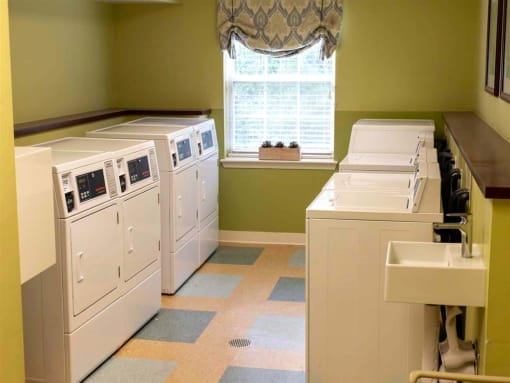
Linen, laundry and housekeeping services
Occupational, physical and speech therapies
Chaplaincy services and spiritual programs for all faiths
Priority access to Brooke Grove’s rehabilitation and long-term care
Respite care to offer family members a break or a chance to experience Brooke Grove on a trial basis
Full-time, licensed social worker
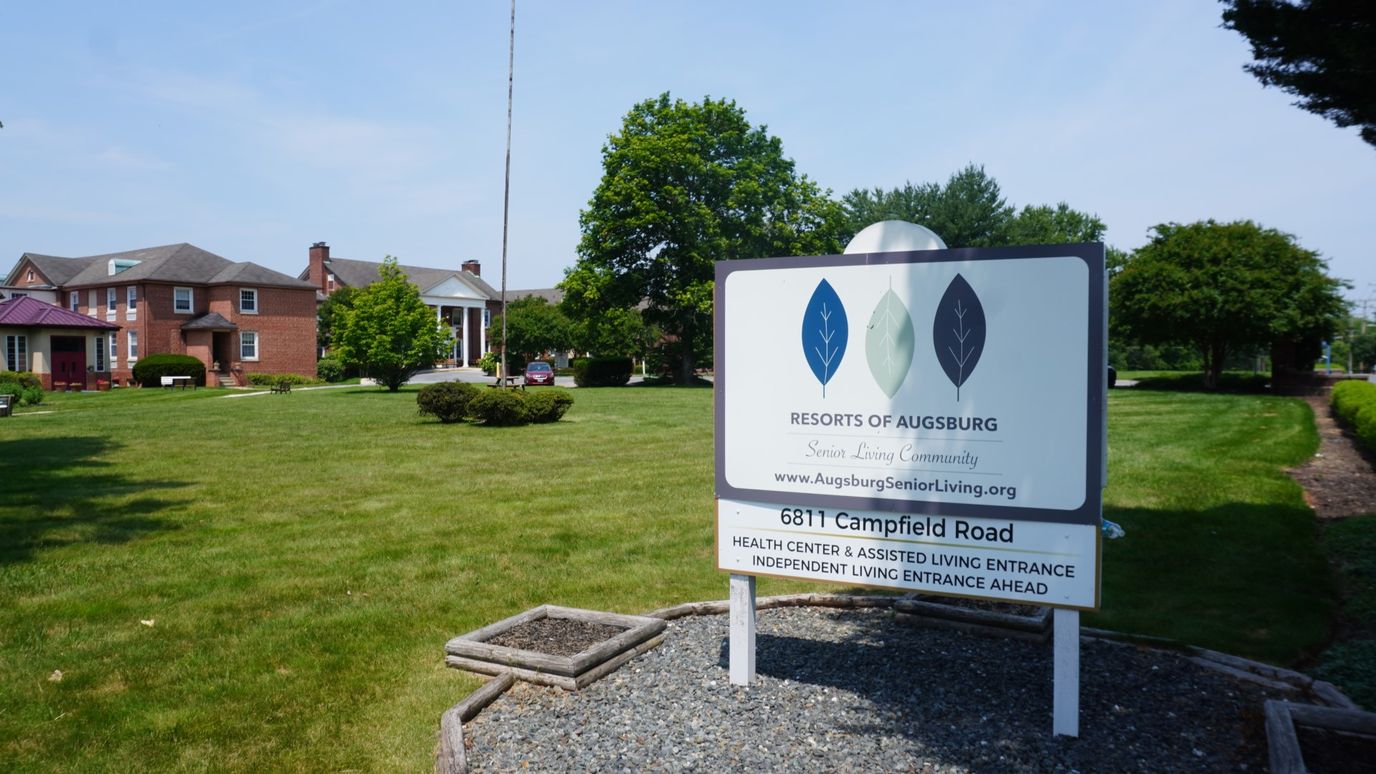
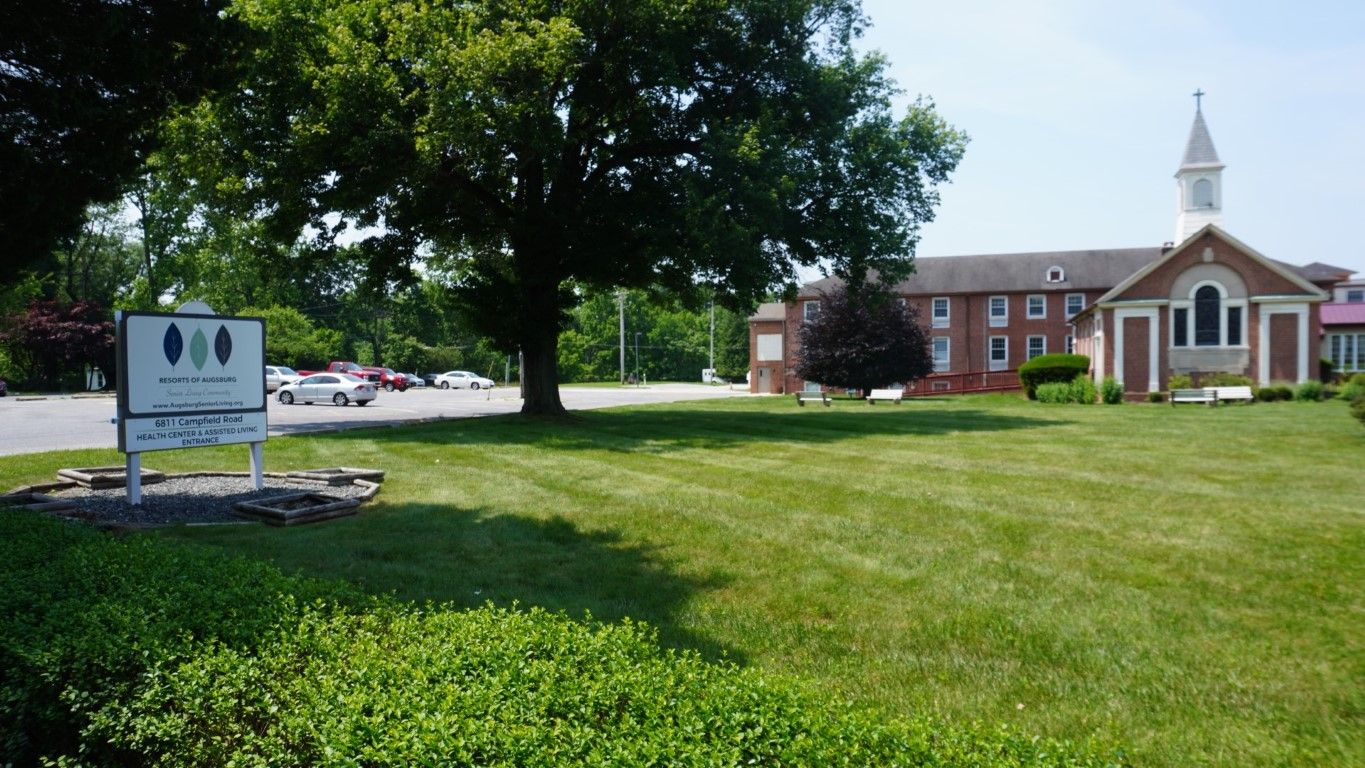
Augsburg Senior Living, located in the Baltimore, Maryland area, has been serving older adults for over 100 years. The community offers a range of living options, including independent living, assisted living, skilled nursing, and short-term rehabilitation, providing a seamless continuum of care as residents’ needs change. Augsburg’s mission is centered on cultivating a vibrant and caring environment where seniors can age gracefully. The community prioritizes respect, independence, compassion, and quality of life, fostering an inclusive atmosphere where residents feel valued, secure, and at home.
Augsburg’s comprehensive services and amenities are designed to enhance the overall living experience, with features like restaurant-style dining, fitness facilities, outdoor courtyards, and a variety of social and recreational activities. Whether residents require independent living, assisted living, or skilled nursing care, Augsburg is committed to delivering exceptional, personalized care that adapts to their changing needs. The community’s dedicated team works to create a supportive, nurturing environment that promotes the well-being, dignity, and satisfaction of every resident.
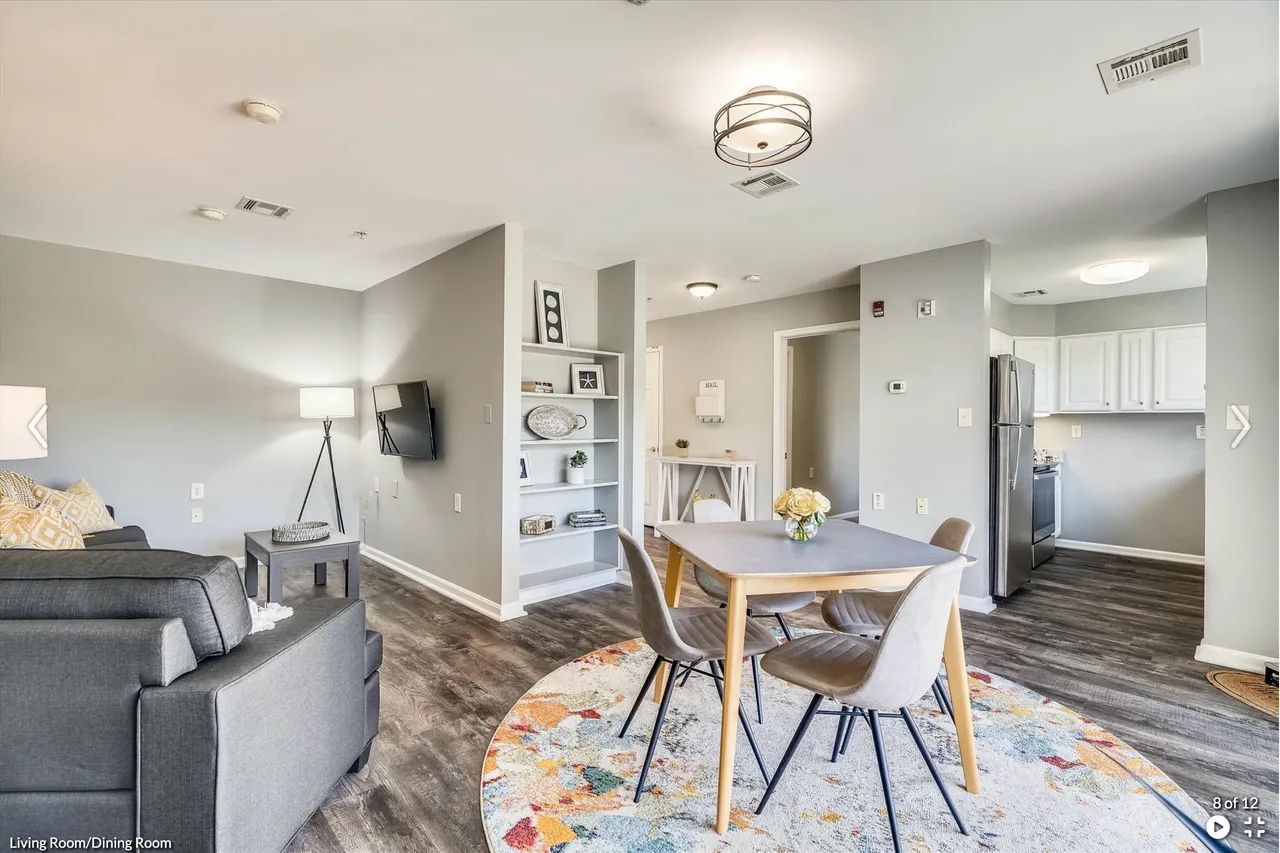
Heritage at Augsburg, located in Baltimore, Maryland, offers unbeatable senior apartments that allow residents to embrace their authentic selves within a kind, caring, and supportive community. The independent living neighborhoods provide the gift of independence, with private residences featuring abundant natural light, ample storage, and a warm, welcoming design. Residents enjoy the freedom to learn, grow, and enjoy all that life has to offer, with the security of having access to higher levels of care, such as assisted living and the on-site health center, should their needs change.
The community’s promise is to foster a caring environment with exciting activities and a comprehensive suite of services and amenities, including full kitchens, private patios or balconies, 24-hour emergency response, and scheduled transportation. Heritage at Augsburg is committed to helping seniors flourish, providing a comfortable and supportive community where they can live their authentic lives. With a focus on independence, security, and enrichment, the community offers an unbeatable senior living experience in Baltimore.
Ranking Methodology
How we rank these independent living communities
Every community above is evaluated across six weighted categories using public data including state inspection records, review platforms, BBB profiles, and operator-published materials.
Weighting overview
- 35%Resident Experience
- 25%Regulatory
- 15%Visual Media
- 10%Website
- 10%Stability
- 5%Environment
01
Resident & Family Experience 35%
The single largest share of every ranking. Aggregated review sentiment and volume from major platforms — the closest signal to real resident experience.
- Includes
- Review Sentiment
- Review Volume
02
Regulatory & Safety Record 25%
State inspection records, citations, and complaint visits. We weight per-inspection rates more heavily than raw counts.
- Includes
- State Inspections
- Citations/Inspection
- % Inspections w/ Citations
- Complaint Visits
- Accreditations
- BBB Rating
03
Visual Media & Transparency 15%
Communities that publish high-quality visuals give families a real preview. No photos or tours = a negative transparency signal.
- Includes
- Video Tours
- Virtual Walkthroughs
- Photo Quantity
- Photo Quality
04
Website & Operator Transparency 10%
Site quality and whether the operator publishes basic accountability information — staff names, contact details, ownership.
- Includes
- Website Content
- Mobile Usability
- Staff Info Available
- Owner Info Available
05
Community Stability 10%
Operational signals indicating whether a community is well-run and meeting demand.
- Includes
- Occupancy Rate
- Bed Options
06
Environment & Pricing 5%
Walkability and pricing transparency. Walk Score is weighted higher for Independent Living than for Memory Care, where most residents do not leave unaccompanied.
- Includes
- Walk Score
- Pricing Transparency
Who we are
Your Senior Care Partner, Every Step of the Way
We help families find affordable senior communities and unlock same day discounts, Medicaid, and Medicare options tailored to your needs.
Contact us Today
Frequently Asked Questions about Independent Living in Maryland
What is independent living?
Independent living communities are residential settings for active older adults — typically with private apartments or cottages, shared amenities (dining, fitness, activities), and no built-in medical care.
How many independent living communities are listed on this page?
This page features 164 independent living communities in Maryland. Use the filters and comparison tools above to compare ratings, amenities, and pricing.
How do I choose the right independent living community in Maryland?
Start by matching the level of care offered to the resident's current and anticipated needs, then compare licensing status, staff-to-resident ratios, recent inspection results, and pricing. Tour at least two or three communities in Maryland, talk to current residents and families, and confirm what is included in the base rate versus billed as add-on services.
What should I look for when visiting independent living communities in Maryland?
Pay attention to staff interactions with residents, cleanliness and odor, food quality at meal times, the activity calendar, and how questions about pricing and care plans are answered. Ask to see the most recent state inspection report, the move-out / level-of-care-change policy, and a sample monthly bill that lists every fee.
Updated on
