


Where in Maryland are you looking?
Browse communities by city.
Compare Independent Living around Maryland
| Edenwald Senior Living | IL AL MC NH SNF | Towson (Southerly Road) | 94
Facility
94
MD AVG
43
Rank
#144 / 690 | No |
83
Facility
83
MD AVG
43
Rank
#70 / 985 | 1 Bed / 2 Bed | - | A+ |
18% Male Residents — State Benchmarked 18% of residents are male, compared to the Maryland average of 31%. This facility caters to a majority female resident pool (82% female), consistent with the broader assisted living trend where women significantly outnumber men. |
82% Female Residents — State Benchmarked 82% of residents are female, compared to the Maryland average of 69%. Women comprise the large majority, consistent with national assisted living demographics where women live longer and enter care facilities at higher rates. |
100% White Residents — State Benchmarked 100% of residents are reported as White, compared to the Maryland average of 81%. A higher White share than is typical for assisted living in Maryland in this dataset — compare with peer facilities for local context. |
0% African American Residents — State Benchmarked 0% of residents are reported as African American or Black, compared to the Maryland average of 13%. A lower African American share than is typical in Maryland; local markets still vary widely. |
0% Other Ethnicity Residents — State Benchmarked 0% of residents fall into categories other than White or African American (combined), compared to the Maryland average of 6%. This column aggregates Hispanic, Asian, multiracial, and any other labeled groups that are not classified as White or African American. | - |
13% Residents Age 75–84 — State Benchmarked 13% of residents are 75–84, compared to the Maryland average of 31%. Below the state norm — the resident mix may skew either younger or older than this typical middle bracket. |
53% Residents Age 85–94 — State Benchmarked 53% of residents are 85–94, compared to the Maryland average of 44%. A high concentration of very elderly residents signals a higher-acuity facility with experience caring for advanced age-related needs. |
35% Residents Age 95+ — State Benchmarked 35% of residents are 95 or older, compared to the Maryland average of 16%. A high proportion of the oldest-old suggests strong end-of-life care experience and very-high-acuity capabilities. |
| Homewood Living Frederick | IL AL MC NH SNF | Frederick | 120
Facility
120
MD AVG
43
Rank
#76 / 690 | Yes |
14
Facility
14
MD AVG
43
Rank
#788 / 985 | 1 Bed / 2 Bed | - | - | - | - | - | - | - | - | - | - | - |
| Ingleside at King Farm | IL AL MC NH SNF | Rockville (King Farm) | 45
Facility
45
MD AVG
43
Rank
#226 / 690 | Yes |
73
Facility
73
MD AVG
43
Rank
#152 / 985 | 1 Bed / 2 Bed | - | - | - | - | - | - | - | - | - | - | - |
| Bedford Court, a CCRC | IL AL HOS MC NH RC SNF | Silver Spring (International Drive) | 76
Facility
76
MD AVG
43
Rank
#179 / 690 | Yes |
64
Facility
64
MD AVG
43
Rank
#261 / 985 | Studio / 1 Bed | 34
Facility
34
MD AVG
21
Rank
#22 / 210 | - |
15% Male Residents — State Benchmarked 15% of residents are male, compared to the Maryland average of 31%. This facility caters to a majority female resident pool (85% female), consistent with the broader assisted living trend where women significantly outnumber men. |
85% Female Residents — State Benchmarked 85% of residents are female, compared to the Maryland average of 69%. Women comprise the large majority, consistent with national assisted living demographics where women live longer and enter care facilities at higher rates. |
95% White Residents — State Benchmarked 95% of residents are reported as White, compared to the Maryland average of 81%. A higher White share than is typical for assisted living in Maryland in this dataset — compare with peer facilities for local context. |
3% African American Residents — State Benchmarked 3% of residents are reported as African American or Black, compared to the Maryland average of 13%. A lower African American share than is typical in Maryland; local markets still vary widely. |
2% Other Ethnicity Residents — State Benchmarked 2% of residents fall into categories other than White or African American (combined), compared to the Maryland average of 6%. This column aggregates Hispanic, Asian, multiracial, and any other labeled groups that are not classified as White or African American. Reported subgroups in this total: Asian (2%). |
2% Residents Age 65–74 — State Benchmarked 2% of residents are 65–74, compared to the Maryland average of 13%. Fewer younger seniors suggests the resident population skews older, likely requiring higher acuity care and more hands-on support. |
8% Residents Age 75–84 — State Benchmarked 8% of residents are 75–84, compared to the Maryland average of 31%. Below the state norm — the resident mix may skew either younger or older than this typical middle bracket. |
65% Residents Age 85–94 — State Benchmarked 65% of residents are 85–94, compared to the Maryland average of 44%. A high concentration of very elderly residents signals a higher-acuity facility with experience caring for advanced age-related needs. |
26% Residents Age 95+ — State Benchmarked 26% of residents are 95 or older, compared to the Maryland average of 16%. A high proportion of the oldest-old suggests strong end-of-life care experience and very-high-acuity capabilities. |
| Lutheran Village at Miller’s Grant | IL AL NH SNF | Ellicott City (Lutheran Village At Miller’s Grant) | 36
Facility
36
MD AVG
43
Rank
#237 / 690 | Yes |
19
Facility
19
MD AVG
43
Rank
#746 / 985 | 1 Bed / 2 Bed | 21
Facility
21
MD AVG
21
Rank
#108 / 210 | - |
17% Male Residents — State Benchmarked 17% of residents are male, compared to the Maryland average of 31%. This facility caters to a majority female resident pool (83% female), consistent with the broader assisted living trend where women significantly outnumber men. |
83% Female Residents — State Benchmarked 83% of residents are female, compared to the Maryland average of 69%. Women comprise the large majority, consistent with national assisted living demographics where women live longer and enter care facilities at higher rates. |
83% White Residents — State Benchmarked 83% of residents are reported as White, compared to the Maryland average of 81%. Close to the average for this category among assisted living facilities in Maryland with reported race/ethnicity data. |
11% African American Residents — State Benchmarked 11% of residents are reported as African American or Black, compared to the Maryland average of 13%. In line with the Maryland average for African American residents among facilities reporting this breakdown. |
6% Other Ethnicity Residents — State Benchmarked 6% of residents fall into categories other than White or African American (combined), compared to the Maryland average of 6%. This column aggregates Hispanic, Asian, multiracial, and any other labeled groups that are not classified as White or African American. Reported subgroups in this total: Asian (6%). | - |
33% Residents Age 75–84 — State Benchmarked 33% of residents are 75–84, compared to the Maryland average of 31%. This is the second most common age bracket in assisted living, representing residents with moderate care needs. |
44% Residents Age 85–94 — State Benchmarked 44% of residents are 85–94, compared to the Maryland average of 44%. This is typically the most common age bracket in assisted living — this facility is in line with the statewide norm. |
22% Residents Age 95+ — State Benchmarked 22% of residents are 95 or older, compared to the Maryland average of 16%. A high proportion of the oldest-old suggests strong end-of-life care experience and very-high-acuity capabilities. |
| Residences at Vantage Point | IL AL HC MC NH SNF | Columbia (Town Center) | 44
Facility
44
MD AVG
43
Rank
#229 / 690 | Yes |
52
Facility
52
MD AVG
43
Rank
#402 / 985 | Studio / 1 Bed / 2 Bed | 36
Facility
36
MD AVG
21
Rank
#16 / 210 | - | - | - | - | - | - | - | - | - | - |
| Maplewood Park Place | IL AL MC NH SNF | Bethesda (Pooks Hill) | 29
Facility
29
MD AVG
43
Rank
#247 / 690 | Yes |
38
Facility
38
MD AVG
43
Rank
#542 / 985 | 1 Bed / 2 Bed | 30
Facility
30
MD AVG
21
Rank
#44 / 210 | - |
18% Male Residents — State Benchmarked 18% of residents are male, compared to the Maryland average of 31%. This facility caters to a majority female resident pool (82% female), consistent with the broader assisted living trend where women significantly outnumber men. |
82% Female Residents — State Benchmarked 82% of residents are female, compared to the Maryland average of 69%. Women comprise the large majority, consistent with national assisted living demographics where women live longer and enter care facilities at higher rates. |
100% White Residents — State Benchmarked 100% of residents are reported as White, compared to the Maryland average of 81%. A higher White share than is typical for assisted living in Maryland in this dataset — compare with peer facilities for local context. |
0% African American Residents — State Benchmarked 0% of residents are reported as African American or Black, compared to the Maryland average of 13%. A lower African American share than is typical in Maryland; local markets still vary widely. |
0% Other Ethnicity Residents — State Benchmarked 0% of residents fall into categories other than White or African American (combined), compared to the Maryland average of 6%. This column aggregates Hispanic, Asian, multiracial, and any other labeled groups that are not classified as White or African American. | - |
6% Residents Age 75–84 — State Benchmarked 6% of residents are 75–84, compared to the Maryland average of 31%. Below the state norm — the resident mix may skew either younger or older than this typical middle bracket. |
24% Residents Age 85–94 — State Benchmarked 24% of residents are 85–94, compared to the Maryland average of 44%. The population here skews younger than the statewide norm, which may indicate a more active, lower-acuity community. |
71% Residents Age 95+ — State Benchmarked 71% of residents are 95 or older, compared to the Maryland average of 16%. A high proportion of the oldest-old suggests strong end-of-life care experience and very-high-acuity capabilities. |
| Friends House Retirement Community | IL AL NH SNF | Sandy Spring | 24
Facility
24
MD AVG
43
Rank
#249 / 690 | No |
6
Facility
6
MD AVG
43
Rank
#891 / 985 | - | 20
Facility
20
MD AVG
21
Rank
#112 / 210 | - |
6% Male Residents — State Benchmarked 6% of residents are male, compared to the Maryland average of 31%. This facility caters to a majority female resident pool (94% female), consistent with the broader assisted living trend where women significantly outnumber men. |
94% Female Residents — State Benchmarked 94% of residents are female, compared to the Maryland average of 69%. Women comprise the large majority, consistent with national assisted living demographics where women live longer and enter care facilities at higher rates. |
94% White Residents — State Benchmarked 94% of residents are reported as White, compared to the Maryland average of 81%. A higher White share than is typical for assisted living in Maryland in this dataset — compare with peer facilities for local context. |
0% African American Residents — State Benchmarked 0% of residents are reported as African American or Black, compared to the Maryland average of 13%. A lower African American share than is typical in Maryland; local markets still vary widely. |
6% Other Ethnicity Residents — State Benchmarked 6% of residents fall into categories other than White or African American (combined), compared to the Maryland average of 6%. This column aggregates Hispanic, Asian, multiracial, and any other labeled groups that are not classified as White or African American. Reported subgroups in this total: Asian (6%). |
6% Residents Age 65–74 — State Benchmarked 6% of residents are 65–74, compared to the Maryland average of 13%. Fewer younger seniors suggests the resident population skews older, likely requiring higher acuity care and more hands-on support. |
18% Residents Age 75–84 — State Benchmarked 18% of residents are 75–84, compared to the Maryland average of 31%. Below the state norm — the resident mix may skew either younger or older than this typical middle bracket. |
53% Residents Age 85–94 — State Benchmarked 53% of residents are 85–94, compared to the Maryland average of 44%. A high concentration of very elderly residents signals a higher-acuity facility with experience caring for advanced age-related needs. |
24% Residents Age 95+ — State Benchmarked 24% of residents are 95 or older, compared to the Maryland average of 16%. A high proportion of the oldest-old suggests strong end-of-life care experience and very-high-acuity capabilities. |
| Revitz House | IL AL HC MC NH SNF | Rockville | 558
Facility
558
MD AVG
43
Rank
#1 / 690 | Yes |
81
Facility
81
MD AVG
43
Rank
#86 / 985 | 1 Bed | - | - | - | - | - | - | - | - | - | - | - |
| Broadmead | IL AL MC NH RC SNF | Cockeysville | 40
Facility
40
MD AVG
43
Rank
#233 / 690 | No |
0
Facility
0
MD AVG
43
Rank
#959 / 985 | - | 47
Facility
47
MD AVG
21
Rank
#3 / 210 | A+ | - | - | - | - | - | - | - | - | - |
| Blakehurst (Chestnut Green) | IL AL MC NH SNF | Towson | 35
Facility
35
MD AVG
43
Rank
#239 / 690 | No |
10
Facility
10
MD AVG
43
Rank
#837 / 985 | - | 33
Facility
33
MD AVG
21
Rank
#25 / 210 | - | - | - | - | - | - | - | - | - | - |
| Asbury Methodist Village | IL AL MC NH SNF | Gaithersburg (Russell Avenue) | 164
Facility
164
MD AVG
43
Rank
#26 / 690 | Yes |
41
Facility
41
MD AVG
43
Rank
#508 / 985 | - | 27
Facility
27
MD AVG
21
Rank
#62 / 210 | - |
21% Male Residents — State Benchmarked 21% of residents are male, compared to the Maryland average of 31%. This facility caters to a majority female resident pool (79% female), consistent with the broader assisted living trend where women significantly outnumber men. |
79% Female Residents — State Benchmarked 79% of residents are female, compared to the Maryland average of 69%. Women comprise the large majority, consistent with national assisted living demographics where women live longer and enter care facilities at higher rates. |
92% White Residents — State Benchmarked 92% of residents are reported as White, compared to the Maryland average of 81%. A higher White share than is typical for assisted living in Maryland in this dataset — compare with peer facilities for local context. |
1% African American Residents — State Benchmarked 1% of residents are reported as African American or Black, compared to the Maryland average of 13%. A lower African American share than is typical in Maryland; local markets still vary widely. |
7% Other Ethnicity Residents — State Benchmarked 7% of residents fall into categories other than White or African American (combined), compared to the Maryland average of 6%. This column aggregates Hispanic, Asian, multiracial, and any other labeled groups that are not classified as White or African American. Reported subgroups in this total: Asian (7%). |
1% Residents Age 65–74 — State Benchmarked 1% of residents are 65–74, compared to the Maryland average of 13%. Fewer younger seniors suggests the resident population skews older, likely requiring higher acuity care and more hands-on support. |
21% Residents Age 75–84 — State Benchmarked 21% of residents are 75–84, compared to the Maryland average of 31%. Below the state norm — the resident mix may skew either younger or older than this typical middle bracket. |
48% Residents Age 85–94 — State Benchmarked 48% of residents are 85–94, compared to the Maryland average of 44%. This is typically the most common age bracket in assisted living — this facility is in line with the statewide norm. |
30% Residents Age 95+ — State Benchmarked 30% of residents are 95 or older, compared to the Maryland average of 16%. A high proportion of the oldest-old suggests strong end-of-life care experience and very-high-acuity capabilities. |
| Ginger Cove | IL AL HC MC NH SNF | Annapolis (River Crescent Drive) | 96
Facility
96
MD AVG
43
Rank
#136 / 690 | No |
51
Facility
51
MD AVG
43
Rank
#413 / 985 | 1 Bed / 2 Bed | 42
Facility
42
MD AVG
21
Rank
#8 / 210 | A+ |
40% Male Residents — State Benchmarked 40% of residents are male, compared to the Maryland average of 31%. A relatively balanced gender mix for assisted living, where facilities typically skew heavily female. |
60% Female Residents — State Benchmarked 60% of residents are female, compared to the Maryland average of 69%. Closer to an even gender split than most assisted living facilities, which typically have 65–75% female residents. |
100% White Residents — State Benchmarked 100% of residents are reported as White, compared to the Maryland average of 81%. A higher White share than is typical for assisted living in Maryland in this dataset — compare with peer facilities for local context. |
0% African American Residents — State Benchmarked 0% of residents are reported as African American or Black, compared to the Maryland average of 13%. A lower African American share than is typical in Maryland; local markets still vary widely. |
0% Other Ethnicity Residents — State Benchmarked 0% of residents fall into categories other than White or African American (combined), compared to the Maryland average of 6%. This column aggregates Hispanic, Asian, multiracial, and any other labeled groups that are not classified as White or African American. | - |
13% Residents Age 75–84 — State Benchmarked 13% of residents are 75–84, compared to the Maryland average of 31%. Below the state norm — the resident mix may skew either younger or older than this typical middle bracket. |
64% Residents Age 85–94 — State Benchmarked 64% of residents are 85–94, compared to the Maryland average of 44%. A high concentration of very elderly residents signals a higher-acuity facility with experience caring for advanced age-related needs. |
22% Residents Age 95+ — State Benchmarked 22% of residents are 95 or older, compared to the Maryland average of 16%. A high proportion of the oldest-old suggests strong end-of-life care experience and very-high-acuity capabilities. |
| Charlestown Community | IL NH | Baltimore | 238
Facility
238
MD AVG
43
Rank
#5 / 690 | No |
36
Facility
36
MD AVG
43
Rank
#563 / 985 | - | 35
Facility
35
MD AVG
21
Rank
#18 / 210 | - | - | - | - | - | - | - | - | - | - |
| Pickersgill Retirement Community | IL AL NH SNF | Baltimore (Chestnut Hill) | 138
Facility
138
MD AVG
43
Rank
#56 / 690 | No |
45
Facility
45
MD AVG
43
Rank
#475 / 985 | - | - | A+ |
24% Male Residents — State Benchmarked 24% of residents are male, compared to the Maryland average of 31%. This facility caters to a majority female resident pool (76% female), consistent with the broader assisted living trend where women significantly outnumber men. |
76% Female Residents — State Benchmarked 76% of residents are female, compared to the Maryland average of 69%. Women comprise the large majority, consistent with national assisted living demographics where women live longer and enter care facilities at higher rates. |
95% White Residents — State Benchmarked 95% of residents are reported as White, compared to the Maryland average of 81%. A higher White share than is typical for assisted living in Maryland in this dataset — compare with peer facilities for local context. |
1% African American Residents — State Benchmarked 1% of residents are reported as African American or Black, compared to the Maryland average of 13%. A lower African American share than is typical in Maryland; local markets still vary widely. |
4% Other Ethnicity Residents — State Benchmarked 4% of residents fall into categories other than White or African American (combined), compared to the Maryland average of 6%. This column aggregates Hispanic, Asian, multiracial, and any other labeled groups that are not classified as White or African American. Reported subgroups in this total: Asian (4%). |
3% Residents Age 65–74 — State Benchmarked 3% of residents are 65–74, compared to the Maryland average of 13%. Fewer younger seniors suggests the resident population skews older, likely requiring higher acuity care and more hands-on support. |
27% Residents Age 75–84 — State Benchmarked 27% of residents are 75–84, compared to the Maryland average of 31%. This is the second most common age bracket in assisted living, representing residents with moderate care needs. |
55% Residents Age 85–94 — State Benchmarked 55% of residents are 85–94, compared to the Maryland average of 44%. A high concentration of very elderly residents signals a higher-acuity facility with experience caring for advanced age-related needs. |
15% Residents Age 95+ — State Benchmarked 15% of residents are 95 or older, compared to the Maryland average of 16%. In line with the statewide profile for the oldest resident bracket. |
Rows per page:

View all Nearby Homes
Residing in the welcoming neighborhood of Timonium, MD, the Brightview Mays Chapel Ridge is a distinguished senior living community that provides independent living, assisted living, and memory care services. Beautifully appointed and spacious accommodations with varying floor plans are available for its residents based on their needs. In terms of memory care, this community offers innovative memory care services through its Wellspring Village Neighborhood.
With over 20 years of senior living experience, the community is committed to delivering exceptional amenities and services. Indulge in delightful and healthy chef-prepared meals daily and spend time for self-care by visiting its beauty salon, fitness room, and art studio. Explore its beautifully designed common spaces such as the outdoor gardens. Have fun in its interactive daily programs and activities to further social engagement. With Brightview Mays Chapel Ridge, seniors are guaranteed a glorious living experience.
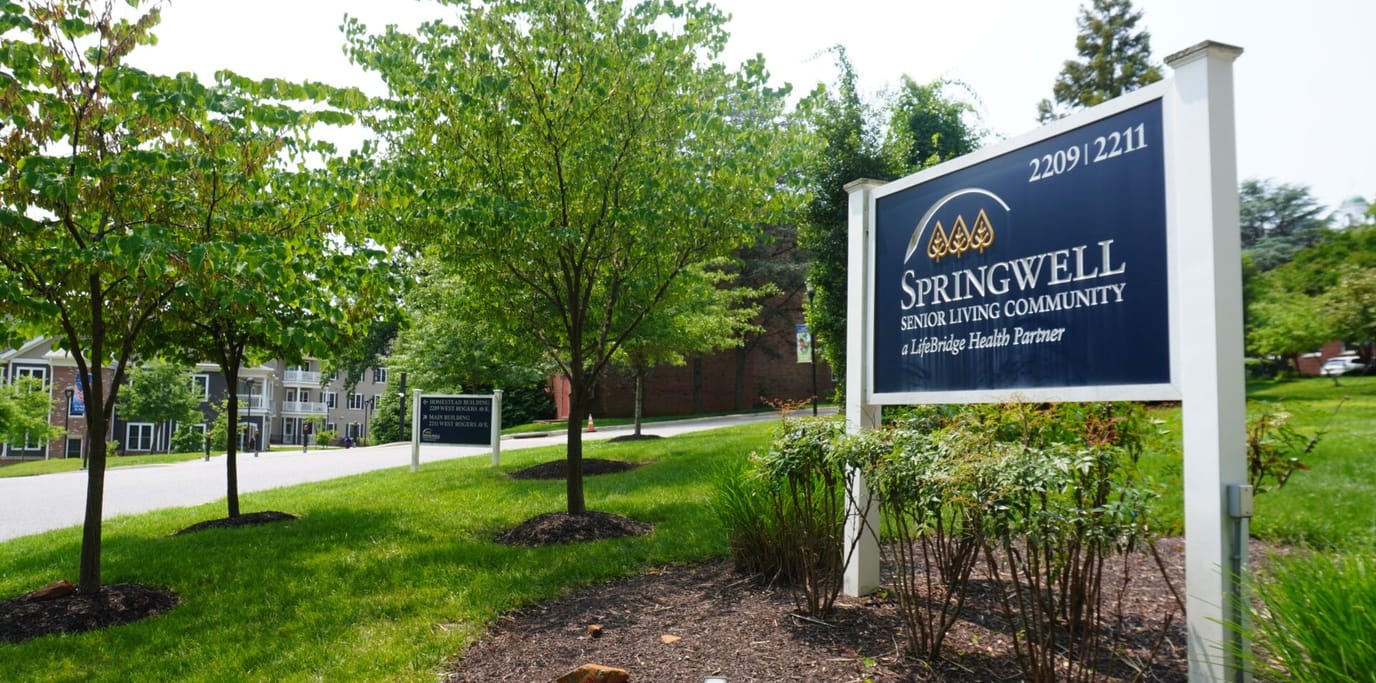
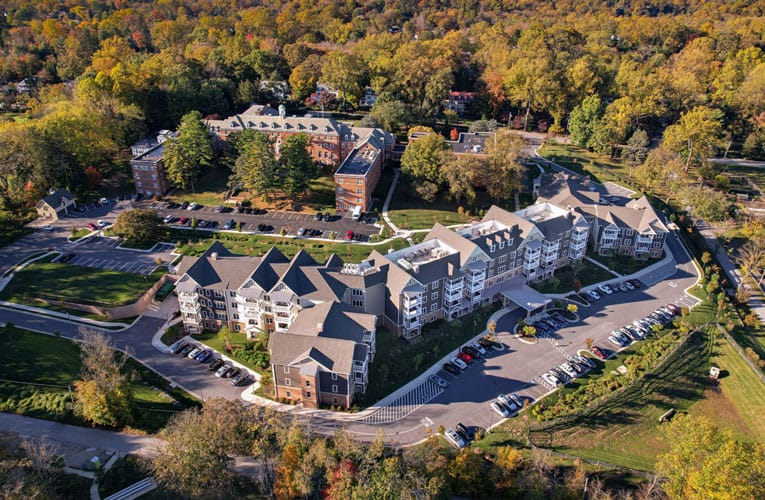
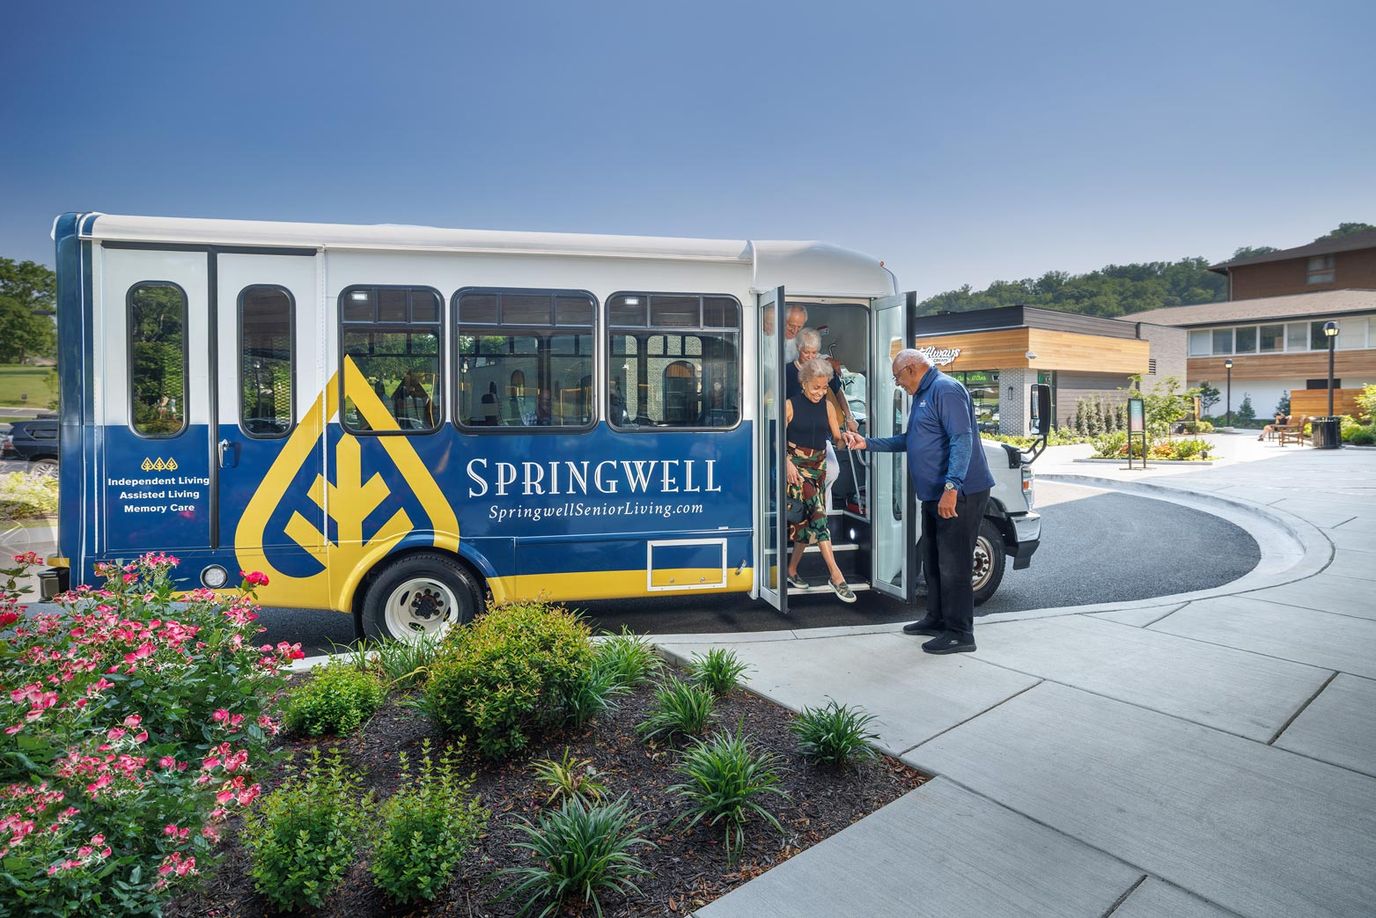
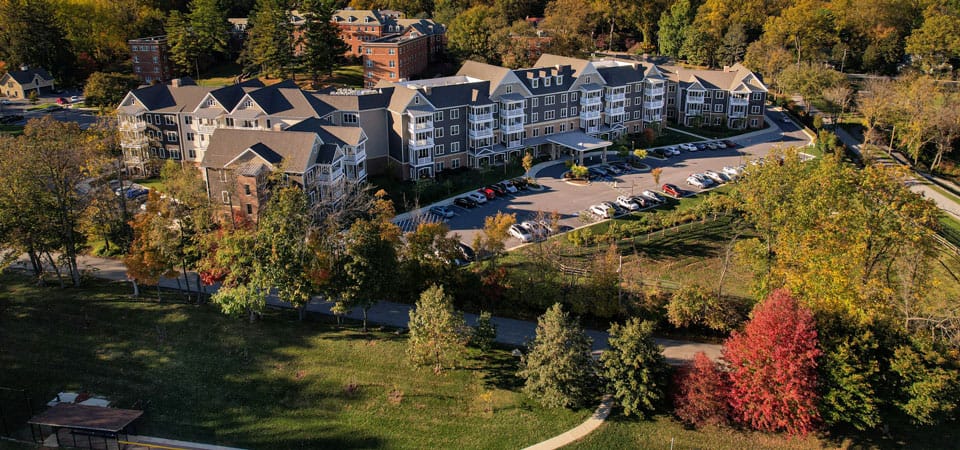
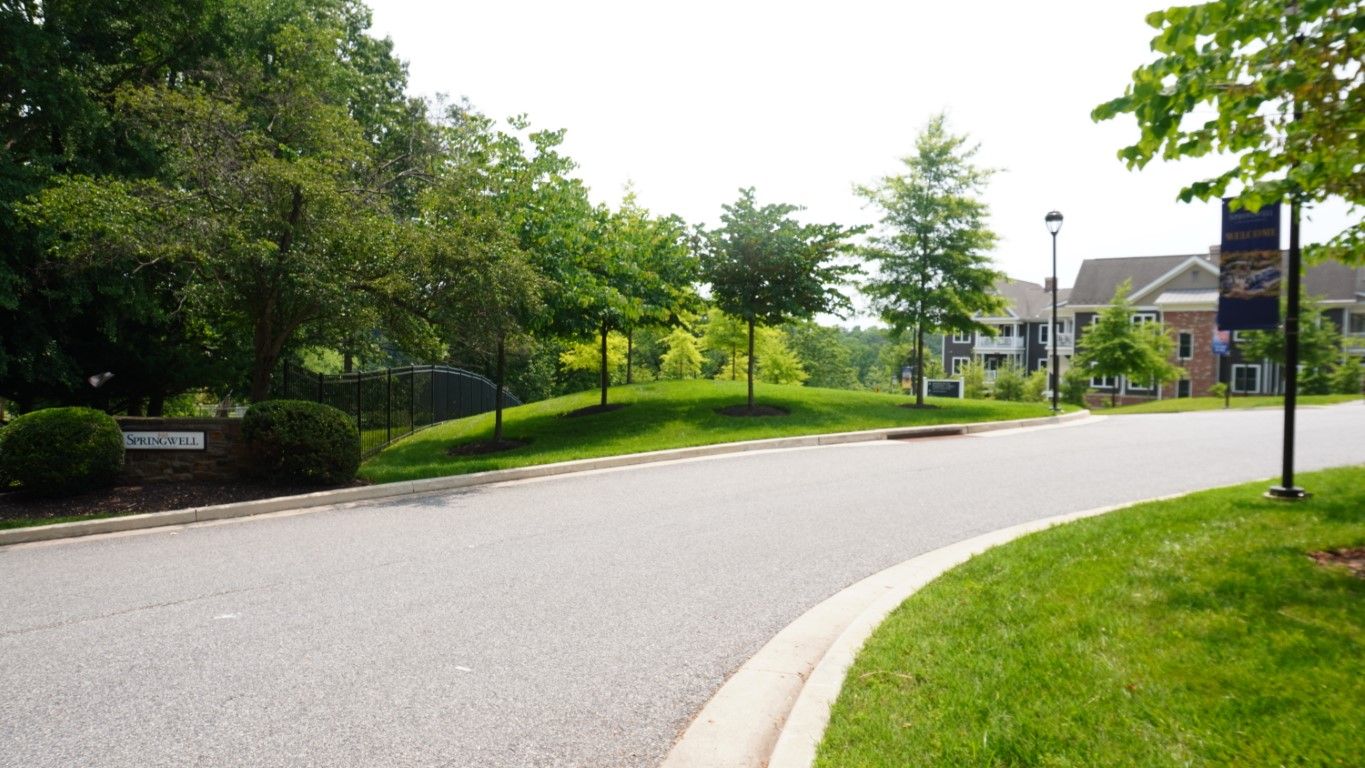
Springwell Senior Living in Baltimore is a community that boasts their warm and welcoming environment so seniors can immediately feel safe and comfortable the moment they walk onto community grounds. The community proudly gives off a motivating atmosphere that is boosted by the elevated state of living they promote and practice; the resort-like hospitality adds to the charm of the senior living community. Springwell is on its way to be one of the best senior living communities in Baltimore– as enhanced by their exclusive Springwell care that is not found anywhere else: elegant and carefree. Springwell Senior Living is anything but ordinary because of its vibrant lifestyle that promotes an exciting and unparalleled quality of care that redefines the luxury quality of living we know today.
Springwell Senior Living has created an array of helpful services and amenities to make the lives of each resident easier and worry-free. All living options of Springswell get seamless access to their amenities and services such as engaging in wellness programs, outings and events, transportation, housekeeping, and laundry services. The assisted living and memory care residents get more specialized services such as medication management and assistance with daily living (bathing, dressing, grooming, etc), and extra help with the housekeeping and meals provided. As their name suggests, security is included in their top priority, which is why they have provided a 24-hour emergency call system in the building and emergency pendant with GPS. Visitation is open anytime but overnight stays are only allowed for independent living residents.
Lakeside at Mallard Landing, situated amidst tranquil, tree-filled surroundings adjacent to Schumaker Pond in Salisbury, Maryland, offers an exceptional senior living experience. This vibrant community caters to seniors seeking assisted living or memory care and those preferring independent living apartment homes.
Featuring flexible living options like one-bedroom and studio apartments, Lakeside at Mallard Landing provides a comfortable haven where seniors can thrive and cultivate cherished memories.
Lakeside at Mallard Landing’s compassionate team, which includes licensed medical professionals, tailors personalized care plans for each resident, ensuring their well-being. Residents relish a harmonious fusion of nurturing care, resort-style amenities, and a tightly-knit community.
Viva Senior Living at Cockeysville
Overview of Viva Senior Living at Cockeysville

“Ideally situated in the harmonious neighborhood of Cockeysville, MD, Viva Senior Living at Cockeysville is a blissful haven that offers assisted living, memory care, and respite care. Committed to residents’ well-being, a compassionate and highly trained team provides top-notch care tailored to their unique needs. Residents feel a sense of belonging with specially designed private and companion suites.
With a jam-packed calendar of fun recreational activities and stimulating programs, residents can live actively and maintain social connections. Delectable and healthy dining options are served to satisfy residents’ dietary needs and preferences. Medication management and transportation services are available for convenience. This pet-friendly community creates the ideal setting for residents to thrive in retirement. “
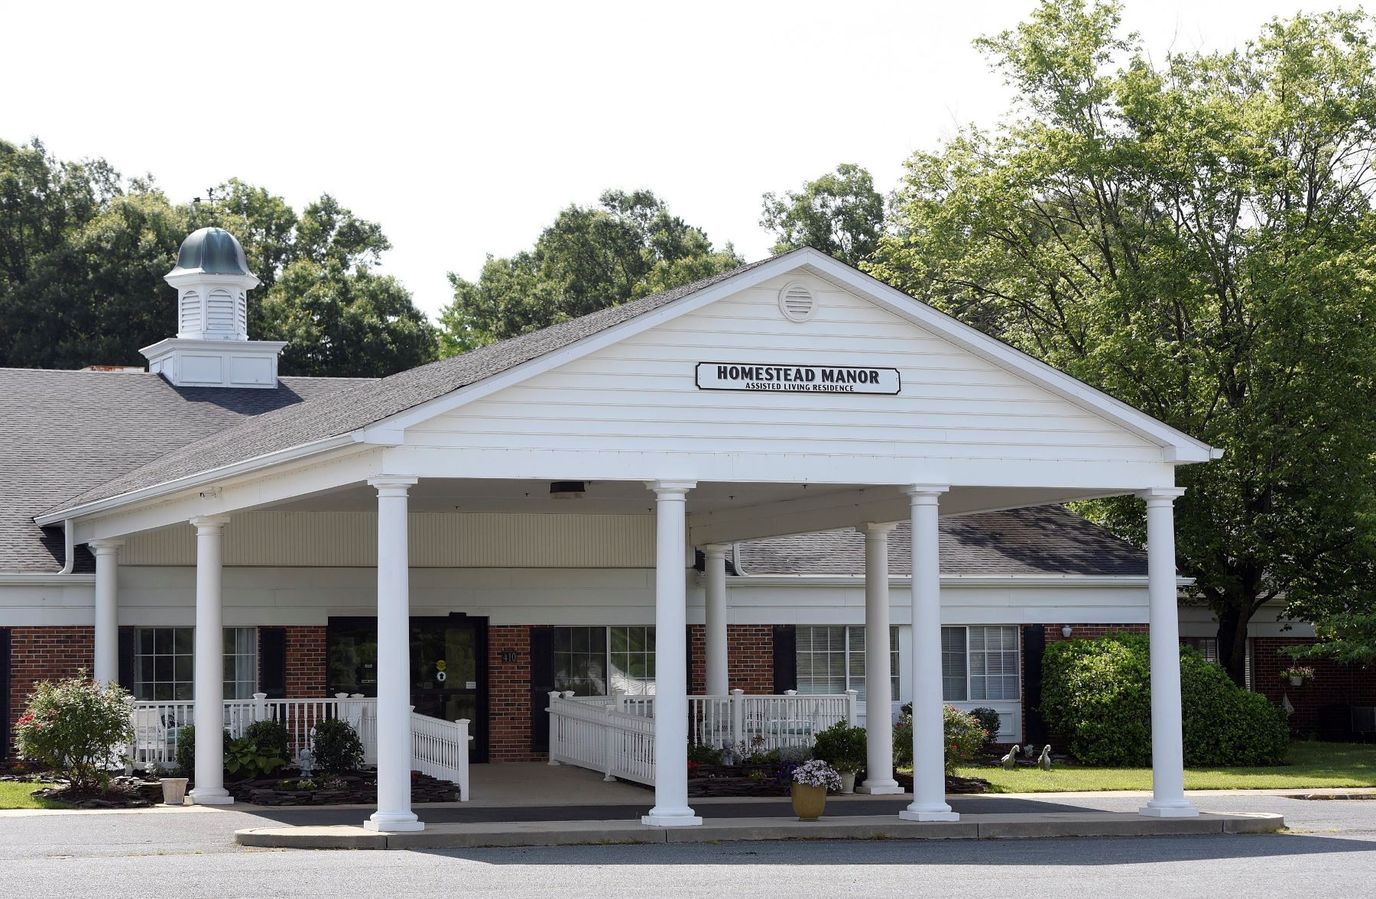
Homestead Manor Assisted Living sits at 410 Colonial Drive in Denton, Maryland, in a neighborhood where a car is essential; a Walk Score of 4 means buses don’t run frequently enough to matter, and neither sidewalks nor shops cluster nearby. That’s real information for families deciding whether location works.
Beds are 78.9% full. That’s below Maryland’s average and means the facility has immediate availability if you’re in a time crunch. The average resident stays about four months, suggesting the community handles both post-acute transitions and longer placements.
Financially, the facility takes Medicare, Medicaid, and private pay, removing one class of barrier to access for families already stressed about care decisions.
On staffing: 2 hours 55 minutes of nursing care per resident daily, plus 3 hours 3 minutes from nursing aides. That breaks down to 10 RNs, 16 LPNs, and 54 CNAs working from a full-time pool of 112 people. The staff-to-resident ratio lands at 1.40 per resident; not matching the state average of 1.81. Staffing levels matter for load management and burnout prevention in residential care, and this facility runs leaner than most comparable Maryland communities.
Homestead Manor serves both nursing home and assisted living residents, positioning itself for medically complex transitions and ongoing nursing-level support in a residential setting.
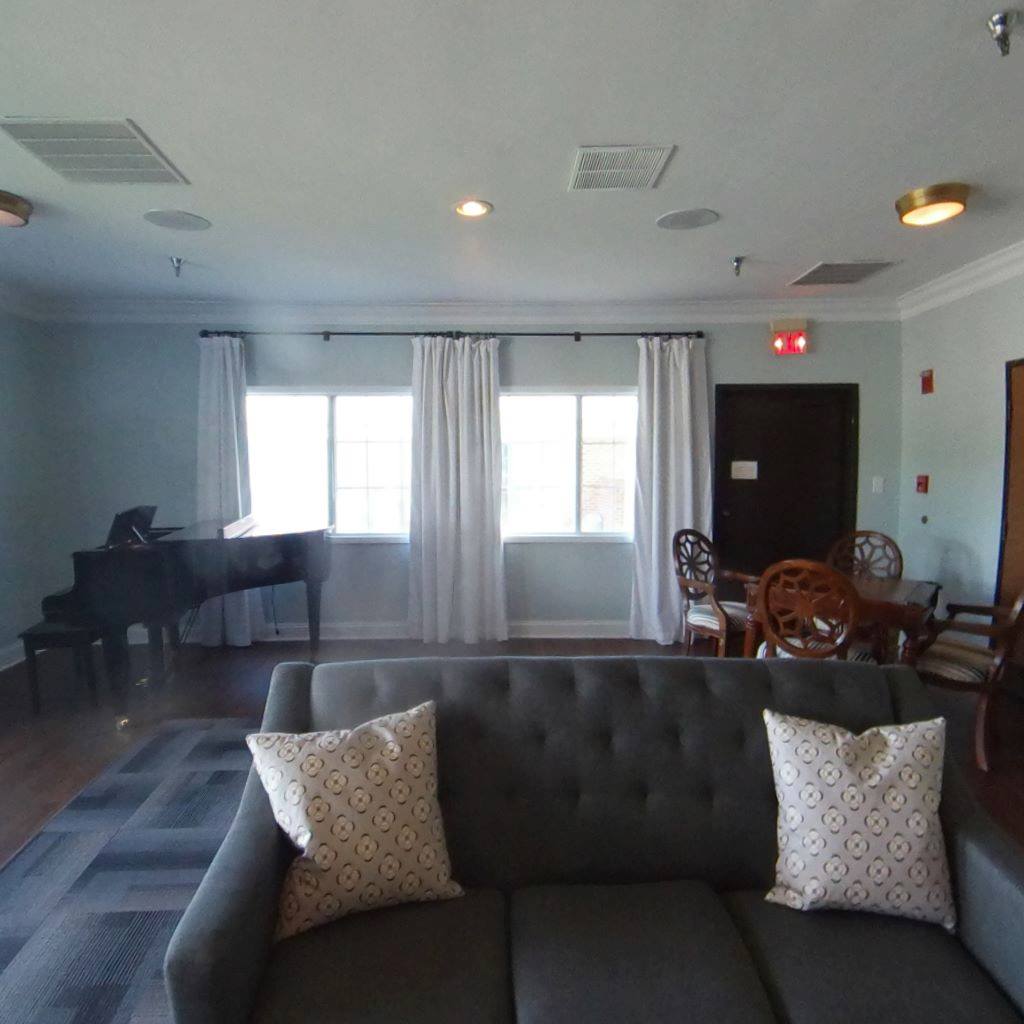
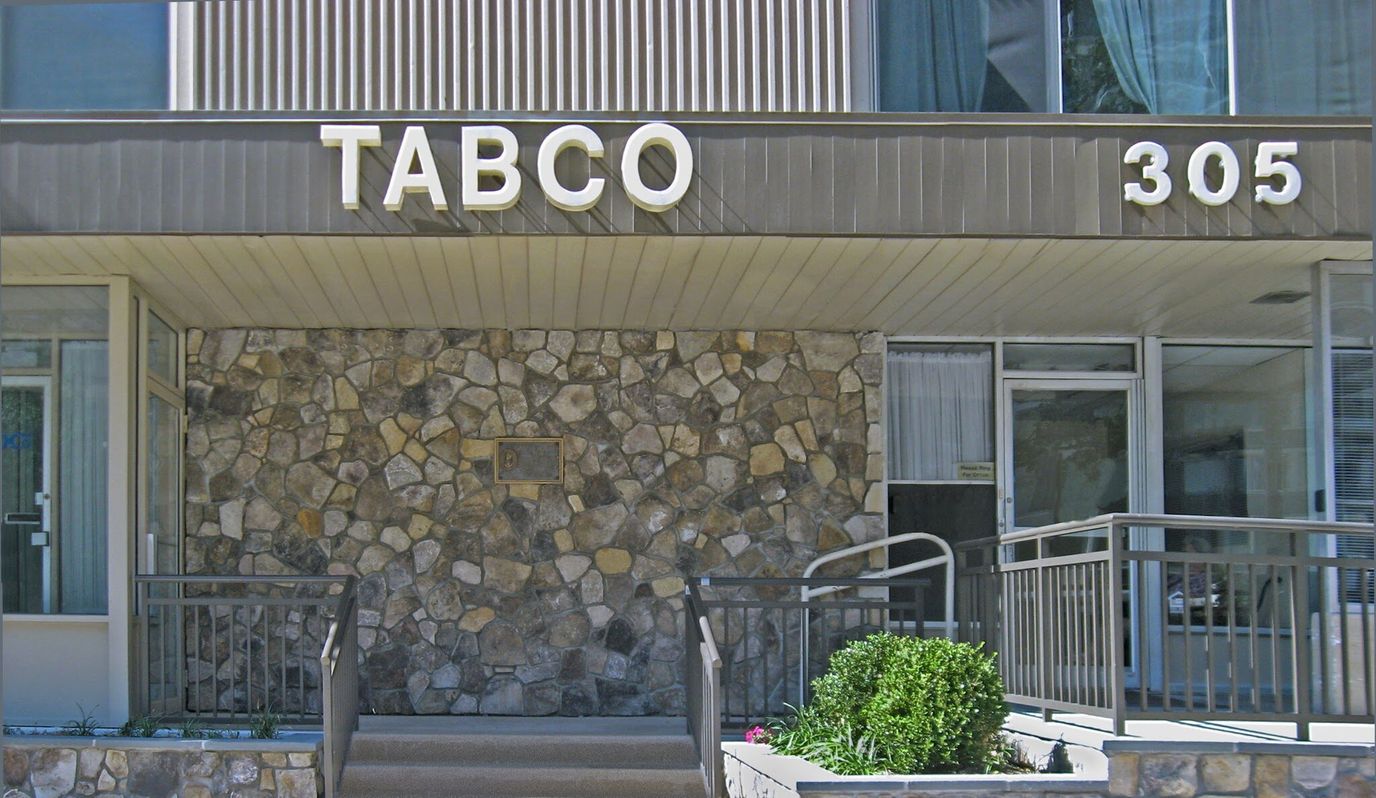
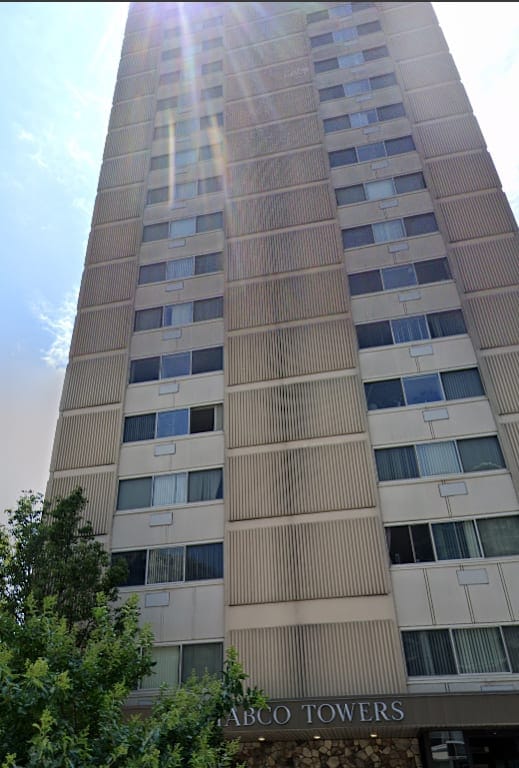
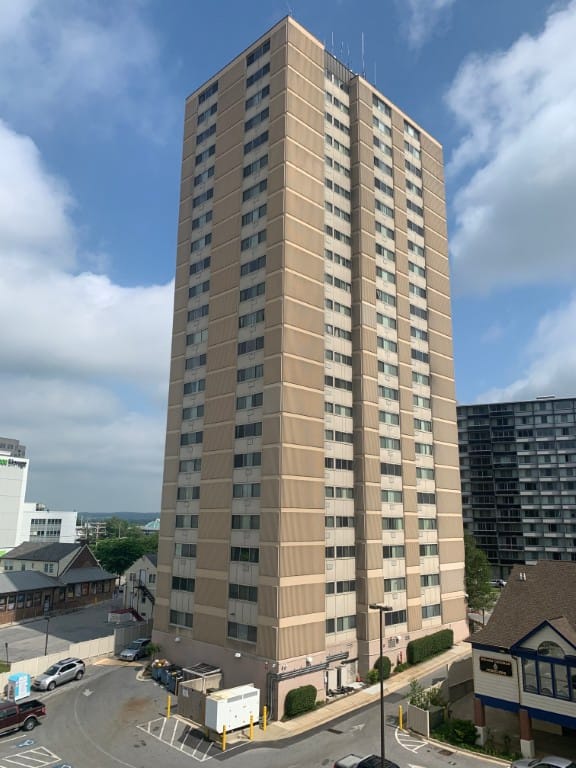
Ideally situated in the thriving neighborhood of Towson, MD, Tabco Towers is a distinct 62+ community that offers independent living. Comfort and convenience are guaranteed in the community’s beautifully furnished and cozy studio and one-bedroom floor plans. Residents also enjoy a hassle-free living with on-site maintenance, compassionate management, and laundry spaces.
A thoughtfully curated calendar of engaging activities and stimulating programs is conducted to keep residents active and socially connected. Residents can also prepare meals based on their dietary needs and preferences with a fully furnished kitchen in each unit. To ease their loneliness, residents are also welcome to bring their pets. The community is a great option for those seeking independence in retirement, especially with its state-of-the-art amenities and exceptional services.
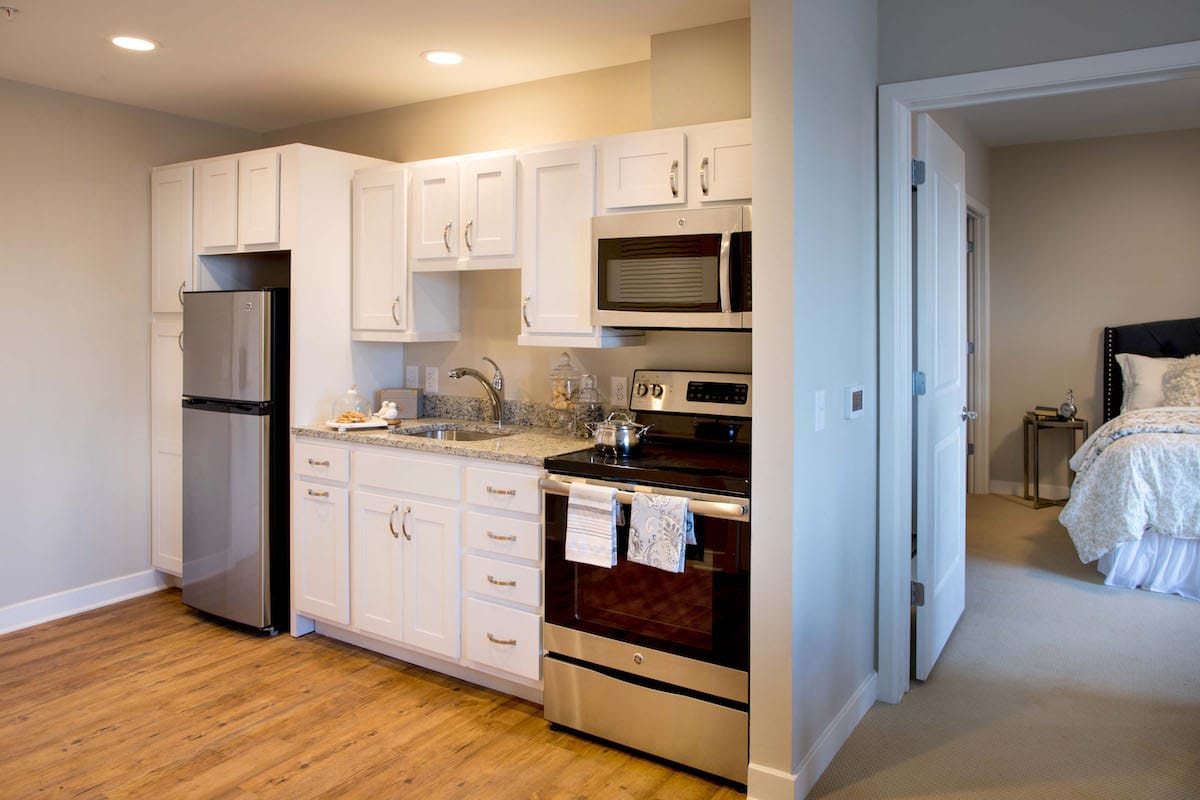
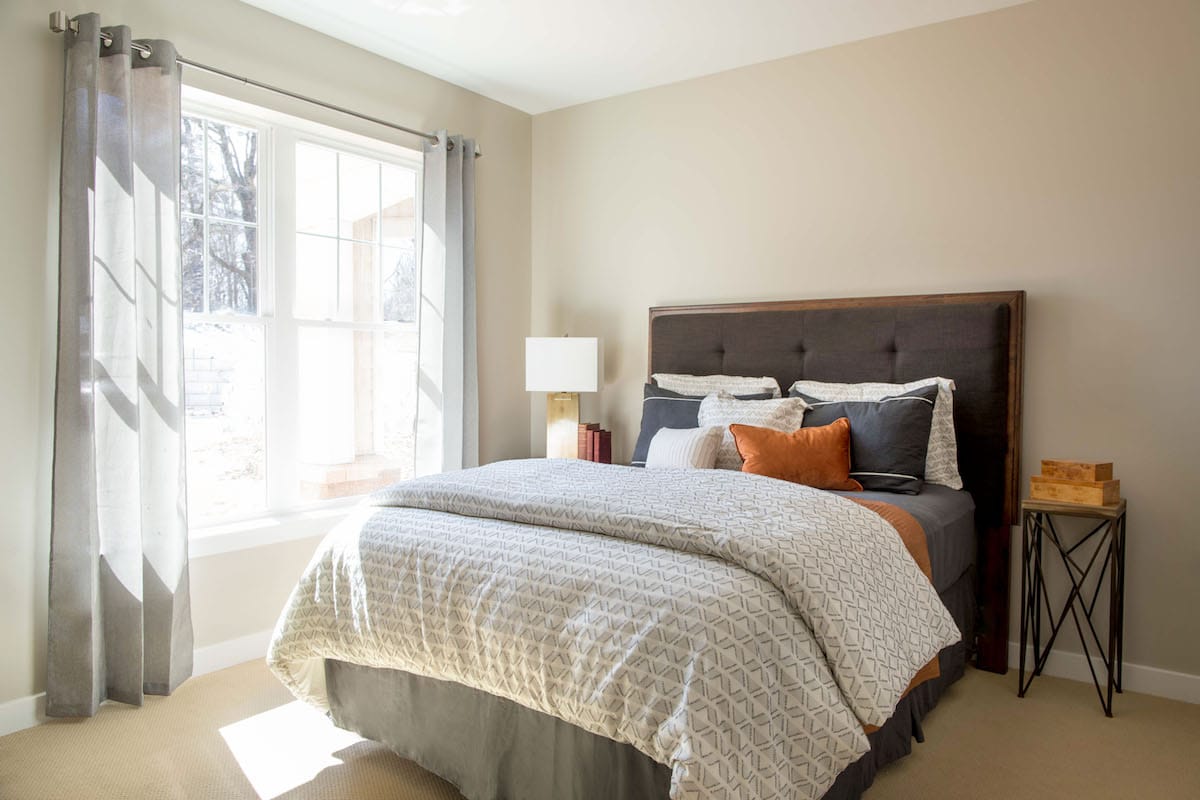
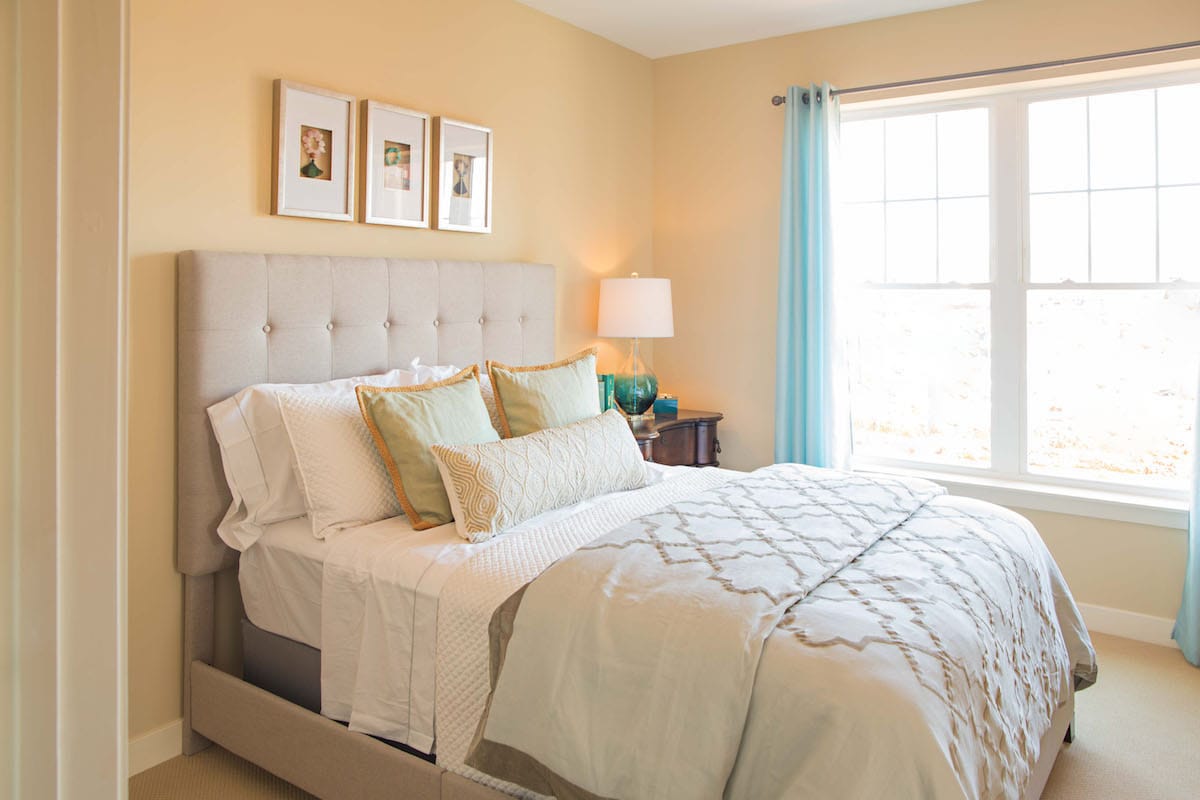
Brightview Crofton Riverwalk is a mid-rise community at 1301 Clarity Dr in Crofton, Maryland, operated by Brightview Senior Living. It has been open for 6 years and holds 92 units in studio, one-bedroom, and two-bedroom configurations. The Walk Score is 45, which means a car is needed for most errands. Room pricing starts at $257 per day for a private room and $337 per day for an apartment.
Three care levels are offered under one roof: independent living, assisted living, and memory care. The memory care side includes a dedicated Alzheimer’s unit organized around mild, moderate, and severe care levels. Brightview’s branded Bright Minds Program runs alongside the clinical care model.
Respite care is available. Licensed nurses and CNAs staff the community, and the facility has a hospice affiliation with Hospice of the Chesapeake. Pets are allowed.
The day-to-day environment is well-appointed. Chef-prepared meals are served in the main dining room, with a private dining room available for family occasions. The building includes a fitness center, library, arts and crafts room, and a full-service beauty and barber shop. An outdoor courtyard and a daily structured activity schedule round out the lifestyle infrastructure.
Brightview Crofton Riverwalk is a full-continuum Brightview Senior Living property: independent living through memory care, a structured Alzheimer’s program with three care levels, on-site hospice affiliation, and a complete amenity set, all in a mid-rise building in Crofton’s Anne Arundel County.
Nestled in the serene neighborhood of Severna Park, Sunrise of Severna Park is a distinguished senior living community dedicated to providing exceptional care and enriching the lives of its residents. With its picturesque surroundings and elegant architecture, this community offers a tranquil and inviting atmosphere for seniors looking to embrace a vibrant and fulfilling lifestyle. The spacious and thoughtfully designed apartments are tailored to meet the unique needs of each resident, offering a range of floor plans to choose from. Each apartment features modern amenities, ample natural light, and beautiful views, providing a comfortable and welcoming space to call home.
At Sunrise of Severna Park, residents are greeted with warmth and compassion. The dedicated team of caregivers is available around the clock to offer personalized assistance and support, ensuring the well-being and safety of each resident. The community promotes a holistic approach to senior living, offering a wide array of engaging activities and programs designed to nurture the mind, body, and spirit. From social gatherings and outings to fitness classes and educational opportunities, there is always something to inspire and entertain residents. With a focus on creating a close-knit community, Sunrise of Severna Park encourages meaningful connections and fosters a sense of belonging for all residents.
Conveniently located in Annapolis, Maryland, Brightview Annapolis offers a variety of senior living choices. This state-of-the-art senior apartment community boasts upscale amenities, featuring senior Independent Living, Assisted Living, and Memory Care rental apartment homes. Individuals can immerse themselves in the essence of this community situated on Generals Highway.
Senior residents can get access to a café, a pub, a well-appointed beauty salon and barber shop, as well as a fully equipped fitness center, all meticulously designed to prioritize comfort. Positioned conveniently on Generals Highway, residents also enjoy access to retail shopping options. Each day unfolds with an assortment of captivating activities, elevating the vibrant senior living encounter awaiting residents at Brightview Annapolis.
Brightview Avondell undoubtedly provides the highest care for independent living, assisted living, and memory care support in Bel Air South in Maryland. Management makes it a point that seniors are given the freedom and choice given to each resident and ensures that they attend to the unique needs of each individual with kindness and compassion. The premier retirement community strives to satisfy the holistic wellness of its residents in a cozy, nurturing, and fun-filled environment.
Brightview Avondell’s residential lifestyle encourages its seniors to live a fulfilling everyday life through the community’s extensive services. Some all-inclusive features include ALDs, medication management, specialized memory care programs, housekeeping, and laundry services tailored to their unique needs. Other amenities include a library, full baths, a cafe, a fitness center, and a multi-purpose room– to name a few of what the home offers.
Ranking Methodology
How we rank these independent living communities
Every community above is evaluated across six weighted categories using public data including state inspection records, review platforms, BBB profiles, and operator-published materials.
Weighting overview
- 35%Resident Experience
- 25%Regulatory
- 15%Visual Media
- 10%Website
- 10%Stability
- 5%Environment
01
Resident & Family Experience 35%
The single largest share of every ranking. Aggregated review sentiment and volume from major platforms — the closest signal to real resident experience.
- Includes
- Review Sentiment
- Review Volume
02
Regulatory & Safety Record 25%
State inspection records, citations, and complaint visits. We weight per-inspection rates more heavily than raw counts.
- Includes
- State Inspections
- Citations/Inspection
- % Inspections w/ Citations
- Complaint Visits
- Accreditations
- BBB Rating
03
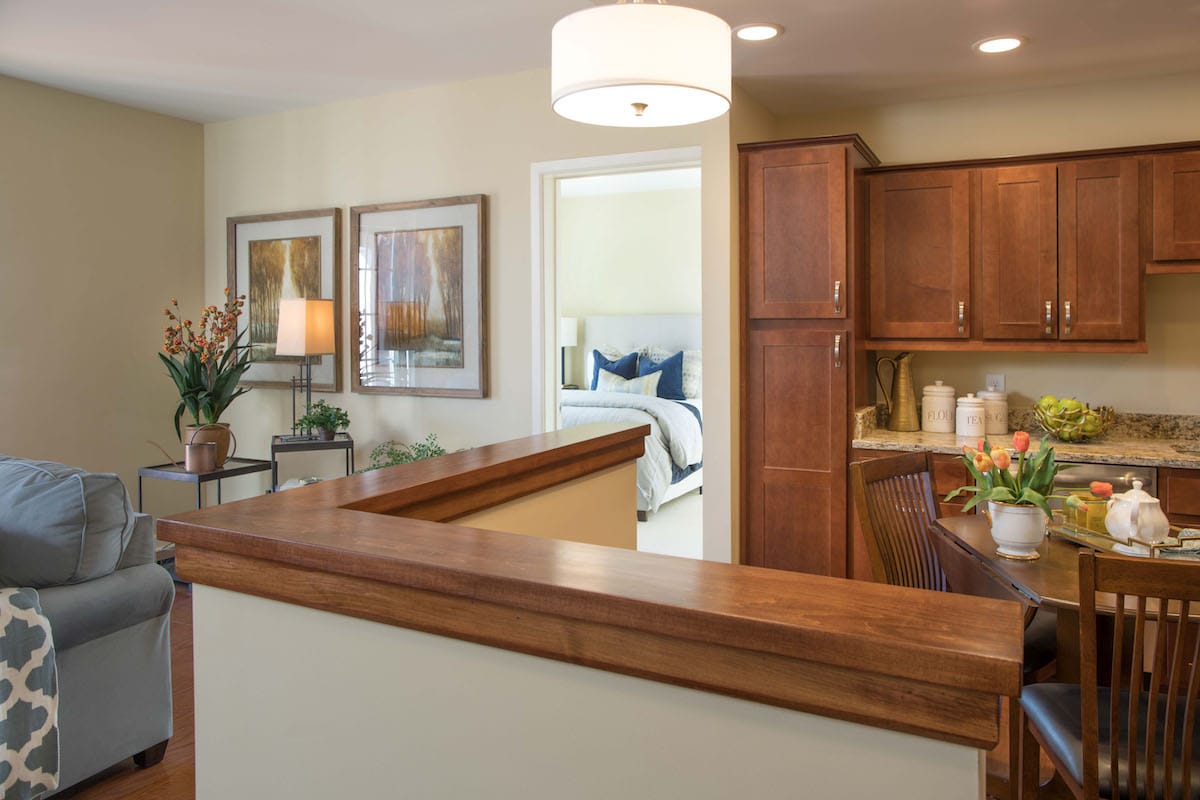
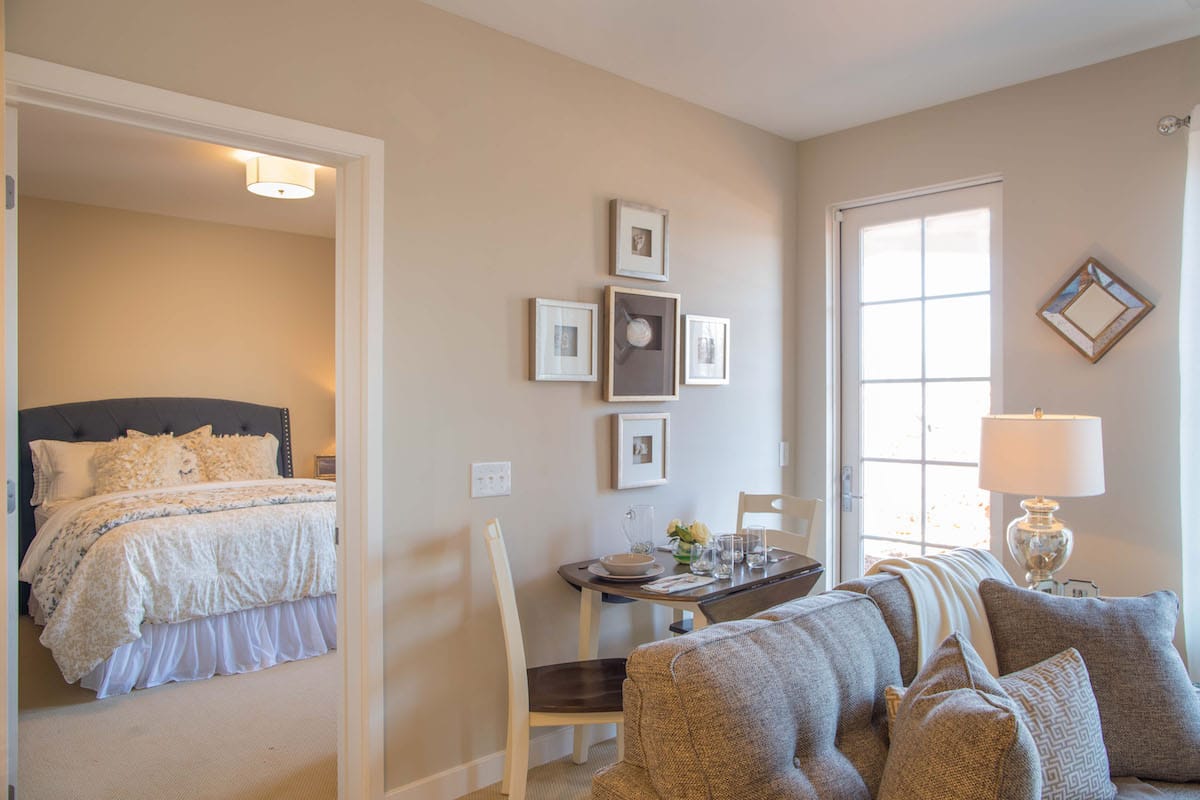
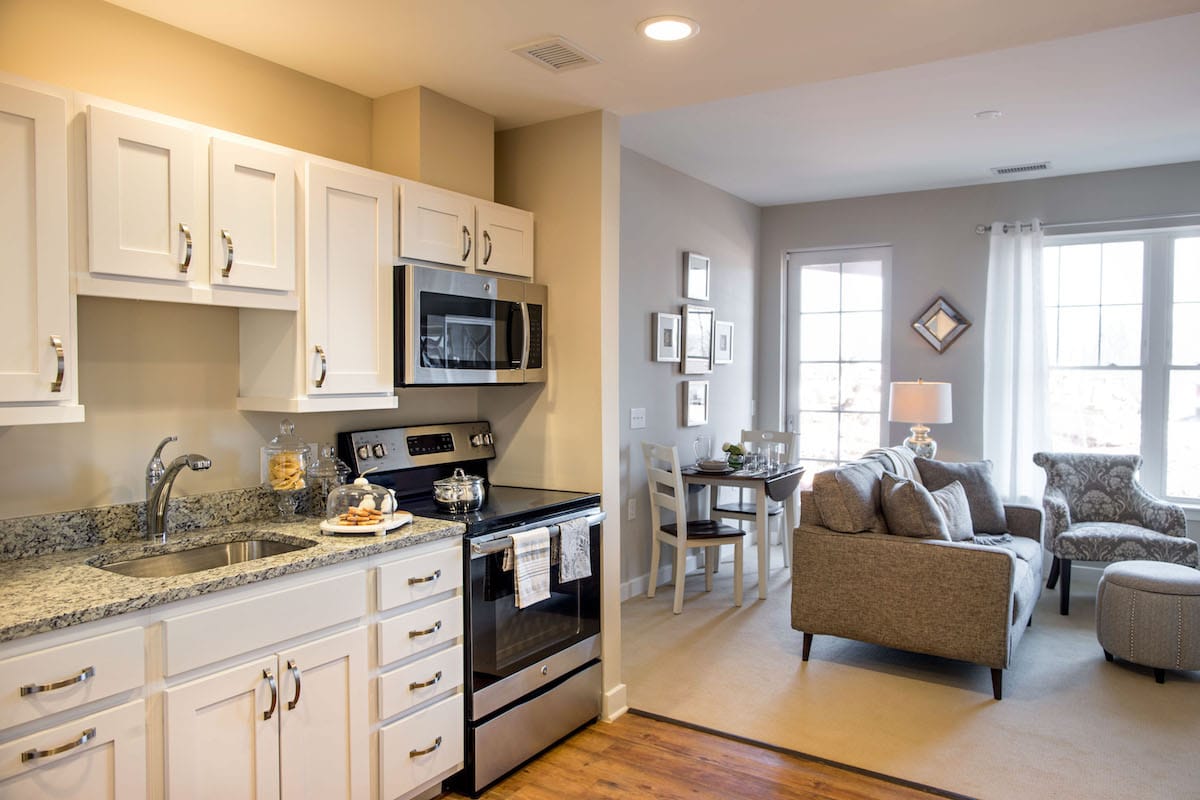
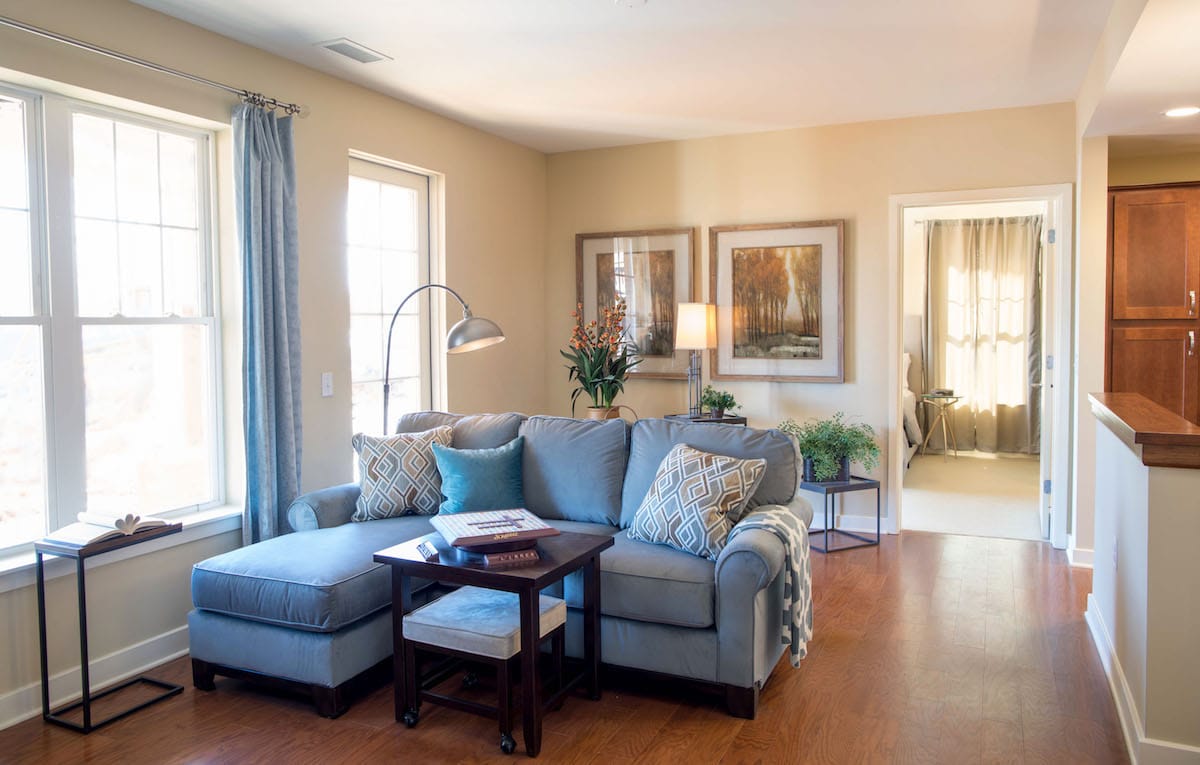
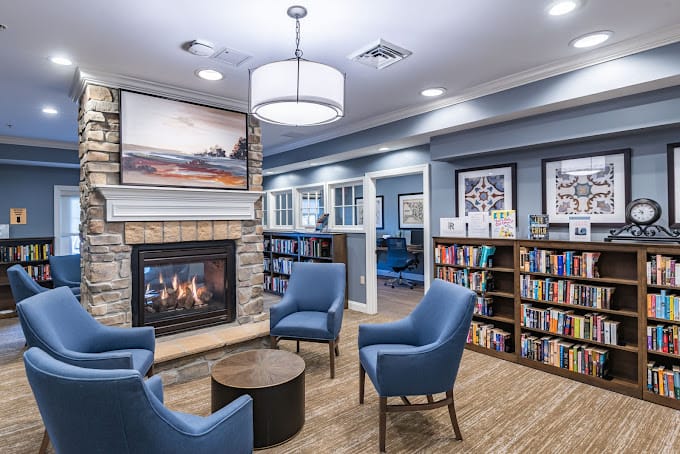
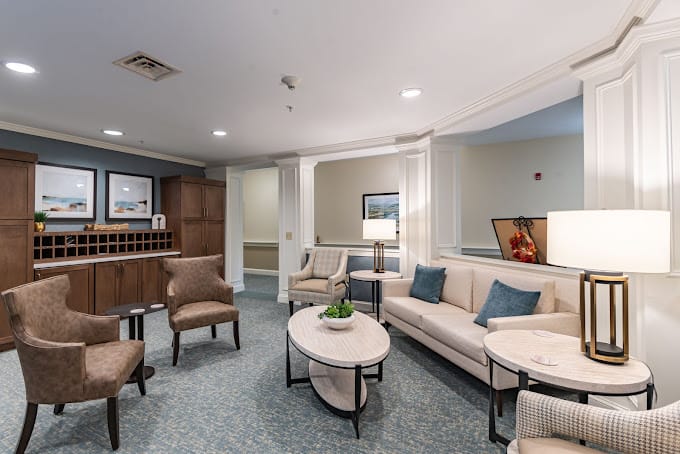
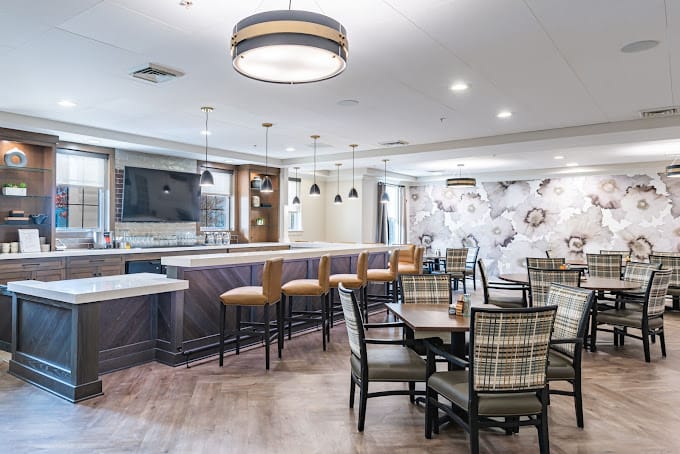
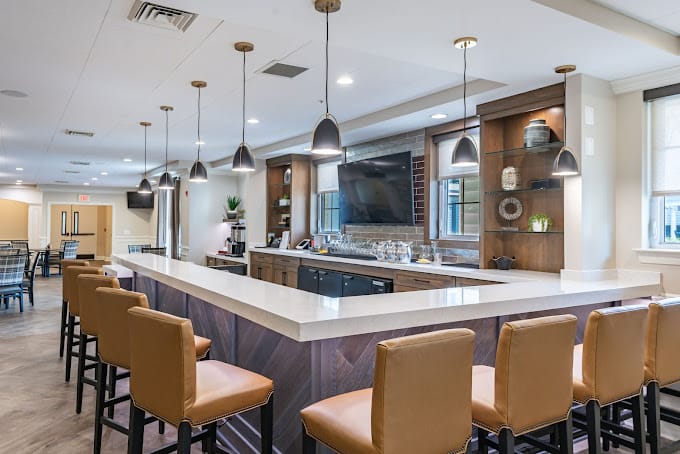
Visual Media & Transparency 15%
Communities that publish high-quality visuals give families a real preview. No photos or tours = a negative transparency signal.
- Includes
- Video Tours
- Virtual Walkthroughs
- Photo Quantity
- Photo Quality
04
Website & Operator Transparency 10%
Site quality and whether the operator publishes basic accountability information — staff names, contact details, ownership.
- Includes
- Website Content
- Mobile Usability
- Staff Info Available
- Owner Info Available
05
Community Stability 10%
Operational signals indicating whether a community is well-run and meeting demand.
- Includes
- Occupancy Rate
- Bed Options
06
Environment & Pricing 5%
Walkability and pricing transparency. Walk Score is weighted higher for Independent Living than for Memory Care, where most residents do not leave unaccompanied.
- Includes
- Walk Score
- Pricing Transparency
Who we are
Your Senior Care Partner, Every Step of the Way
We help families find affordable senior communities and unlock same day discounts, Medicaid, and Medicare options tailored to your needs.
Contact us Today
Frequently Asked Questions about Independent Living in Maryland
What is independent living?
Independent living communities are residential settings for active older adults — typically with private apartments or cottages, shared amenities (dining, fitness, activities), and no built-in medical care.
How many independent living communities are listed on this page?
This page features 164 independent living communities in Maryland. Use the filters and comparison tools above to compare ratings, amenities, and pricing.
How do I choose the right independent living community in Maryland?
Start by matching the level of care offered to the resident's current and anticipated needs, then compare licensing status, staff-to-resident ratios, recent inspection results, and pricing. Tour at least two or three communities in Maryland, talk to current residents and families, and confirm what is included in the base rate versus billed as add-on services.
What should I look for when visiting independent living communities in Maryland?
Pay attention to staff interactions with residents, cleanliness and odor, food quality at meal times, the activity calendar, and how questions about pricing and care plans are answered. Ask to see the most recent state inspection report, the move-out / level-of-care-change policy, and a sample monthly bill that lists every fee.
Updated on
