


Where in Maryland are you looking?
Browse communities by city.
Compare Memory Care around Maryland
Info below is compiled from the MD Dept. of Health (OHCQ), senior community websites & trusted data sources such as Walk Score & BBB.
Communities are listed from highest to lowest based on our ranking methodology.
| Bedford Court, a CCRC | MC AL HOS IL NH RC SNF | Silver Spring (International Drive) | 76
Facility
76
MD AVG
42
Rank
#174 / 685 | Yes |
64
Facility
64
MD AVG
43
Rank
#261 / 985 | Studio / 1 Bed | 34
Facility
34
MD AVG
21
Rank
#22 / 210 | - |
15% Male Residents — State Benchmarked 15% of residents are male, compared to the Maryland average of 31%. This facility caters to a majority female resident pool (85% female), consistent with the broader assisted living trend where women significantly outnumber men. |
85% Female Residents — State Benchmarked 85% of residents are female, compared to the Maryland average of 69%. Women comprise the large majority, consistent with national assisted living demographics where women live longer and enter care facilities at higher rates. |
95% White Residents — State Benchmarked 95% of residents are reported as White, compared to the Maryland average of 81%. A higher White share than is typical for assisted living in Maryland in this dataset — compare with peer facilities for local context. |
3% African American Residents — State Benchmarked 3% of residents are reported as African American or Black, compared to the Maryland average of 13%. A lower African American share than is typical in Maryland; local markets still vary widely. |
2% Other Ethnicity Residents — State Benchmarked 2% of residents fall into categories other than White or African American (combined), compared to the Maryland average of 6%. This column aggregates Hispanic, Asian, multiracial, and any other labeled groups that are not classified as White or African American. Reported subgroups in this total: Asian (2%). |
2% Residents Age 65–74 — State Benchmarked 2% of residents are 65–74, compared to the Maryland average of 13%. Fewer younger seniors suggests the resident population skews older, likely requiring higher acuity care and more hands-on support. |
8% Residents Age 75–84 — State Benchmarked 8% of residents are 75–84, compared to the Maryland average of 31%. Below the state norm — the resident mix may skew either younger or older than this typical middle bracket. |
65% Residents Age 85–94 — State Benchmarked 65% of residents are 85–94, compared to the Maryland average of 44%. A high concentration of very elderly residents signals a higher-acuity facility with experience caring for advanced age-related needs. |
26% Residents Age 95+ — State Benchmarked 26% of residents are 95 or older, compared to the Maryland average of 16%. A high proportion of the oldest-old suggests strong end-of-life care experience and very-high-acuity capabilities. |
| Edenwald Senior Living | MC AL IL NH SNF | Towson (Southerly Road) | 94
Facility
94
MD AVG
42
Rank
#139 / 685 | No |
83
Facility
83
MD AVG
43
Rank
#70 / 985 | 1 Bed / 2 Bed | - | A+ |
18% Male Residents — State Benchmarked 18% of residents are male, compared to the Maryland average of 31%. This facility caters to a majority female resident pool (82% female), consistent with the broader assisted living trend where women significantly outnumber men. |
82% Female Residents — State Benchmarked 82% of residents are female, compared to the Maryland average of 69%. Women comprise the large majority, consistent with national assisted living demographics where women live longer and enter care facilities at higher rates. |
100% White Residents — State Benchmarked 100% of residents are reported as White, compared to the Maryland average of 81%. A higher White share than is typical for assisted living in Maryland in this dataset — compare with peer facilities for local context. |
0% African American Residents — State Benchmarked 0% of residents are reported as African American or Black, compared to the Maryland average of 13%. A lower African American share than is typical in Maryland; local markets still vary widely. |
0% Other Ethnicity Residents — State Benchmarked 0% of residents fall into categories other than White or African American (combined), compared to the Maryland average of 6%. This column aggregates Hispanic, Asian, multiracial, and any other labeled groups that are not classified as White or African American. | - |
13% Residents Age 75–84 — State Benchmarked 13% of residents are 75–84, compared to the Maryland average of 31%. Below the state norm — the resident mix may skew either younger or older than this typical middle bracket. |
53% Residents Age 85–94 — State Benchmarked 53% of residents are 85–94, compared to the Maryland average of 44%. A high concentration of very elderly residents signals a higher-acuity facility with experience caring for advanced age-related needs. |
35% Residents Age 95+ — State Benchmarked 35% of residents are 95 or older, compared to the Maryland average of 16%. A high proportion of the oldest-old suggests strong end-of-life care experience and very-high-acuity capabilities. |
| Sunrise of Rockville | MC AL HOS | Rockville (Baltimore Road) | 89
Facility
89
MD AVG
42
Rank
#150 / 685 | Yes |
89
Facility
89
MD AVG
43
Rank
#32 / 985 | Studio / 1 Bed / 2 Bed | 45
Facility
45
MD AVG
21
Rank
#4 / 210 | A- |
23% Male Residents — State Benchmarked 23% of residents are male, compared to the Maryland average of 31%. This facility caters to a majority female resident pool (77% female), consistent with the broader assisted living trend where women significantly outnumber men. |
77% Female Residents — State Benchmarked 77% of residents are female, compared to the Maryland average of 69%. Women comprise the large majority, consistent with national assisted living demographics where women live longer and enter care facilities at higher rates. |
87% White Residents — State Benchmarked 87% of residents are reported as White, compared to the Maryland average of 81%. Close to the average for this category among assisted living facilities in Maryland with reported race/ethnicity data. |
2% African American Residents — State Benchmarked 2% of residents are reported as African American or Black, compared to the Maryland average of 13%. A lower African American share than is typical in Maryland; local markets still vary widely. |
11% Other Ethnicity Residents — State Benchmarked 11% of residents fall into categories other than White or African American (combined), compared to the Maryland average of 6%. This column aggregates Hispanic, Asian, multiracial, and any other labeled groups that are not classified as White or African American. Reported subgroups in this total: Mixed Race (6%), Hispanic (3%), Asian (2%). |
3% Residents Age 65–74 — State Benchmarked 3% of residents are 65–74, compared to the Maryland average of 13%. Fewer younger seniors suggests the resident population skews older, likely requiring higher acuity care and more hands-on support. |
31% Residents Age 75–84 — State Benchmarked 31% of residents are 75–84, compared to the Maryland average of 31%. This is the second most common age bracket in assisted living, representing residents with moderate care needs. |
56% Residents Age 85–94 — State Benchmarked 56% of residents are 85–94, compared to the Maryland average of 44%. A high concentration of very elderly residents signals a higher-acuity facility with experience caring for advanced age-related needs. |
10% Residents Age 95+ — State Benchmarked 10% of residents are 95 or older, compared to the Maryland average of 16%. Most residents here have not yet reached the oldest-old bracket, suggesting a younger overall community. |
| Maplewood Park Place | MC AL IL NH SNF | Bethesda (Pooks Hill) | 29
Facility
29
MD AVG
42
Rank
#240 / 685 | Yes |
38
Facility
38
MD AVG
43
Rank
#542 / 985 | 1 Bed / 2 Bed | 30
Facility
30
MD AVG
21
Rank
#44 / 210 | - |
18% Male Residents — State Benchmarked 18% of residents are male, compared to the Maryland average of 31%. This facility caters to a majority female resident pool (82% female), consistent with the broader assisted living trend where women significantly outnumber men. |
82% Female Residents — State Benchmarked 82% of residents are female, compared to the Maryland average of 69%. Women comprise the large majority, consistent with national assisted living demographics where women live longer and enter care facilities at higher rates. |
100% White Residents — State Benchmarked 100% of residents are reported as White, compared to the Maryland average of 81%. A higher White share than is typical for assisted living in Maryland in this dataset — compare with peer facilities for local context. |
0% African American Residents — State Benchmarked 0% of residents are reported as African American or Black, compared to the Maryland average of 13%. A lower African American share than is typical in Maryland; local markets still vary widely. |
0% Other Ethnicity Residents — State Benchmarked 0% of residents fall into categories other than White or African American (combined), compared to the Maryland average of 6%. This column aggregates Hispanic, Asian, multiracial, and any other labeled groups that are not classified as White or African American. | - |
6% Residents Age 75–84 — State Benchmarked 6% of residents are 75–84, compared to the Maryland average of 31%. Below the state norm — the resident mix may skew either younger or older than this typical middle bracket. |
24% Residents Age 85–94 — State Benchmarked 24% of residents are 85–94, compared to the Maryland average of 44%. The population here skews younger than the statewide norm, which may indicate a more active, lower-acuity community. |
71% Residents Age 95+ — State Benchmarked 71% of residents are 95 or older, compared to the Maryland average of 16%. A high proportion of the oldest-old suggests strong end-of-life care experience and very-high-acuity capabilities. |
| Ingleside at King Farm | MC AL IL NH SNF | Rockville (King Farm) | 45
Facility
45
MD AVG
42
Rank
#219 / 685 | Yes |
73
Facility
73
MD AVG
43
Rank
#152 / 985 | 1 Bed / 2 Bed | - | - | - | - | - | - | - | - | - | - | - |
| Homewood Living Frederick | MC AL IL NH SNF | Frederick | 120
Facility
120
MD AVG
42
Rank
#73 / 685 | Yes |
14
Facility
14
MD AVG
43
Rank
#788 / 985 | 1 Bed / 2 Bed | - | - | - | - | - | - | - | - | - | - | - |
| Residences at Vantage Point | MC AL HC IL NH SNF | Columbia (Town Center) | 44
Facility
44
MD AVG
42
Rank
#222 / 685 | Yes |
52
Facility
52
MD AVG
43
Rank
#402 / 985 | Studio / 1 Bed / 2 Bed | 36
Facility
36
MD AVG
21
Rank
#16 / 210 | - | - | - | - | - | - | - | - | - | - |
| Buckingham‘s Choice | MC AL NH RC SNF | Adamstown (Baker Circle) | 42
Facility
42
MD AVG
42
Rank
#223 / 685 | No |
3
Facility
3
MD AVG
43
Rank
#930 / 985 | Private Rooms | 31
Facility
31
MD AVG
21
Rank
#39 / 210 | - | - | - | - | - | - | - | - | - | - |
| Sunrise of Pikesville | MC NH AL HOS | Pikesville (Old Court Road) | 96
Facility
96
MD AVG
42
Rank
#131 / 685 | Yes |
75
Facility
75
MD AVG
43
Rank
#131 / 985 | Studio / 1 Bed / 2 Bed | 45
Facility
45
MD AVG
21
Rank
#4 / 210 | A- |
30% Male Residents — State Benchmarked 30% of residents are male, compared to the Maryland average of 31%. This facility caters to a majority female resident pool (70% female), consistent with the broader assisted living trend where women significantly outnumber men. |
70% Female Residents — State Benchmarked 70% of residents are female, compared to the Maryland average of 69%. Women comprise the large majority, consistent with national assisted living demographics where women live longer and enter care facilities at higher rates. |
63% White Residents — State Benchmarked 63% of residents are reported as White, compared to the Maryland average of 81%. A lower White share than the Maryland average — the community may draw a more diverse resident mix relative to other facilities in Maryland. |
37% African American Residents — State Benchmarked 37% of residents are reported as African American or Black, compared to the Maryland average of 13%. A higher African American share than the typical Maryland average — useful context when comparing cultural fit and community composition. |
0% Other Ethnicity Residents — State Benchmarked 0% of residents fall into categories other than White or African American (combined), compared to the Maryland average of 6%. This column aggregates Hispanic, Asian, multiracial, and any other labeled groups that are not classified as White or African American. |
15% Residents Age 65–74 — State Benchmarked 15% of residents are 65–74, compared to the Maryland average of 13%. In line with the statewide profile for this youngest senior bracket in assisted living. |
27% Residents Age 75–84 — State Benchmarked 27% of residents are 75–84, compared to the Maryland average of 31%. This is the second most common age bracket in assisted living, representing residents with moderate care needs. |
41% Residents Age 85–94 — State Benchmarked 41% of residents are 85–94, compared to the Maryland average of 44%. This is typically the most common age bracket in assisted living — this facility is in line with the statewide norm. |
15% Residents Age 95+ — State Benchmarked 15% of residents are 95 or older, compared to the Maryland average of 16%. In line with the statewide profile for the oldest resident bracket. |
| Brighton Gardens of Friendship Heights | MC AL HOS | Chevy Chase (Friendship Boulevard) | 154
Facility
154
MD AVG
42
Rank
#39 / 685 | Yes |
86
Facility
86
MD AVG
43
Rank
#47 / 985 | Studio / 1 Bed / 2 Bed | 29
Facility
29
MD AVG
21
Rank
#48 / 210 | - |
20% Male Residents — State Benchmarked 20% of residents are male, compared to the Maryland average of 31%. This facility caters to a majority female resident pool (80% female), consistent with the broader assisted living trend where women significantly outnumber men. |
80% Female Residents — State Benchmarked 80% of residents are female, compared to the Maryland average of 69%. Women comprise the large majority, consistent with national assisted living demographics where women live longer and enter care facilities at higher rates. |
96% White Residents — State Benchmarked 96% of residents are reported as White, compared to the Maryland average of 81%. A higher White share than is typical for assisted living in Maryland in this dataset — compare with peer facilities for local context. |
1% African American Residents — State Benchmarked 1% of residents are reported as African American or Black, compared to the Maryland average of 13%. A lower African American share than is typical in Maryland; local markets still vary widely. |
3% Other Ethnicity Residents — State Benchmarked 3% of residents fall into categories other than White or African American (combined), compared to the Maryland average of 6%. This column aggregates Hispanic, Asian, multiracial, and any other labeled groups that are not classified as White or African American. Reported subgroups in this total: Asian (2%), Hispanic (1%). |
3% Residents Age 65–74 — State Benchmarked 3% of residents are 65–74, compared to the Maryland average of 13%. Fewer younger seniors suggests the resident population skews older, likely requiring higher acuity care and more hands-on support. |
31% Residents Age 75–84 — State Benchmarked 31% of residents are 75–84, compared to the Maryland average of 31%. This is the second most common age bracket in assisted living, representing residents with moderate care needs. |
49% Residents Age 85–94 — State Benchmarked 49% of residents are 85–94, compared to the Maryland average of 44%. A high concentration of very elderly residents signals a higher-acuity facility with experience caring for advanced age-related needs. |
15% Residents Age 95+ — State Benchmarked 15% of residents are 95 or older, compared to the Maryland average of 16%. In line with the statewide profile for the oldest resident bracket. |
| Sunrise of Frederick | MC AL | Frederick (Waterford) | 88
Facility
88
MD AVG
42
Rank
#152 / 685 | Yes |
62
Facility
62
MD AVG
43
Rank
#286 / 985 | Studio / Suite / 2 Bed | 45
Facility
45
MD AVG
21
Rank
#4 / 210 | A- |
31% Male Residents — State Benchmarked 31% of residents are male, compared to the Maryland average of 31%. This facility caters to a majority female resident pool (69% female), consistent with the broader assisted living trend where women significantly outnumber men. |
69% Female Residents — State Benchmarked 69% of residents are female, compared to the Maryland average of 69%. Women comprise the large majority, consistent with national assisted living demographics where women live longer and enter care facilities at higher rates. |
97% White Residents — State Benchmarked 97% of residents are reported as White, compared to the Maryland average of 81%. A higher White share than is typical for assisted living in Maryland in this dataset — compare with peer facilities for local context. |
2% African American Residents — State Benchmarked 2% of residents are reported as African American or Black, compared to the Maryland average of 13%. A lower African American share than is typical in Maryland; local markets still vary widely. |
2% Other Ethnicity Residents — State Benchmarked 2% of residents fall into categories other than White or African American (combined), compared to the Maryland average of 6%. This column aggregates Hispanic, Asian, multiracial, and any other labeled groups that are not classified as White or African American. Reported subgroups in this total: Hispanic (2%). |
10% Residents Age 65–74 — State Benchmarked 10% of residents are 65–74, compared to the Maryland average of 13%. Fewer younger seniors suggests the resident population skews older, likely requiring higher acuity care and more hands-on support. |
34% Residents Age 75–84 — State Benchmarked 34% of residents are 75–84, compared to the Maryland average of 31%. This is the second most common age bracket in assisted living, representing residents with moderate care needs. |
48% Residents Age 85–94 — State Benchmarked 48% of residents are 85–94, compared to the Maryland average of 44%. This is typically the most common age bracket in assisted living — this facility is in line with the statewide norm. |
6% Residents Age 95+ — State Benchmarked 6% of residents are 95 or older, compared to the Maryland average of 16%. Most residents here have not yet reached the oldest-old bracket, suggesting a younger overall community. |
| Sterling Care Hillhaven Assisted Living and Memory Care | MC AL HOS NH SNF | Adelphi (Knollwood) | 66
Facility
66
MD AVG
42
Rank
#188 / 685 | No |
25
Facility
25
MD AVG
43
Rank
#684 / 985 | Studio / 1 Bed | - | - | - | - | - | - | - | - | - | - | - |
| Sunrise of Columbia | MC AL HOS RC | Columbia (Hickory Ridge) | 96
Facility
96
MD AVG
42
Rank
#131 / 685 | Yes |
53
Facility
53
MD AVG
43
Rank
#393 / 985 | Studio / 1 Bed / 2 Bed | 45
Facility
45
MD AVG
21
Rank
#4 / 210 | A- |
31% Male Residents — State Benchmarked 31% of residents are male, compared to the Maryland average of 31%. This facility caters to a majority female resident pool (69% female), consistent with the broader assisted living trend where women significantly outnumber men. |
69% Female Residents — State Benchmarked 69% of residents are female, compared to the Maryland average of 69%. Women comprise the large majority, consistent with national assisted living demographics where women live longer and enter care facilities at higher rates. |
88% White Residents — State Benchmarked 88% of residents are reported as White, compared to the Maryland average of 81%. Close to the average for this category among assisted living facilities in Maryland with reported race/ethnicity data. |
5% African American Residents — State Benchmarked 5% of residents are reported as African American or Black, compared to the Maryland average of 13%. In line with the Maryland average for African American residents among facilities reporting this breakdown. |
6% Other Ethnicity Residents — State Benchmarked 6% of residents fall into categories other than White or African American (combined), compared to the Maryland average of 6%. This column aggregates Hispanic, Asian, multiracial, and any other labeled groups that are not classified as White or African American. Reported subgroups in this total: Asian (4%), American Indian (1%), Hispanic (1%). |
6% Residents Age 65–74 — State Benchmarked 6% of residents are 65–74, compared to the Maryland average of 13%. Fewer younger seniors suggests the resident population skews older, likely requiring higher acuity care and more hands-on support. |
38% Residents Age 75–84 — State Benchmarked 38% of residents are 75–84, compared to the Maryland average of 31%. A high concentration in this mid-range bracket, where residents typically need moderate support with daily activities. |
36% Residents Age 85–94 — State Benchmarked 36% of residents are 85–94, compared to the Maryland average of 44%. The population here skews younger than the statewide norm, which may indicate a more active, lower-acuity community. |
19% Residents Age 95+ — State Benchmarked 19% of residents are 95 or older, compared to the Maryland average of 16%. In line with the statewide profile for the oldest resident bracket. |
| Asbury Methodist Village | MC AL IL NH SNF | Gaithersburg (Russell Avenue) | 164
Facility
164
MD AVG
42
Rank
#26 / 685 | Yes |
41
Facility
41
MD AVG
43
Rank
#508 / 985 | - | 27
Facility
27
MD AVG
21
Rank
#62 / 210 | - |
21% Male Residents — State Benchmarked 21% of residents are male, compared to the Maryland average of 31%. This facility caters to a majority female resident pool (79% female), consistent with the broader assisted living trend where women significantly outnumber men. |
79% Female Residents — State Benchmarked 79% of residents are female, compared to the Maryland average of 69%. Women comprise the large majority, consistent with national assisted living demographics where women live longer and enter care facilities at higher rates. |
92% White Residents — State Benchmarked 92% of residents are reported as White, compared to the Maryland average of 81%. A higher White share than is typical for assisted living in Maryland in this dataset — compare with peer facilities for local context. |
1% African American Residents — State Benchmarked 1% of residents are reported as African American or Black, compared to the Maryland average of 13%. A lower African American share than is typical in Maryland; local markets still vary widely. |
7% Other Ethnicity Residents — State Benchmarked 7% of residents fall into categories other than White or African American (combined), compared to the Maryland average of 6%. This column aggregates Hispanic, Asian, multiracial, and any other labeled groups that are not classified as White or African American. Reported subgroups in this total: Asian (7%). |
1% Residents Age 65–74 — State Benchmarked 1% of residents are 65–74, compared to the Maryland average of 13%. Fewer younger seniors suggests the resident population skews older, likely requiring higher acuity care and more hands-on support. |
21% Residents Age 75–84 — State Benchmarked 21% of residents are 75–84, compared to the Maryland average of 31%. Below the state norm — the resident mix may skew either younger or older than this typical middle bracket. |
48% Residents Age 85–94 — State Benchmarked 48% of residents are 85–94, compared to the Maryland average of 44%. This is typically the most common age bracket in assisted living — this facility is in line with the statewide norm. |
30% Residents Age 95+ — State Benchmarked 30% of residents are 95 or older, compared to the Maryland average of 16%. A high proportion of the oldest-old suggests strong end-of-life care experience and very-high-acuity capabilities. |
| Morningside House At Satyr Hill | MC AL HOS RC | Parkville (Woodcroft) | 125
Facility
125
MD AVG
42
Rank
#68 / 685 | Yes |
72
Facility
72
MD AVG
43
Rank
#160 / 985 | Private Rooms / Semi-Private Rooms | 28
Facility
28
MD AVG
21
Rank
#53 / 210 | A+ |
34% Male Residents — State Benchmarked 34% of residents are male, compared to the Maryland average of 31%. This facility caters to a majority female resident pool (66% female), consistent with the broader assisted living trend where women significantly outnumber men. |
66% Female Residents — State Benchmarked 66% of residents are female, compared to the Maryland average of 69%. Women comprise the large majority, consistent with national assisted living demographics where women live longer and enter care facilities at higher rates. |
98% White Residents — State Benchmarked 98% of residents are reported as White, compared to the Maryland average of 81%. A higher White share than is typical for assisted living in Maryland in this dataset — compare with peer facilities for local context. |
2% African American Residents — State Benchmarked 2% of residents are reported as African American or Black, compared to the Maryland average of 13%. A lower African American share than is typical in Maryland; local markets still vary widely. |
0% Other Ethnicity Residents — State Benchmarked 0% of residents fall into categories other than White or African American (combined), compared to the Maryland average of 6%. This column aggregates Hispanic, Asian, multiracial, and any other labeled groups that are not classified as White or African American. |
13% Residents Age 65–74 — State Benchmarked 13% of residents are 65–74, compared to the Maryland average of 13%. In line with the statewide profile for this youngest senior bracket in assisted living. |
40% Residents Age 75–84 — State Benchmarked 40% of residents are 75–84, compared to the Maryland average of 31%. A high concentration in this mid-range bracket, where residents typically need moderate support with daily activities. |
29% Residents Age 85–94 — State Benchmarked 29% of residents are 85–94, compared to the Maryland average of 44%. The population here skews younger than the statewide norm, which may indicate a more active, lower-acuity community. |
16% Residents Age 95+ — State Benchmarked 16% of residents are 95 or older, compared to the Maryland average of 16%. In line with the statewide profile for the oldest resident bracket. |
Rows per page:

View all Nearby Homes
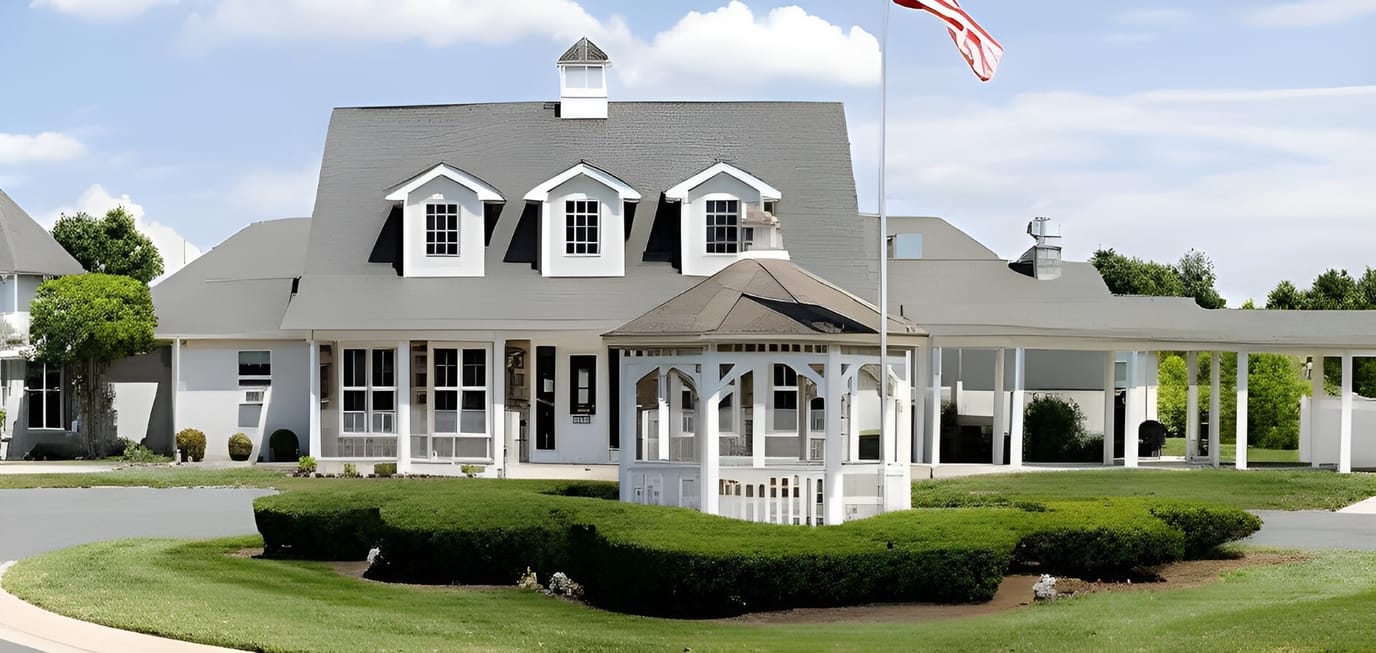
Overview of Viva Senior Living at Bel Air

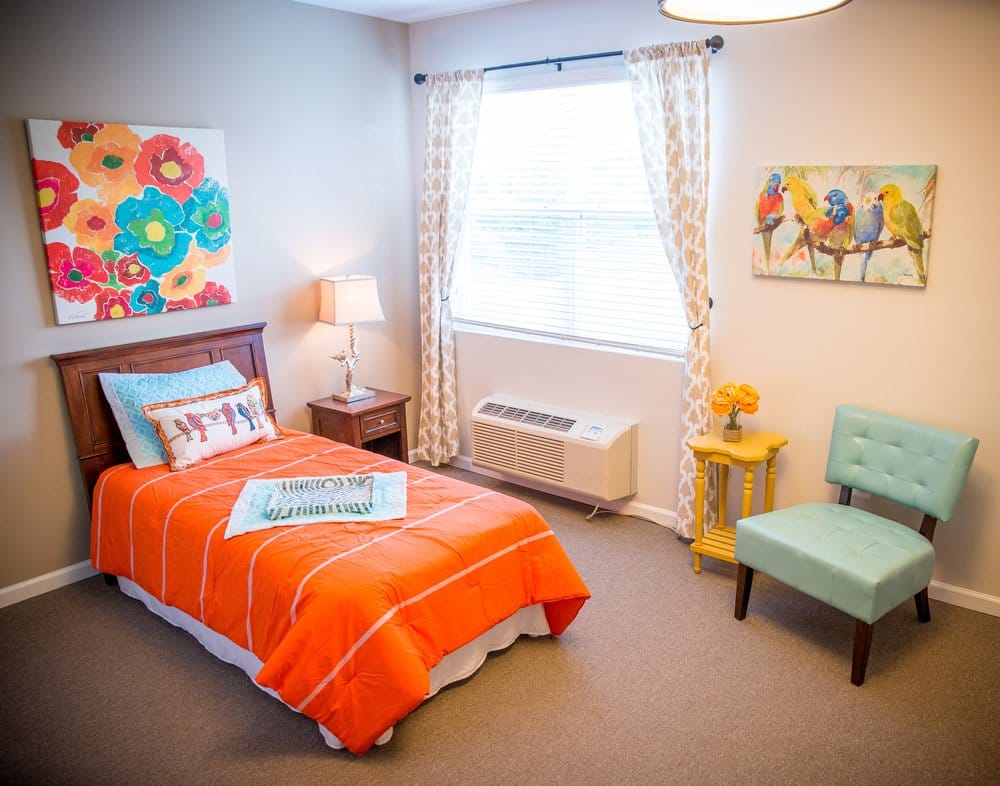
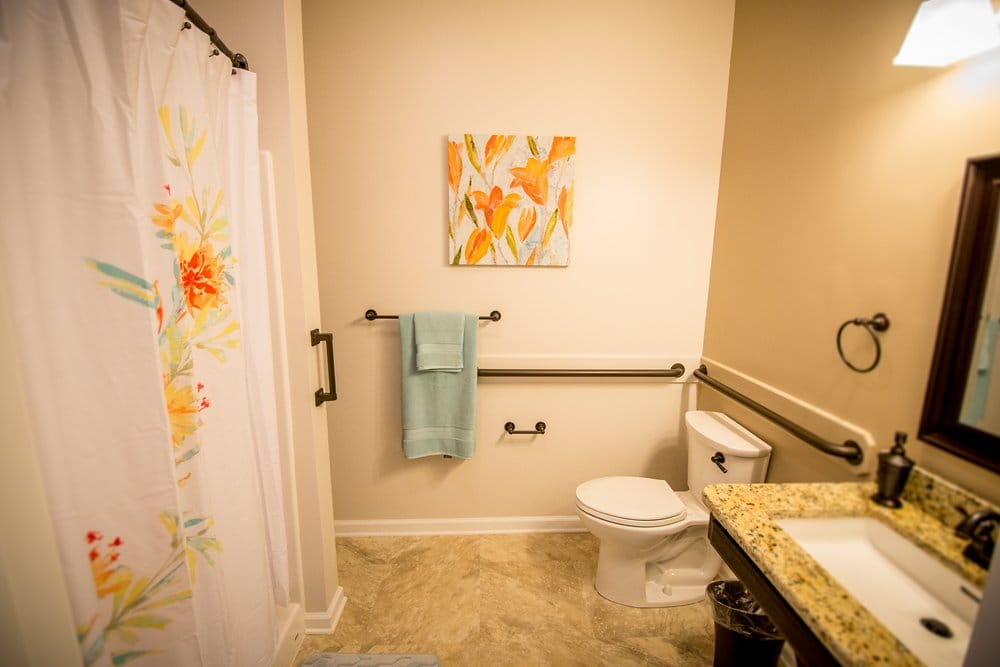
Surrounded by convenient local amenities in Bel Air, MD, Viva Senior Living at Bel Air is an idyllic haven that offers assisted living and memory care. Those with cognitive conditions receive top-tier care for their unique needs from a dedicated and well-trained team available around the clock. Purposely built private and companion suites are provided in a vibrant and welcoming environment, so residents feel at ease during their stay.
Fun events and exciting trips are conducted to keep residents active and socially connected. With freshly-prepared and healthy meals, residents have a delightful dining experience that caters to their dietary needs and preferences. Medication management and individualized care plans are provided for residents’ healthcare needs. This pet-friendly community is ideal for those needing assistance to live the best of their golden years.
The Village at Providence Point is a highly recognized continuing care retirement community in Annapolis, MD, offering independent living, memory care, and skilled nursing. The community’s lively and welcoming environment ensures older adults can live comfortably in retirement. With restaurant-style dining, housekeeping, and transportation services, residents experience worry-free living. Alongside thoughtfully curated amenities, personalized care plans are also provided, so residents can maintain their independence with ease.
Fitness classes, book clubs, and educational programs provide residents with more opportunities to continue learning and gain meaningful experiences. A hair salon, a game room, and a health center are also available, so residents can rest and interact with their surroundings. Residents also have quick access to healthcare and leisure, with Luminis Health Anne Arundel Medical Center, shops, and bus stops nearby. This retirement community continuously provides exceptional care to help older adults age gracefully, making it a great choice for senior living in Maryland.
Arden Courts are one of the only few Promedical memory care communities that provide exceptional care. The community offers an inviting atmosphere with fine hospitality; the staff is ready to attend to any need one may have with compassion and dignity. Arden Courts maintain their residents’ sense of individuality while being able to enhance their quality of life in a nurturing environment.
Services are focused on the cognitive health and overall wellness of its residents– 24-hour supervision, medication management, outside rehabilitative care, and physical therapy available; as well as reassurance and advice support, structured programs, and mobility assistance.
Frederick Health and Rehabilitation Center is where residents thrive with the support of quality services for skilled nursing and rehabilitation. It offers a warm and welcoming atmosphere where residents and staff are encouraged to create friendships and build a mutual level of trust with each other. Families can rest easy knowing their loved ones are in good hands because of the dedicated team of professionals.
Frederick Health and Rehabilitation Center aims to enhance the quality of life for its residents by ensuring that seniors can satisfy their holistic wellness. They house state-of-the-art technologies that help recover a range of medical conditions– wound care, neurological recovery, lymphedema, and pulmonary programs; as well as physical, occupational, and speech therapy.
Tranquil Loving Care sits on Quince Orchard Road in Gaithersburg’s Bridlewood neighborhood, a single-story assisted living community offering assisted living, memory care, hospice care, and respite care. The setting is moderately walkable (Walk Score 63), with some errands doable on foot and a mix of nearby amenities within reach.
Rooms come as private or semi-private. Day to day, residents can count on housekeeping and transportation services, plus recreational activities and exercise programs to fill out the calendar.
What stands out here is the range of care types offered together. Assisted living, memory care, hospice, and respite care under a single roof points to a community designed for residents whose needs may shift over time, without forcing a move elsewhere when a higher level of support becomes necessary.
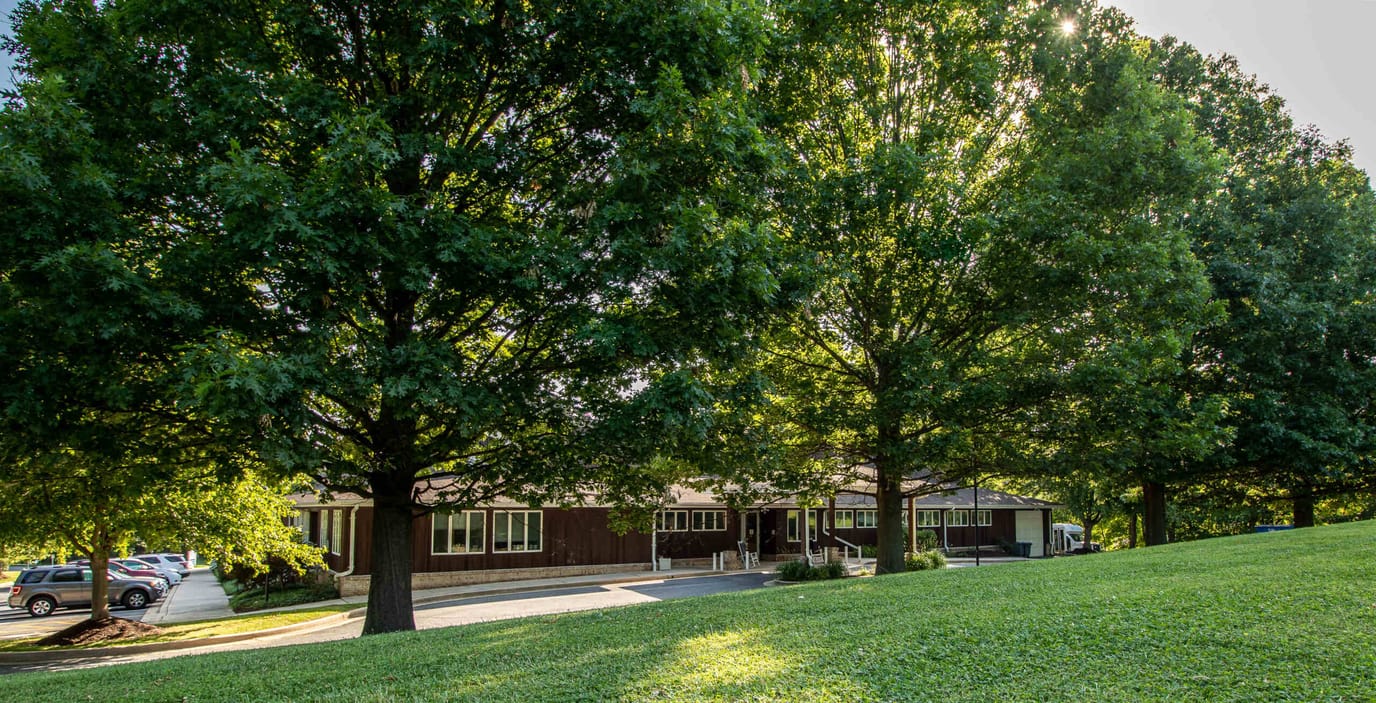
Overview of Winter Growth


Nestled in the heart of Olney, just across from MedStar Montgomery Medical Center, Winter Growth’s Olney Community offers a warm, welcoming environment where older adults can thrive with dignity, purpose, and connection. Our nonprofit has been serving families since 1979, providing Memory Care, Adult Day, and Respite Care Programs designed to meet the evolving needs of those living with Alzheimer’s, dementia, and other age-related challenges.
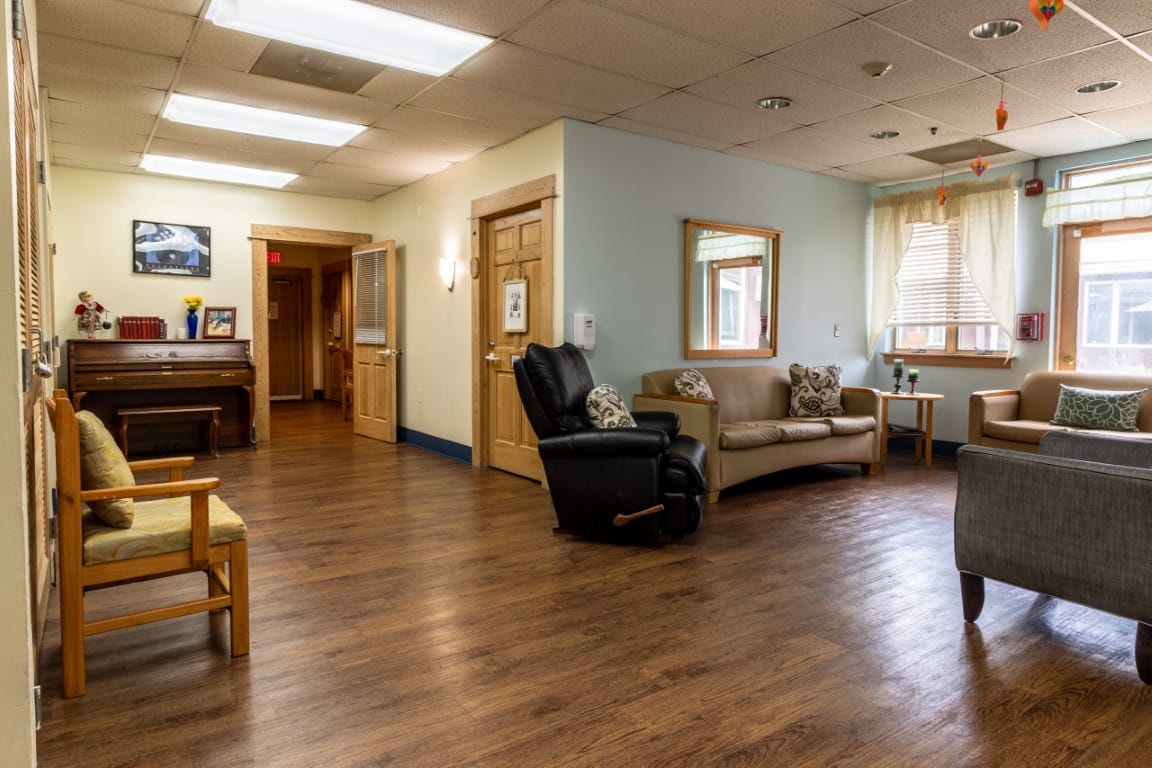
What sets Winter Growth apart is our deeply personalized approach. In our Memory Care residence, individuals receive 24/7 support in private rooms, surrounded by compassionate staff who truly get to know them. Each day is filled with engaging activities that promote cognitive, physical, and emotional wellness – from music and art to therapeutic movement and meaningful social interaction.
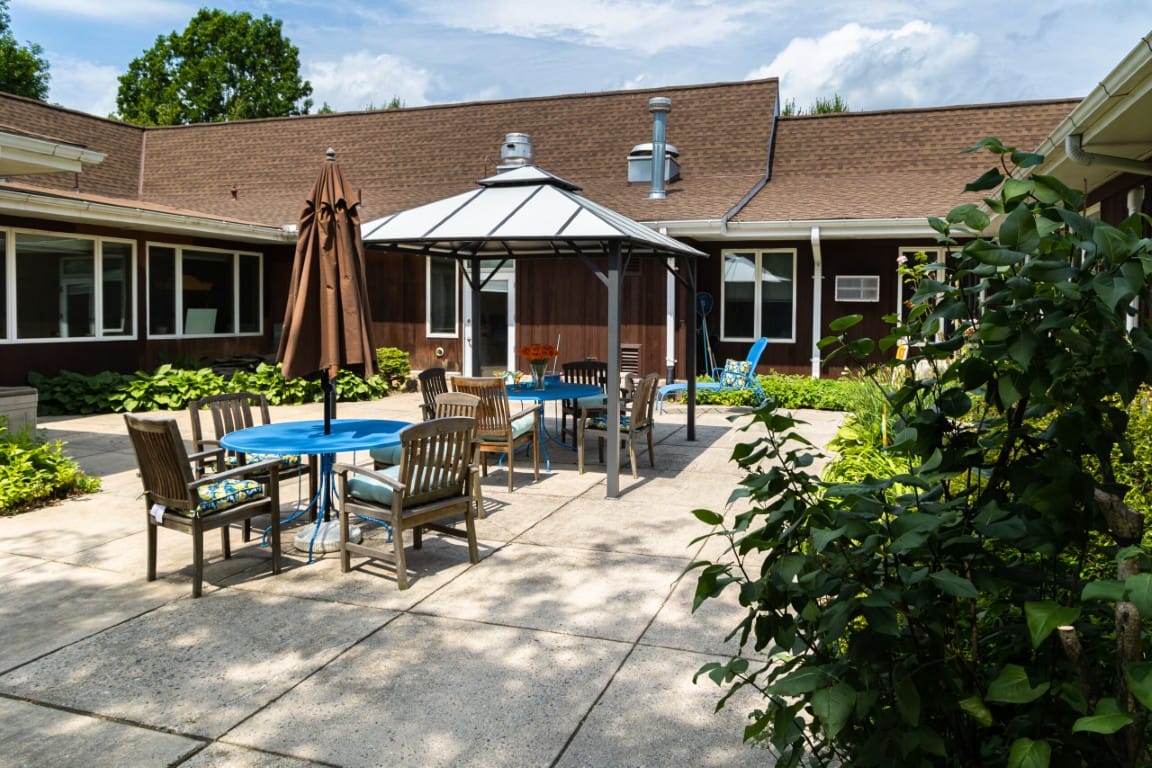
Our Adult Day Program offers a vibrant option for those who live at home but benefit from daytime structure, enrichment, and peer connection. Families gain peace of mind knowing their loved ones are in a safe, caring space, and respite care options provide short-term support when needed.
With no buy-in fees, affordable, all-inclusive pricing, and a reputation built on over 45 years of trusted care, Winter Growth’s Olney Community is here to help families navigate aging with confidence and compassion. Originally located in Montgomery County, Winter Growth has also built a community in Howard County to ensure its residents get to experience our state-of-the-art, non-profit Memory Care, Assisted Living, and Adult Day programs.
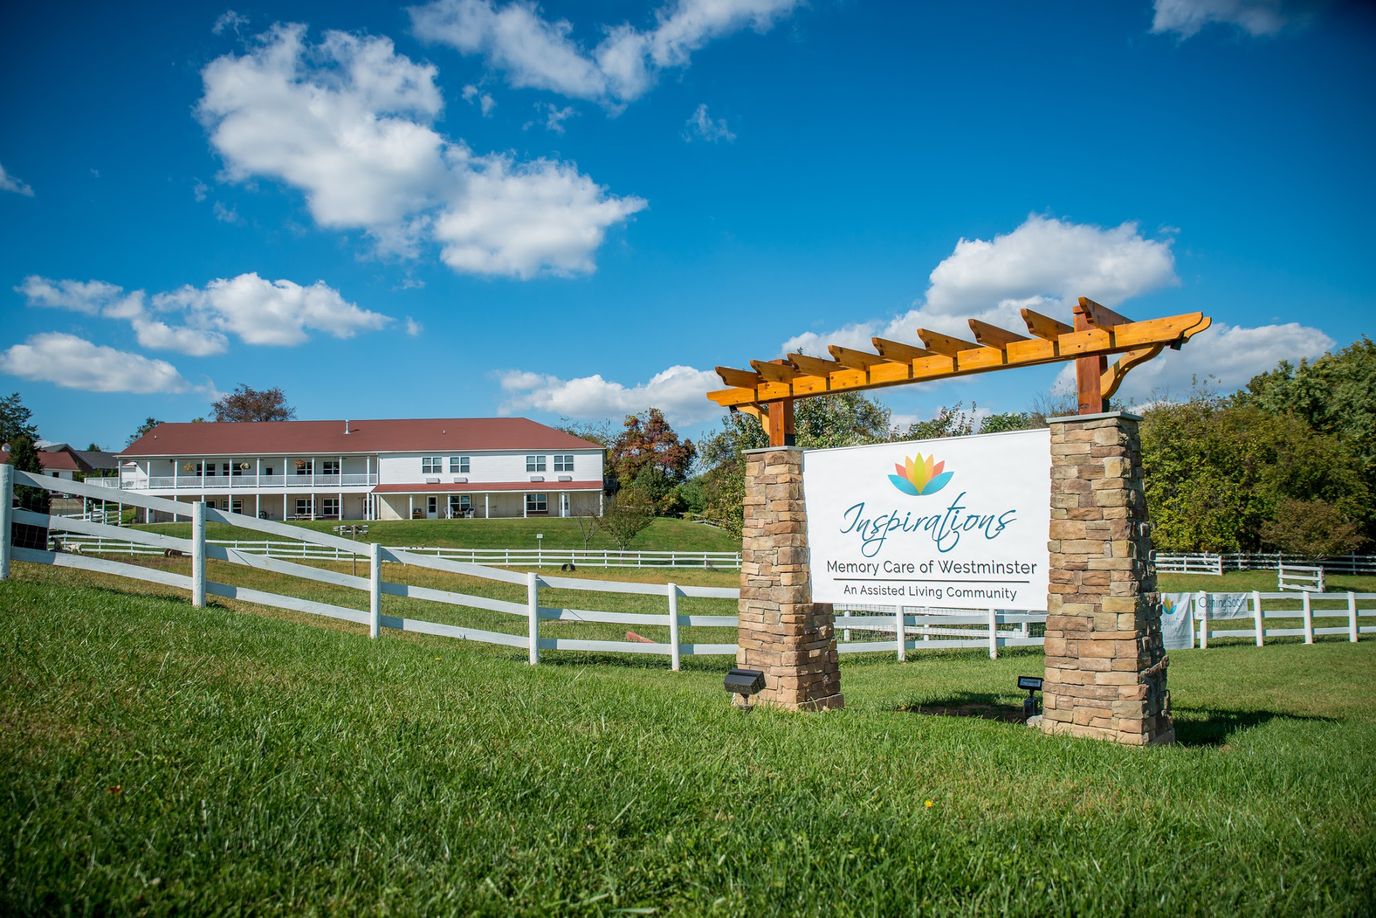
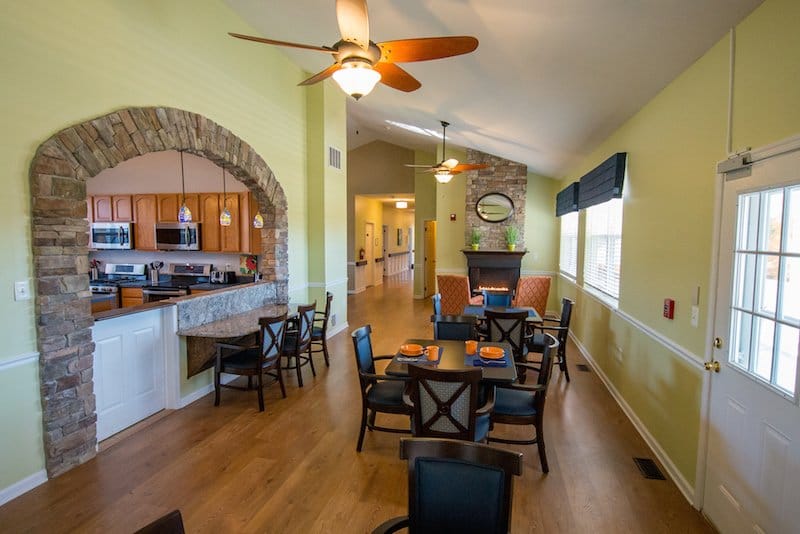
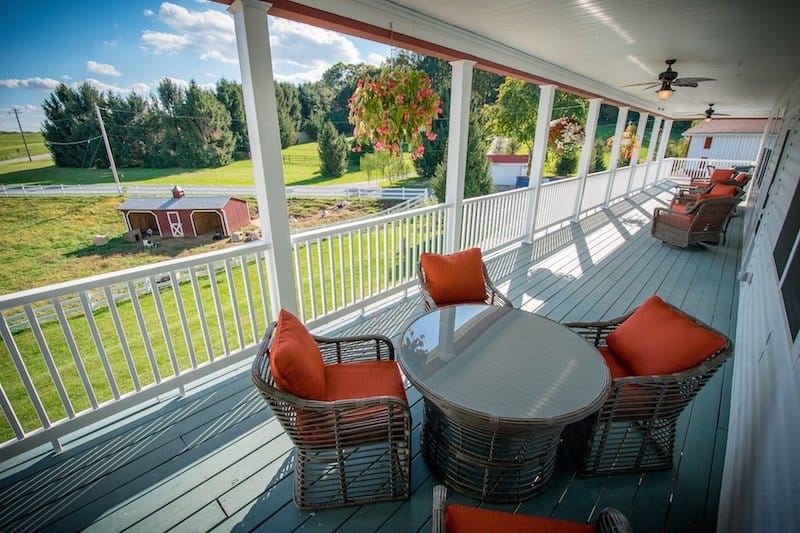
Blanketed by lush trees and vast green spaces, Inspirations Memory Care of Westminster is a peaceful community in Westminster, MD dedicated to those facing memory loss. They welcome residents into bright, colorful, and spacious accommodations that keep them cozy and safe. The community guarantees focused care and attention with its superb caregiver-to-resident ratio and customized care plans.
Taking residents’ wellness a high priority, the community regularly organizes an array of enriching activities to keep them active and healthy meals to keep them properly nourished. Additionally, their farm-like setting, secured porches, and courtyard promote relaxation and cozy spaces for gathering with friends and fellow residents. Here, residents are provided with all the care and amenities they need to live their lives as fully and comfortably as possible.
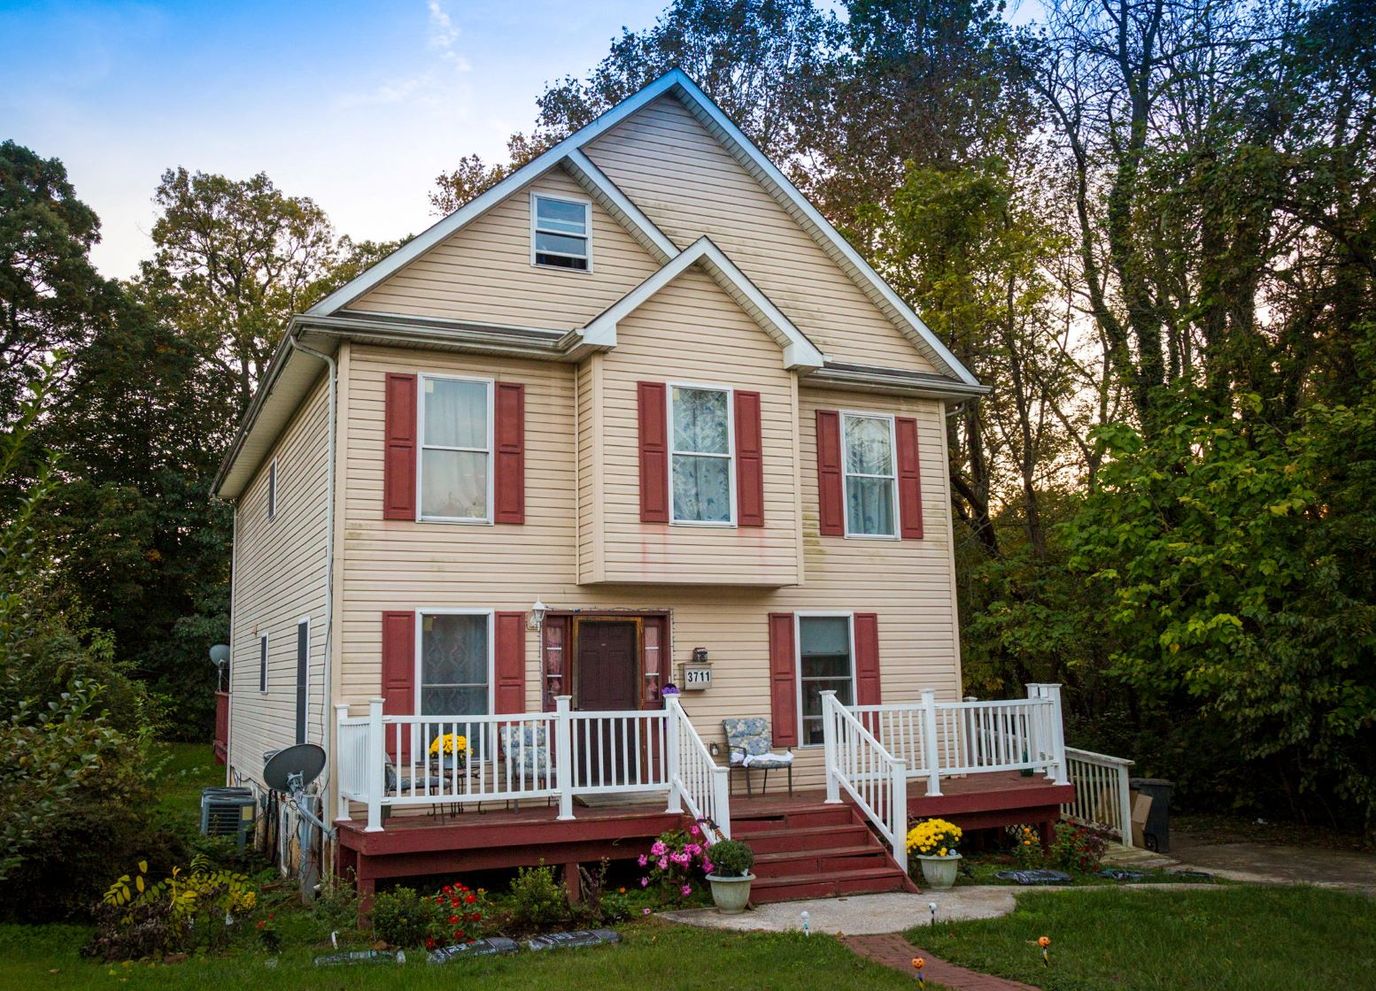
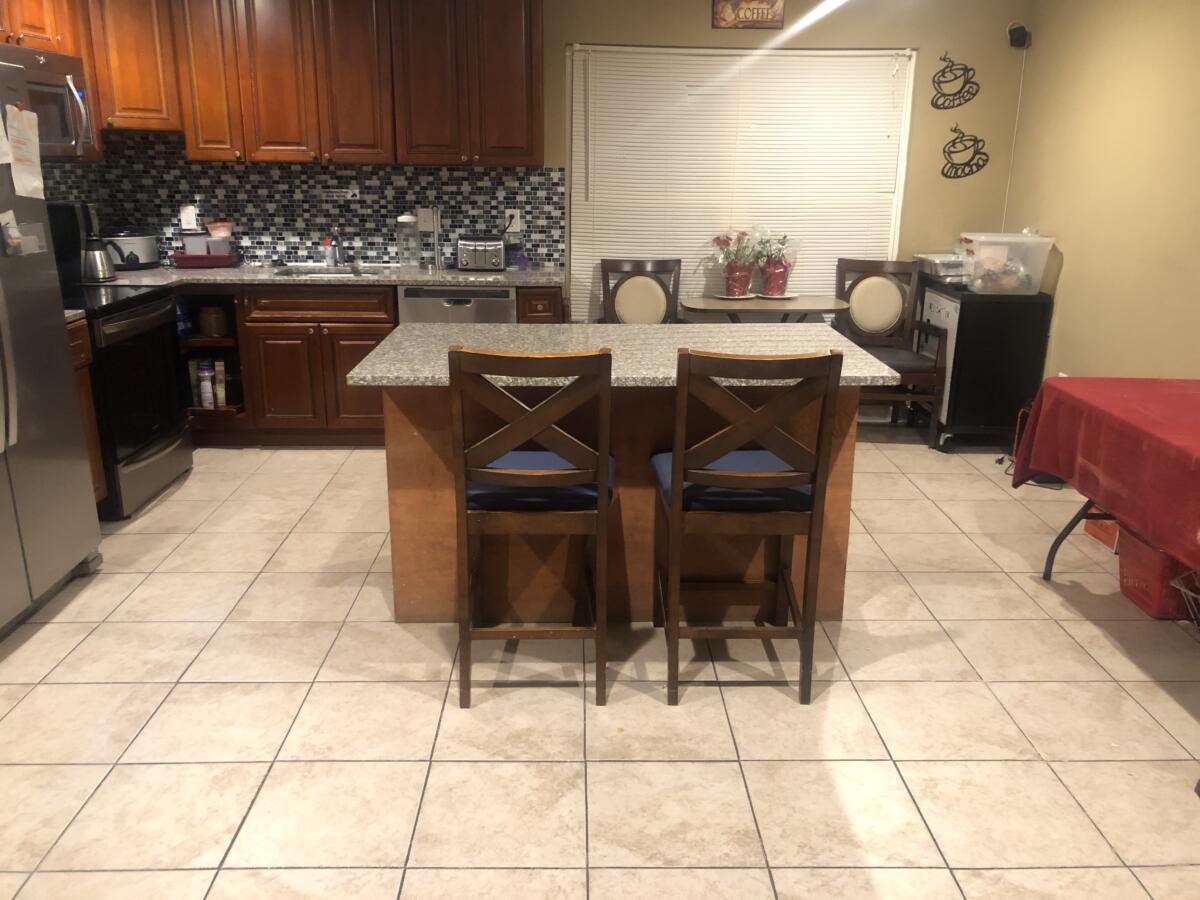
Pleasant Garden Pinewood, conveniently situated in the tranquil Pinewood Avenue, Baltimore, is a vibrant senior living community that provides assisted living in a family-like setting and within single-family homes. Dedicated to its mission, the community ensures to offer a secure, attended, comfortable, and beautiful home for its residents. Additionally, the community is committed to delivering the utmost care and catering to the immediate needs of its residents through a highly trained and dedicated team.
Having a goal to set the bar in assisted living services, this community envisions itself to become an expert and advocate in the research and practice of non-medical care and quality of life. Thus, seniors are guaranteed top-quality services and a secure living experience with Pleasant Garden Pinewoods.
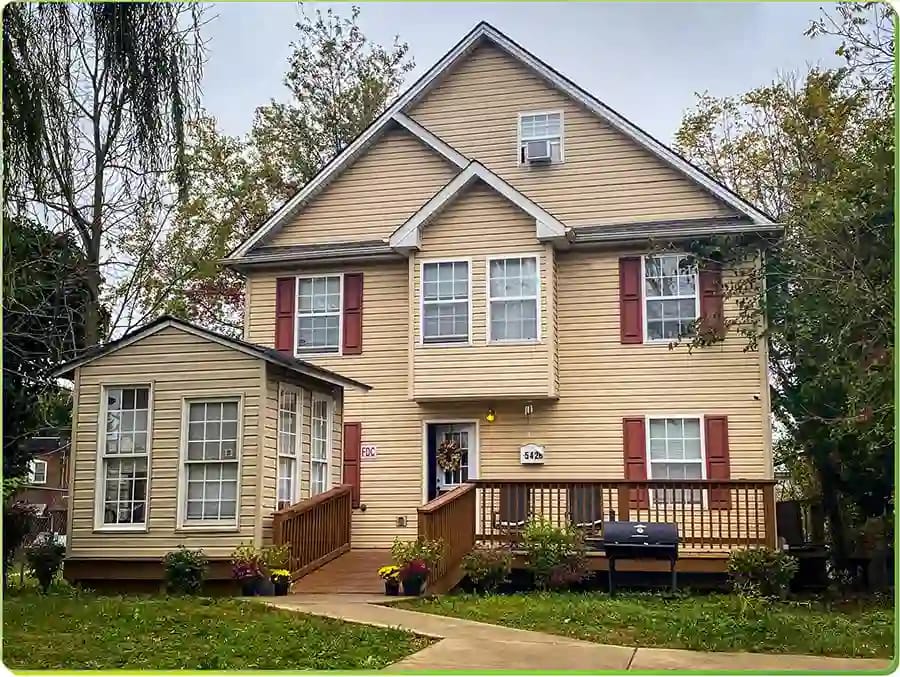
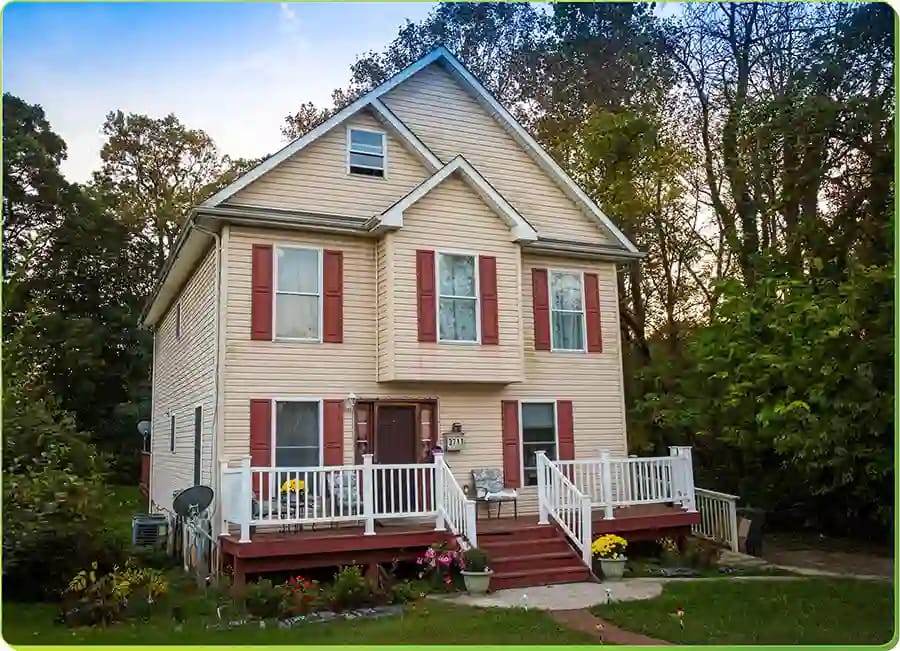
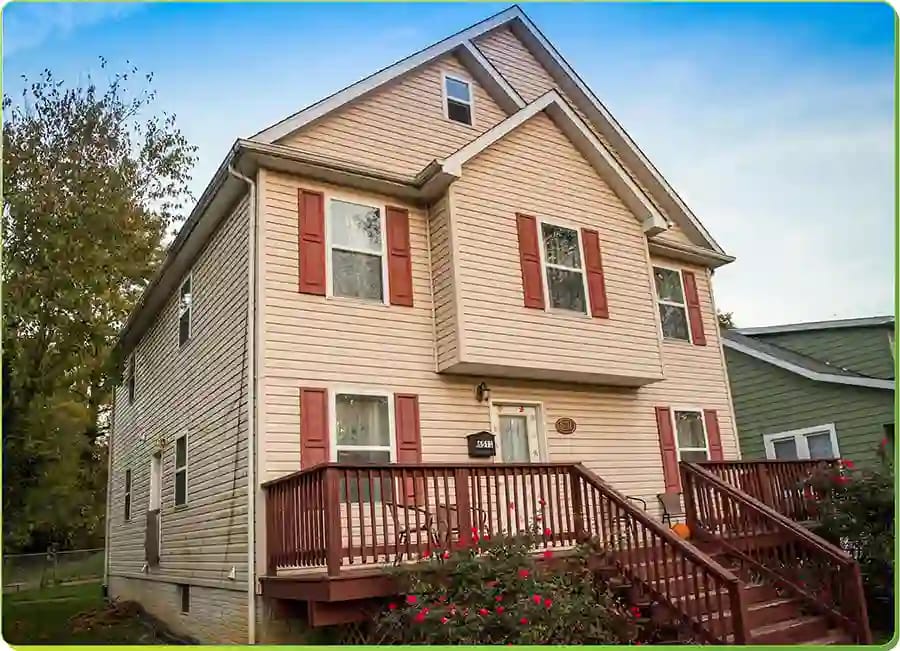
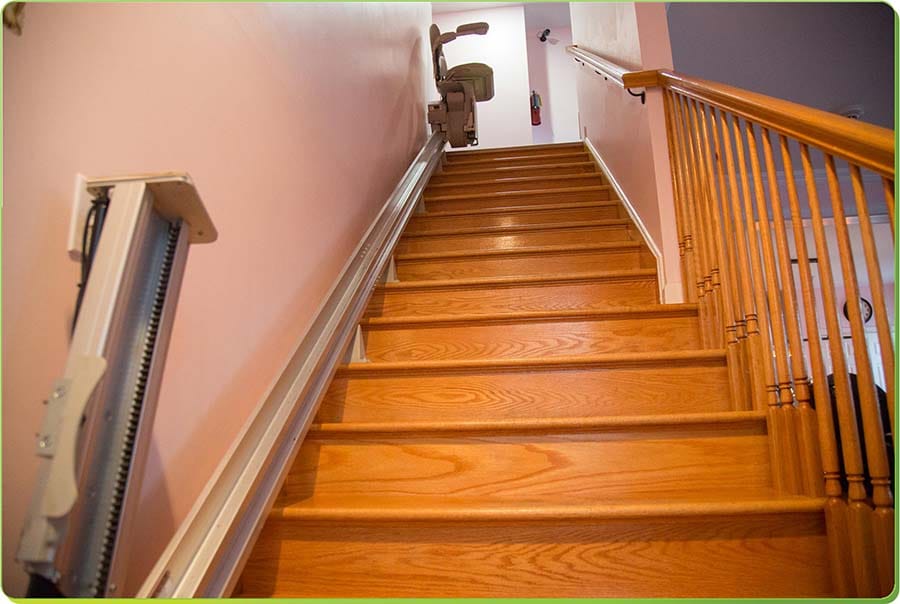
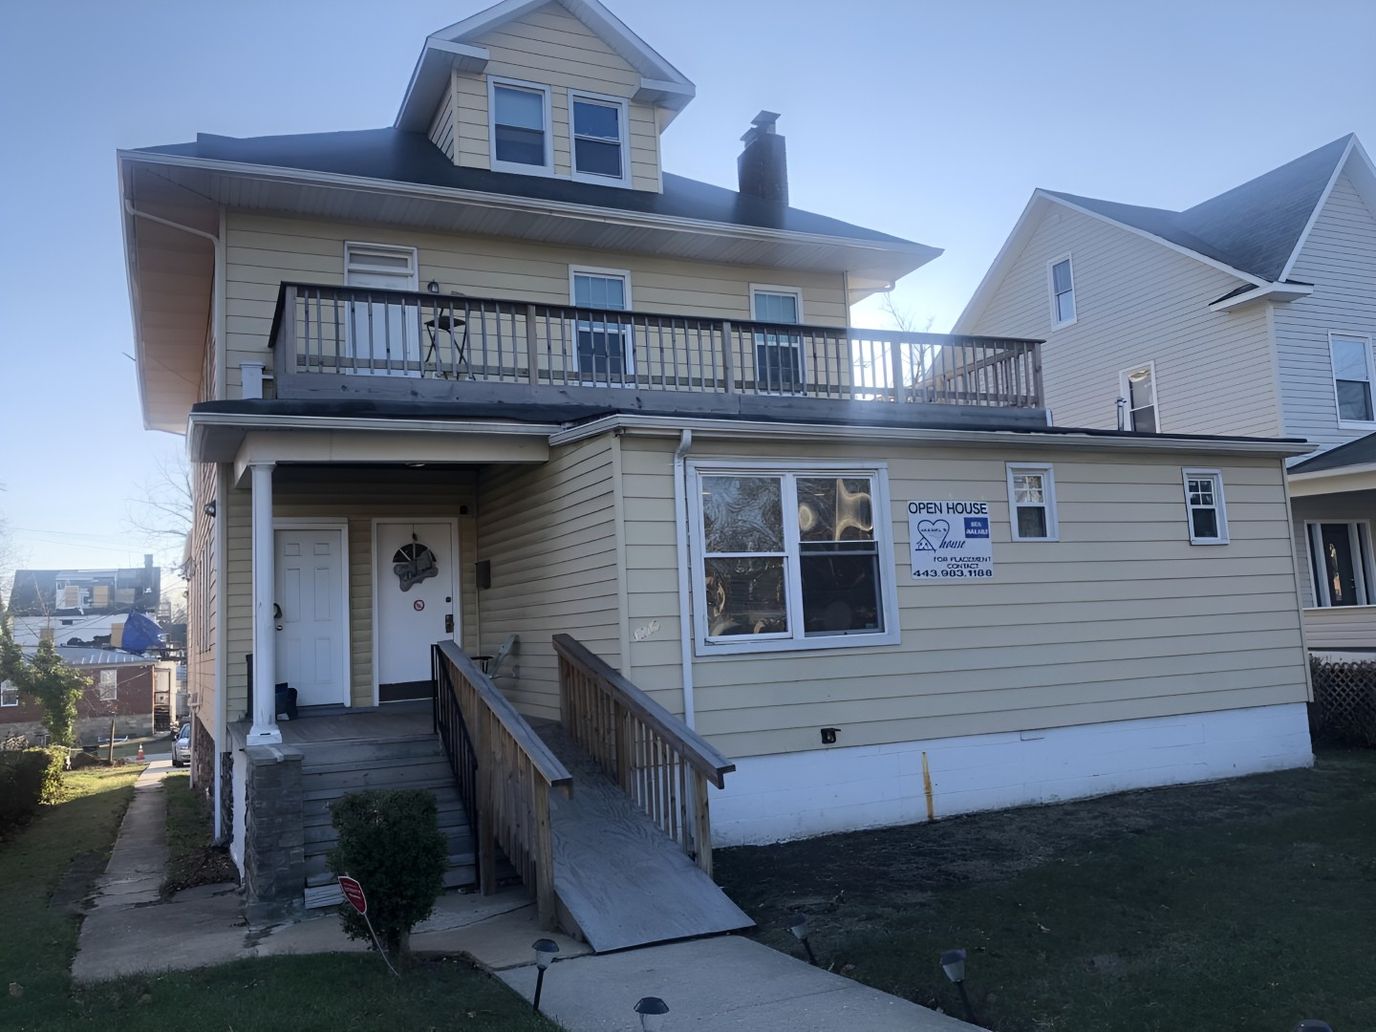
Operated by a registered nurse owner, Mabel’s House is an 8-bed assisted living and independent living community in Gwynn Oak, Maryland. The community is in a two-story residential building. It’s a small setting where personalized attention and close relationships between staff and residents are an important part of daily life. It serves older adults who need help with daily activities, those who want independent living with access to support services, residents with memory care needs, and seniors who need respite care for short-term stays.
Located on Liberty Heights Avenue, the neighborhood is very walkable. Residents have convenient access to dining, shopping, and public transportation. This location reduces isolation and makes it easier for families to visit and enjoy outings with their loved ones. The surrounding neighborhood offers the welcoming community feel that many families look for in a smaller senior living home.
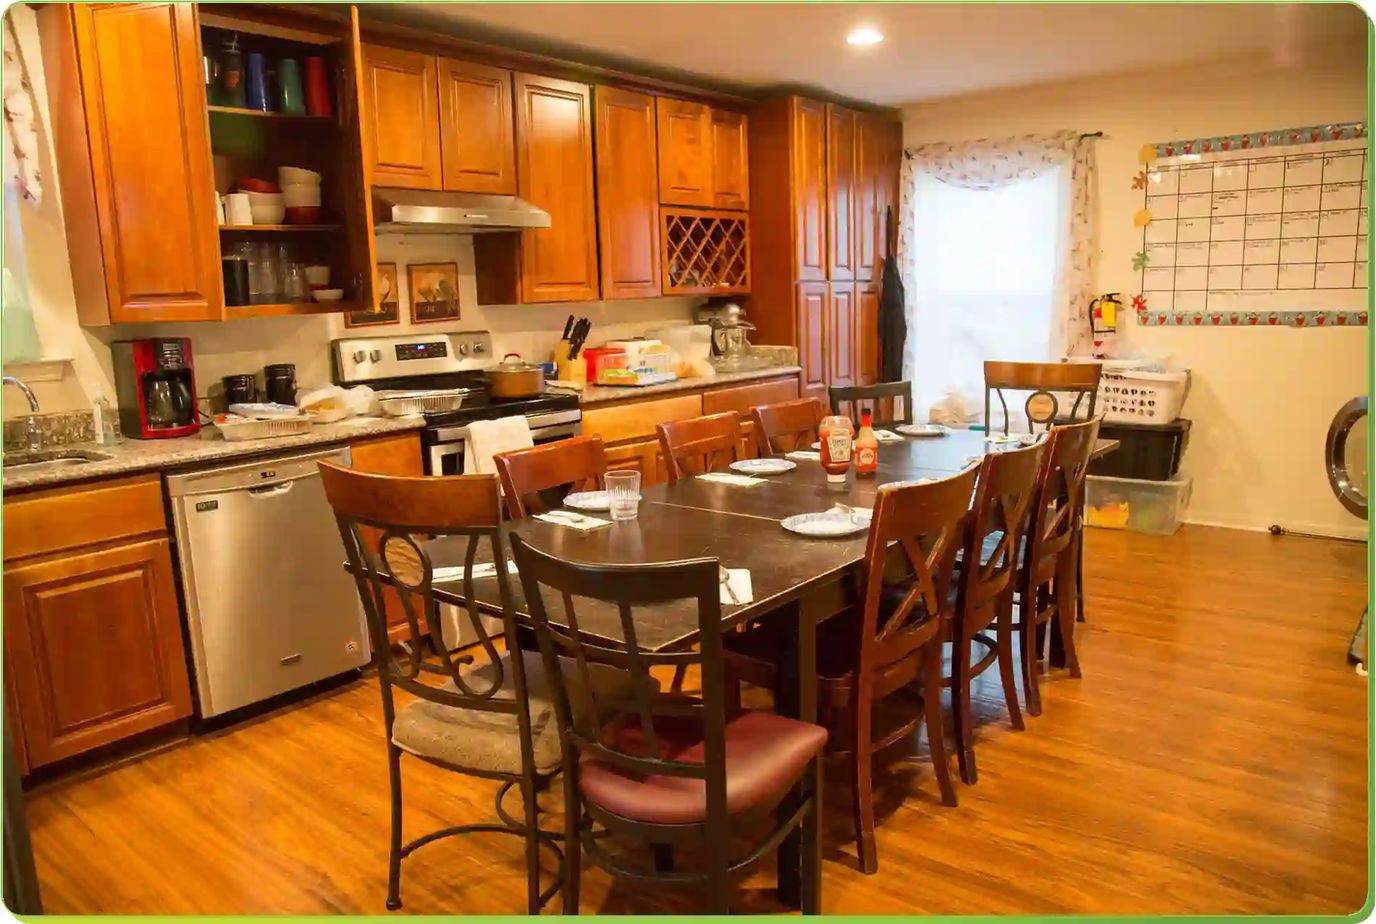
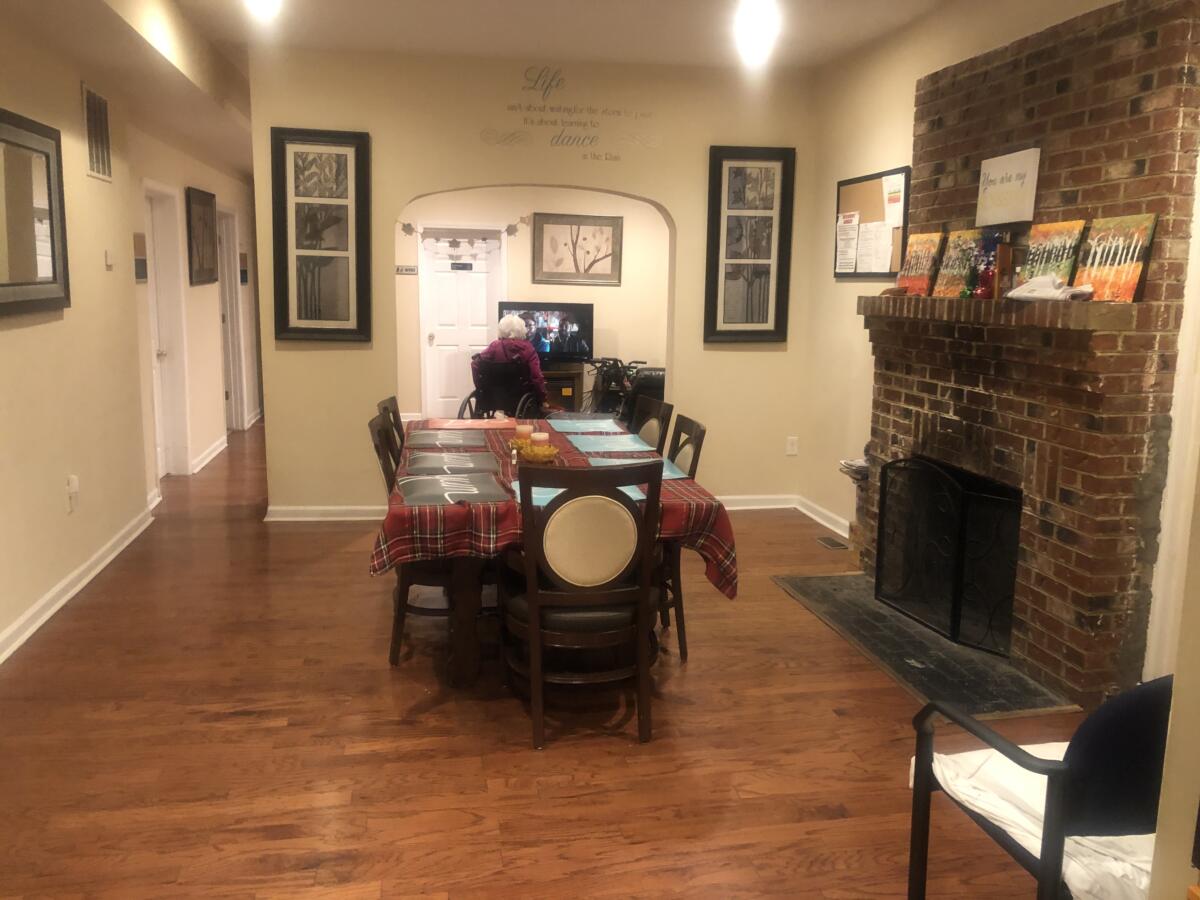
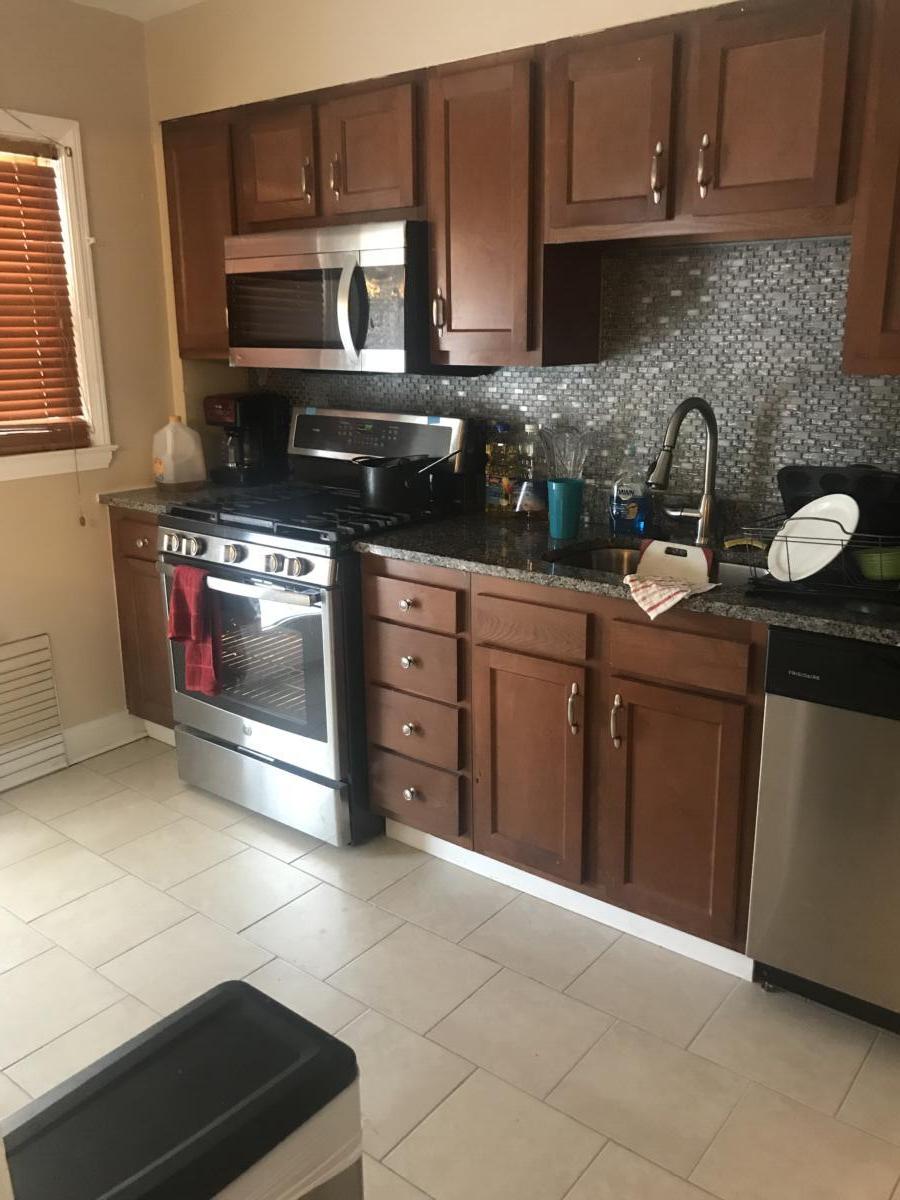
Daily life at Mabel’s House focuses on engagement and maintenance-free living. Residents can join in exercise programs and culturally enriching outings based on their interests. These help them stay active and socially connected. The community offers private and semi-private rooms, comfortable shared spaces, and household services that remove the burden of daily maintenance. Around-the-clock support is also available whenever residents need assistance.
Residents and their families value the welcoming environment and the quality of care provided. The combination of registered nurse ownership, a small community setting, and a strong focus on enrichment activities makes Mabel’s House a thoughtful choice for older adults looking for a residential assisted living community in the Baltimore area.
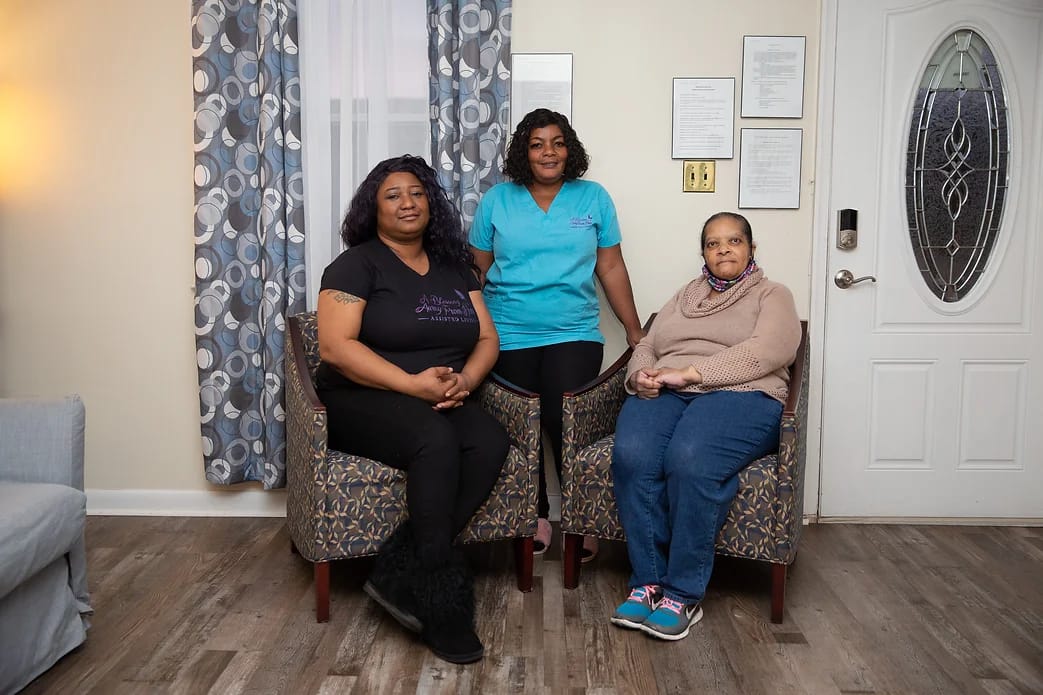
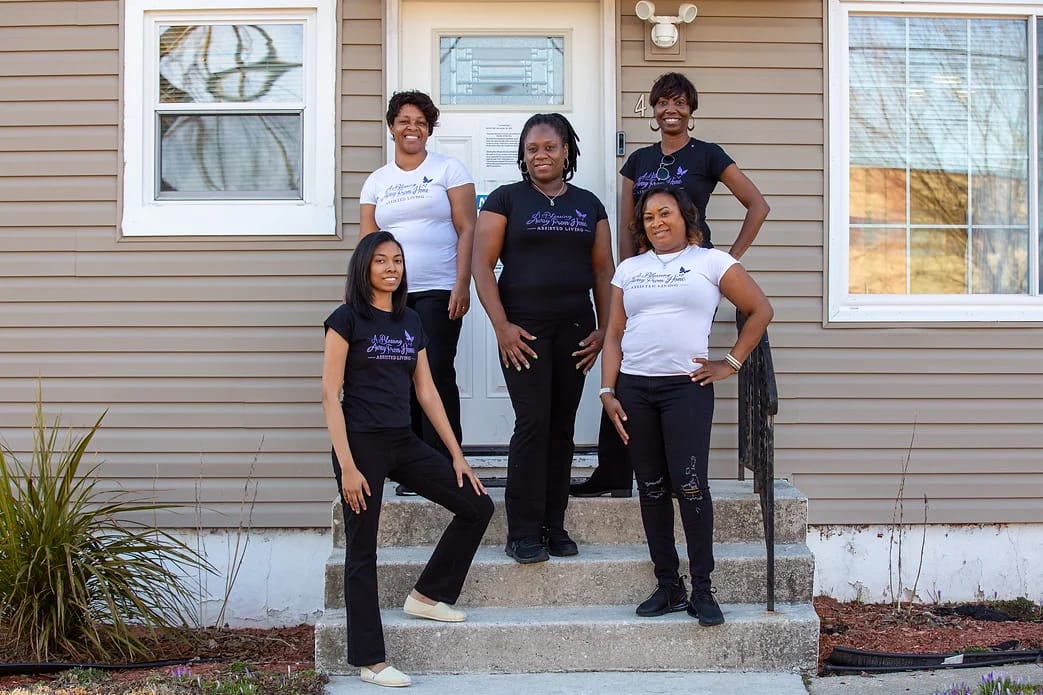
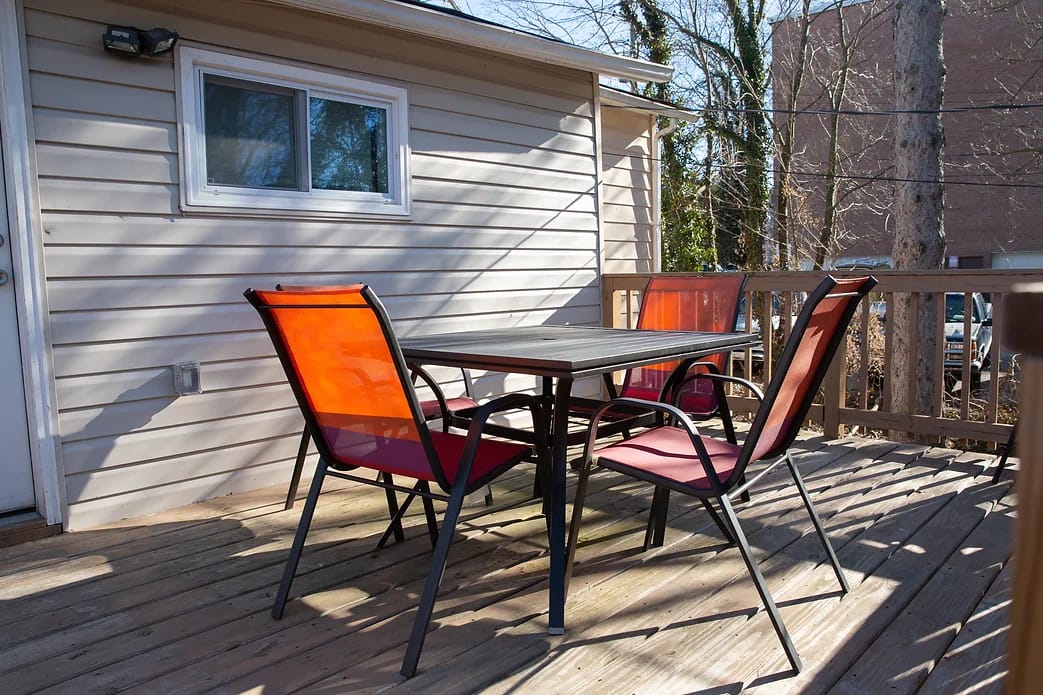
Live the lifestyle you prefer with the idyllic senior living community of A Blessing Away From Home 5 at 4114 Fordleigh Road, Baltimore, MD, which provides assisted living and memory support. Boasting a team of experienced and highly trained professionals, seniors can rest assured of receiving the highest standard of care and assistance for their every need 24/7. The community handles the housekeeping and provides safe amenities to ensure seniors enjoy a maintenance-free retirement.
Participate in exciting trips and create lasting moments with friends through a well-thought-of calendar of enjoyable activities and enriching programs. The community also ensures seniors have a satisfactory dining experience by focusing on their nutritional needs and tastes. A Blessing Away From Home 6 is a haven for seniors seeking to maximize their independence with its exceptional services.
Ranking Methodology
How we rank these memory care communities
Every community above is evaluated across six weighted categories using public data including state inspection records, review platforms, BBB profiles, and operator-published materials.
Weighting overview
- 35%Resident Experience
- 25%Regulatory
- 15%Visual Media
- 10%Website
- 10%Stability
- 5%Environment
01
Resident & Family Experience 35%
The single largest share of every ranking. Aggregated review sentiment and volume from major platforms — the closest signal to real resident experience.
- Includes
- Review Sentiment
- Review Volume
02
Regulatory & Safety Record 25%
State inspection records, citations, and complaint visits. We weight per-inspection rates more heavily than raw counts.
- Includes
- State Inspections
- Citations/Inspection
- % Inspections w/ Citations
- Complaint Visits
- Accreditations
- BBB Rating
03
Visual Media & Transparency 15%
Communities that publish high-quality visuals give families a real preview. No photos or tours = a negative transparency signal.
- Includes
- Video Tours
- Virtual Walkthroughs
- Photo Quantity
- Photo Quality
04
Website & Operator Transparency 10%
Site quality and whether the operator publishes basic accountability information — staff names, contact details, ownership.
- Includes
- Website Content
- Mobile Usability
- Staff Info Available
- Owner Info Available
05
Community Stability 10%
Operational signals indicating whether a community is well-run and meeting demand.
- Includes
- Occupancy Rate
- Bed Options
06
Environment & Pricing 5%
Walkability and pricing transparency. Walk Score is weighted higher for Independent Living than for Memory Care, where most residents do not leave unaccompanied.
- Includes
- Walk Score
- Pricing Transparency
Who we are
Your Senior Care Partner, Every Step of the Way
We help families find affordable senior communities and unlock same day discounts, Medicaid, and Medicare options tailored to your needs.
Contact us Today
Frequently Asked Questions about Memory Care in Maryland
What's the difference between assisted living and memory care in Maryland?
Assisted living in Maryland supports residents with daily activities (bathing, dressing, medication management) while preserving independence. Memory care is a specialized form of assisted living for residents living with Alzheimer's or dementia, and adds 24/7 secured environments, dementia-trained staff, and structured routines designed to reduce confusion and wandering.
Does Maryland Medicaid cover memory care?
Maryland Medicaid does not directly pay room-and-board for memory care, but most states (including Maryland) offer Home and Community-Based Services (HCBS) waivers that can offset the cost of care services delivered inside a licensed community. Eligibility, waitlists, and covered services vary — check directly with the state Medicaid agency.
What is memory care?
Memory care is a specialized form of assisted living for residents living with Alzheimer's disease or other forms of dementia, with secured environments, dementia-trained staff, and routines built to reduce confusion and wandering.
How many memory care communities are listed on this page?
This page features 327 memory care communities in Maryland. Use the filters and comparison tools above to compare ratings, amenities, and pricing.
How do I choose the right memory care community in Maryland?
Start by matching the level of care offered to the resident's current and anticipated needs, then compare licensing status, staff-to-resident ratios, recent inspection results, and pricing. Tour at least two or three communities in Maryland, talk to current residents and families, and confirm what is included in the base rate versus billed as add-on services.
What should I look for when visiting memory care communities in Maryland?
Pay attention to staff interactions with residents, cleanliness and odor, food quality at meal times, the activity calendar, and how questions about pricing and care plans are answered. Ask to see the most recent state inspection report, the move-out / level-of-care-change policy, and a sample monthly bill that lists every fee.
Updated on
