


Where in Maryland are you looking?
Browse communities by city.
AberdeenAccokeekAdelphiAnnapolisAnne Arundel CountyBaltimoreBeltsvilleBethesdaBowieCambridgeCatonsvilleChevy ChaseClintonColumbiaCoral HillsEastonElktonEllicott CityForest HillFort WashingtonFrederickGaithersburgGermantownGlen BurnieHagerstownHarford CountyHoward CountyHyattsvilleMarlboroMontgomery CountyOdentonPikesvillePotomacPrince George's CountyQueenstownRockvilleSalisburySandy SpringSeverna ParkSilver SpringTemple HillsTowsonWaldorfWashington County
Compare Assisted Living around Maryland
The information below is reported by the Maryland Department of Health, Office of Health Care Quality.
| Sunrise of Silver Spring | AL HC MC RC | Silver Spring (New Hampshire Avenue) | 84
Facility
84
MD AVG
43
Rank
#170 / 697 | Yes |
40
Facility
40
MD AVG
43
Rank
#523 / 985 | Studio / 1 Bed / 2 Bed | 24
Facility
24
MD AVG
21
Rank
#92 / 208 | - |
31% Male Residents — State Benchmarked 31% of residents are male, compared to the Maryland average of 31%. This facility caters to a majority female resident pool (69% female), consistent with the broader assisted living trend where women significantly outnumber men. |
69% Female Residents — State Benchmarked 69% of residents are female, compared to the Maryland average of 69%. Women comprise the large majority, consistent with national assisted living demographics where women live longer and enter care facilities at higher rates. |
53% White Residents — State Benchmarked 53% of residents are reported as White, compared to the Maryland average of 81%. A lower White share than the Maryland average — the community may draw a more diverse resident mix relative to other facilities in Maryland. |
39% African American Residents — State Benchmarked 39% of residents are reported as African American or Black, compared to the Maryland average of 13%. A higher African American share than the typical Maryland average — useful context when comparing cultural fit and community composition. |
9% Other Ethnicity Residents — State Benchmarked 9% of residents fall into categories other than White or African American (combined), compared to the Maryland average of 6%. This column aggregates Hispanic, Asian, multiracial, and any other labeled groups that are not classified as White or African American. Reported subgroups in this total: Asian (4%), Hawaiian/Pacific Islander (3%), Hispanic (1%). |
4% Residents Age 65–74 — State Benchmarked 4% of residents are 65–74, compared to the Maryland average of 13%. Fewer younger seniors suggests the resident population skews older, likely requiring higher acuity care and more hands-on support. |
43% Residents Age 75–84 — State Benchmarked 43% of residents are 75–84, compared to the Maryland average of 31%. A high concentration in this mid-range bracket, where residents typically need moderate support with daily activities. |
37% Residents Age 85–94 — State Benchmarked 37% of residents are 85–94, compared to the Maryland average of 44%. The population here skews younger than the statewide norm, which may indicate a more active, lower-acuity community. |
14% Residents Age 95+ — State Benchmarked 14% of residents are 95 or older, compared to the Maryland average of 16%. In line with the statewide profile for the oldest resident bracket. |
| Brightview Annapolis | AL IL MC | Annapolis | 85
Facility
85
MD AVG
43
Rank
#168 / 697 | Yes |
34
Facility
34
MD AVG
43
Rank
#590 / 985 | Studio / 1 Bed / 2 Bed | 8
Facility
8
MD AVG
21
Rank
#162 / 208 | - |
27% Male Residents — State Benchmarked 27% of residents are male, compared to the Maryland average of 31%. This facility caters to a majority female resident pool (73% female), consistent with the broader assisted living trend where women significantly outnumber men. |
73% Female Residents — State Benchmarked 73% of residents are female, compared to the Maryland average of 69%. Women comprise the large majority, consistent with national assisted living demographics where women live longer and enter care facilities at higher rates. |
97% White Residents — State Benchmarked 97% of residents are reported as White, compared to the Maryland average of 81%. A higher White share than is typical for assisted living in Maryland in this dataset — compare with peer facilities for local context. |
0% African American Residents — State Benchmarked 0% of residents are reported as African American or Black, compared to the Maryland average of 13%. A lower African American share than is typical in Maryland; local markets still vary widely. |
3% Other Ethnicity Residents — State Benchmarked 3% of residents fall into categories other than White or African American (combined), compared to the Maryland average of 6%. This column aggregates Hispanic, Asian, multiracial, and any other labeled groups that are not classified as White or African American. Reported subgroups in this total: Hispanic (3%). |
3% Residents Age 65–74 — State Benchmarked 3% of residents are 65–74, compared to the Maryland average of 13%. Fewer younger seniors suggests the resident population skews older, likely requiring higher acuity care and more hands-on support. |
27% Residents Age 75–84 — State Benchmarked 27% of residents are 75–84, compared to the Maryland average of 31%. This is the second most common age bracket in assisted living, representing residents with moderate care needs. |
59% Residents Age 85–94 — State Benchmarked 59% of residents are 85–94, compared to the Maryland average of 44%. A high concentration of very elderly residents signals a higher-acuity facility with experience caring for advanced age-related needs. |
9% Residents Age 95+ — State Benchmarked 9% of residents are 95 or older, compared to the Maryland average of 16%. Most residents here have not yet reached the oldest-old bracket, suggesting a younger overall community. |
| Modena Reserve at Kensington | AL IL MC | Kensington (Metropolitan Avenue) | 80
Facility
80
MD AVG
43
Rank
#176 / 697 | No |
85
Facility
85
MD AVG
43
Rank
#54 / 985 | - | 4
Facility
4
MD AVG
21
Rank
#191 / 208 | - | - | - | - | - | - | - | - | - | - |
| Bay Village of Annapolis | AL NH | Annapolis | 88
Facility
88
MD AVG
43
Rank
#162 / 697 | Yes |
75
Facility
75
MD AVG
43
Rank
#131 / 985 | Studio / 1 Bed | 5
Facility
5
MD AVG
21
Rank
#182 / 208 | - |
32% Male Residents — State Benchmarked 32% of residents are male, compared to the Maryland average of 31%. This facility caters to a majority female resident pool (68% female), consistent with the broader assisted living trend where women significantly outnumber men. |
68% Female Residents — State Benchmarked 68% of residents are female, compared to the Maryland average of 69%. Women comprise the large majority, consistent with national assisted living demographics where women live longer and enter care facilities at higher rates. |
99% White Residents — State Benchmarked 99% of residents are reported as White, compared to the Maryland average of 81%. A higher White share than is typical for assisted living in Maryland in this dataset — compare with peer facilities for local context. |
0% African American Residents — State Benchmarked 0% of residents are reported as African American or Black, compared to the Maryland average of 13%. A lower African American share than is typical in Maryland; local markets still vary widely. |
1% Other Ethnicity Residents — State Benchmarked 1% of residents fall into categories other than White or African American (combined), compared to the Maryland average of 6%. This column aggregates Hispanic, Asian, multiracial, and any other labeled groups that are not classified as White or African American. Reported subgroups in this total: Hispanic (1%). |
14% Residents Age 65–74 — State Benchmarked 14% of residents are 65–74, compared to the Maryland average of 13%. In line with the statewide profile for this youngest senior bracket in assisted living. |
28% Residents Age 75–84 — State Benchmarked 28% of residents are 75–84, compared to the Maryland average of 31%. This is the second most common age bracket in assisted living, representing residents with moderate care needs. |
50% Residents Age 85–94 — State Benchmarked 50% of residents are 85–94, compared to the Maryland average of 44%. A high concentration of very elderly residents signals a higher-acuity facility with experience caring for advanced age-related needs. |
8% Residents Age 95+ — State Benchmarked 8% of residents are 95 or older, compared to the Maryland average of 16%. Most residents here have not yet reached the oldest-old bracket, suggesting a younger overall community. |
| Brightview Rolling Hills | AL MC | Catonsville (College Hills) | 81
Facility
81
MD AVG
43
Rank
#174 / 697 | Yes |
19
Facility
19
MD AVG
43
Rank
#746 / 985 | Studio / 1 Bed /2 Bed | 8
Facility
8
MD AVG
21
Rank
#162 / 208 | - |
16% Male Residents — State Benchmarked 16% of residents are male, compared to the Maryland average of 31%. This facility caters to a majority female resident pool (84% female), consistent with the broader assisted living trend where women significantly outnumber men. |
84% Female Residents — State Benchmarked 84% of residents are female, compared to the Maryland average of 69%. Women comprise the large majority, consistent with national assisted living demographics where women live longer and enter care facilities at higher rates. |
95% White Residents — State Benchmarked 95% of residents are reported as White, compared to the Maryland average of 81%. A higher White share than is typical for assisted living in Maryland in this dataset — compare with peer facilities for local context. |
3% African American Residents — State Benchmarked 3% of residents are reported as African American or Black, compared to the Maryland average of 13%. A lower African American share than is typical in Maryland; local markets still vary widely. |
2% Other Ethnicity Residents — State Benchmarked 2% of residents fall into categories other than White or African American (combined), compared to the Maryland average of 6%. This column aggregates Hispanic, Asian, multiracial, and any other labeled groups that are not classified as White or African American. Reported subgroups in this total: Asian (2%). | - |
8% Residents Age 75–84 — State Benchmarked 8% of residents are 75–84, compared to the Maryland average of 31%. Below the state norm — the resident mix may skew either younger or older than this typical middle bracket. |
83% Residents Age 85–94 — State Benchmarked 83% of residents are 85–94, compared to the Maryland average of 44%. A high concentration of very elderly residents signals a higher-acuity facility with experience caring for advanced age-related needs. |
10% Residents Age 95+ — State Benchmarked 10% of residents are 95 or older, compared to the Maryland average of 16%. Most residents here have not yet reached the oldest-old bracket, suggesting a younger overall community. |
| Brightview Mays Chapel Ridge | AL IL MC | Timonium (Dixon Hill) | 89
Facility
89
MD AVG
43
Rank
#160 / 697 | No |
52
Facility
52
MD AVG
43
Rank
#402 / 985 | Studio / 1 Bed / 2 Bed | 50
Facility
50
MD AVG
21
Rank
#1 / 208 | A+ |
13% Male Residents — State Benchmarked 13% of residents are male, compared to the Maryland average of 31%. This facility caters to a majority female resident pool (87% female), consistent with the broader assisted living trend where women significantly outnumber men. |
87% Female Residents — State Benchmarked 87% of residents are female, compared to the Maryland average of 69%. Women comprise the large majority, consistent with national assisted living demographics where women live longer and enter care facilities at higher rates. |
99% White Residents — State Benchmarked 99% of residents are reported as White, compared to the Maryland average of 81%. A higher White share than is typical for assisted living in Maryland in this dataset — compare with peer facilities for local context. |
0% African American Residents — State Benchmarked 0% of residents are reported as African American or Black, compared to the Maryland average of 13%. A lower African American share than is typical in Maryland; local markets still vary widely. |
1% Other Ethnicity Residents — State Benchmarked 1% of residents fall into categories other than White or African American (combined), compared to the Maryland average of 6%. This column aggregates Hispanic, Asian, multiracial, and any other labeled groups that are not classified as White or African American. Reported subgroups in this total: Asian (1%). |
3% Residents Age 65–74 — State Benchmarked 3% of residents are 65–74, compared to the Maryland average of 13%. Fewer younger seniors suggests the resident population skews older, likely requiring higher acuity care and more hands-on support. |
30% Residents Age 75–84 — State Benchmarked 30% of residents are 75–84, compared to the Maryland average of 31%. This is the second most common age bracket in assisted living, representing residents with moderate care needs. |
48% Residents Age 85–94 — State Benchmarked 48% of residents are 85–94, compared to the Maryland average of 44%. This is typically the most common age bracket in assisted living — this facility is in line with the statewide norm. |
18% Residents Age 95+ — State Benchmarked 18% of residents are 95 or older, compared to the Maryland average of 16%. In line with the statewide profile for the oldest resident bracket. |
| Brightview Crofton Riverwalk | AL IL MC | Crofton | 92
Facility
92
MD AVG
43
Rank
#155 / 697 | Yes |
45
Facility
45
MD AVG
43
Rank
#475 / 985 | Studio / 1 Bed / 2 Bed | 6
Facility
6
MD AVG
21
Rank
#176 / 208 | - |
27% Male Residents — State Benchmarked 27% of residents are male, compared to the Maryland average of 31%. This facility caters to a majority female resident pool (73% female), consistent with the broader assisted living trend where women significantly outnumber men. |
73% Female Residents — State Benchmarked 73% of residents are female, compared to the Maryland average of 69%. Women comprise the large majority, consistent with national assisted living demographics where women live longer and enter care facilities at higher rates. |
0% White Residents — State Benchmarked 0% of residents are reported as White, compared to the Maryland average of 81%. A lower White share than the Maryland average — the community may draw a more diverse resident mix relative to other facilities in Maryland. |
0% African American Residents — State Benchmarked 0% of residents are reported as African American or Black, compared to the Maryland average of 13%. A lower African American share than is typical in Maryland; local markets still vary widely. |
100% Other Ethnicity Residents — State Benchmarked 100% of residents fall into categories other than White or African American (combined), compared to the Maryland average of 6%. This column aggregates Hispanic, Asian, multiracial, and any other labeled groups that are not classified as White or African American. Reported subgroups in this total: Other (100%). | - | - | - | - |
| Sunrise of Frederick | AL MC | Frederick (Waterford) | 88
Facility
88
MD AVG
43
Rank
#162 / 697 | Yes |
62
Facility
62
MD AVG
43
Rank
#286 / 985 | Studio / Suite / 2 Bed | 45
Facility
45
MD AVG
21
Rank
#4 / 208 | A- |
31% Male Residents — State Benchmarked 31% of residents are male, compared to the Maryland average of 31%. This facility caters to a majority female resident pool (69% female), consistent with the broader assisted living trend where women significantly outnumber men. |
69% Female Residents — State Benchmarked 69% of residents are female, compared to the Maryland average of 69%. Women comprise the large majority, consistent with national assisted living demographics where women live longer and enter care facilities at higher rates. |
97% White Residents — State Benchmarked 97% of residents are reported as White, compared to the Maryland average of 81%. A higher White share than is typical for assisted living in Maryland in this dataset — compare with peer facilities for local context. |
2% African American Residents — State Benchmarked 2% of residents are reported as African American or Black, compared to the Maryland average of 13%. A lower African American share than is typical in Maryland; local markets still vary widely. |
2% Other Ethnicity Residents — State Benchmarked 2% of residents fall into categories other than White or African American (combined), compared to the Maryland average of 6%. This column aggregates Hispanic, Asian, multiracial, and any other labeled groups that are not classified as White or African American. Reported subgroups in this total: Hispanic (2%). |
10% Residents Age 65–74 — State Benchmarked 10% of residents are 65–74, compared to the Maryland average of 13%. Fewer younger seniors suggests the resident population skews older, likely requiring higher acuity care and more hands-on support. |
34% Residents Age 75–84 — State Benchmarked 34% of residents are 75–84, compared to the Maryland average of 31%. This is the second most common age bracket in assisted living, representing residents with moderate care needs. |
48% Residents Age 85–94 — State Benchmarked 48% of residents are 85–94, compared to the Maryland average of 44%. This is typically the most common age bracket in assisted living — this facility is in line with the statewide norm. |
6% Residents Age 95+ — State Benchmarked 6% of residents are 95 or older, compared to the Maryland average of 16%. Most residents here have not yet reached the oldest-old bracket, suggesting a younger overall community. |
| Sunrise of Rockville | AL | Rockville (Baltimore Road) | 89
Facility
89
MD AVG
43
Rank
#160 / 697 | Yes |
89
Facility
89
MD AVG
43
Rank
#32 / 985 | Studio / 1 Bed / 2 Bed | 45
Facility
45
MD AVG
21
Rank
#4 / 208 | A- |
23% Male Residents — State Benchmarked 23% of residents are male, compared to the Maryland average of 31%. This facility caters to a majority female resident pool (77% female), consistent with the broader assisted living trend where women significantly outnumber men. |
77% Female Residents — State Benchmarked 77% of residents are female, compared to the Maryland average of 69%. Women comprise the large majority, consistent with national assisted living demographics where women live longer and enter care facilities at higher rates. |
87% White Residents — State Benchmarked 87% of residents are reported as White, compared to the Maryland average of 81%. Close to the average for this category among assisted living facilities in Maryland with reported race/ethnicity data. |
2% African American Residents — State Benchmarked 2% of residents are reported as African American or Black, compared to the Maryland average of 13%. A lower African American share than is typical in Maryland; local markets still vary widely. |
11% Other Ethnicity Residents — State Benchmarked 11% of residents fall into categories other than White or African American (combined), compared to the Maryland average of 6%. This column aggregates Hispanic, Asian, multiracial, and any other labeled groups that are not classified as White or African American. Reported subgroups in this total: Mixed Race (6%), Hispanic (3%), Asian (2%). |
3% Residents Age 65–74 — State Benchmarked 3% of residents are 65–74, compared to the Maryland average of 13%. Fewer younger seniors suggests the resident population skews older, likely requiring higher acuity care and more hands-on support. |
31% Residents Age 75–84 — State Benchmarked 31% of residents are 75–84, compared to the Maryland average of 31%. This is the second most common age bracket in assisted living, representing residents with moderate care needs. |
56% Residents Age 85–94 — State Benchmarked 56% of residents are 85–94, compared to the Maryland average of 44%. A high concentration of very elderly residents signals a higher-acuity facility with experience caring for advanced age-related needs. |
10% Residents Age 95+ — State Benchmarked 10% of residents are 95 or older, compared to the Maryland average of 16%. Most residents here have not yet reached the oldest-old bracket, suggesting a younger overall community. |
| Arbor Terrace at Waugh Chapel | AL MC | Gambrills (Waugh Chapel Towne Centre) | 96
Facility
96
MD AVG
43
Rank
#140 / 697 | No |
47
Facility
47
MD AVG
43
Rank
#459 / 985 | - | 4
Facility
4
MD AVG
21
Rank
#191 / 208 | A+ |
30% Male Residents — State Benchmarked 30% of residents are male, compared to the Maryland average of 31%. This facility caters to a majority female resident pool (70% female), consistent with the broader assisted living trend where women significantly outnumber men. |
70% Female Residents — State Benchmarked 70% of residents are female, compared to the Maryland average of 69%. Women comprise the large majority, consistent with national assisted living demographics where women live longer and enter care facilities at higher rates. |
86% White Residents — State Benchmarked 86% of residents are reported as White, compared to the Maryland average of 81%. Close to the average for this category among assisted living facilities in Maryland with reported race/ethnicity data. |
12% African American Residents — State Benchmarked 12% of residents are reported as African American or Black, compared to the Maryland average of 13%. In line with the Maryland average for African American residents among facilities reporting this breakdown. |
3% Other Ethnicity Residents — State Benchmarked 3% of residents fall into categories other than White or African American (combined), compared to the Maryland average of 6%. This column aggregates Hispanic, Asian, multiracial, and any other labeled groups that are not classified as White or African American. Reported subgroups in this total: Asian (1%), Hawaiian/Pacific Islander (1%). |
10% Residents Age 65–74 — State Benchmarked 10% of residents are 65–74, compared to the Maryland average of 13%. Fewer younger seniors suggests the resident population skews older, likely requiring higher acuity care and more hands-on support. |
43% Residents Age 75–84 — State Benchmarked 43% of residents are 75–84, compared to the Maryland average of 31%. A high concentration in this mid-range bracket, where residents typically need moderate support with daily activities. |
39% Residents Age 85–94 — State Benchmarked 39% of residents are 85–94, compared to the Maryland average of 44%. This is typically the most common age bracket in assisted living — this facility is in line with the statewide norm. |
8% Residents Age 95+ — State Benchmarked 8% of residents are 95 or older, compared to the Maryland average of 16%. Most residents here have not yet reached the oldest-old bracket, suggesting a younger overall community. |
| Celebration Villa of Manresa | AL RC | Annapolis (Arnold) | 86
Facility
86
MD AVG
43
Rank
#167 / 697 | Yes |
2
Facility
2
MD AVG
43
Rank
#940 / 985 | Studio / 1 Bed | 3
Facility
3
MD AVG
21
Rank
#201 / 208 | - |
35% Male Residents — State Benchmarked 35% of residents are male, compared to the Maryland average of 31%. This facility caters to a majority female resident pool (65% female), consistent with the broader assisted living trend where women significantly outnumber men. |
65% Female Residents — State Benchmarked 65% of residents are female, compared to the Maryland average of 69%. Women comprise the large majority, consistent with national assisted living demographics where women live longer and enter care facilities at higher rates. |
97% White Residents — State Benchmarked 97% of residents are reported as White, compared to the Maryland average of 81%. A higher White share than is typical for assisted living in Maryland in this dataset — compare with peer facilities for local context. |
3% African American Residents — State Benchmarked 3% of residents are reported as African American or Black, compared to the Maryland average of 13%. A lower African American share than is typical in Maryland; local markets still vary widely. |
0% Other Ethnicity Residents — State Benchmarked 0% of residents fall into categories other than White or African American (combined), compared to the Maryland average of 6%. This column aggregates Hispanic, Asian, multiracial, and any other labeled groups that are not classified as White or African American. |
8% Residents Age 65–74 — State Benchmarked 8% of residents are 65–74, compared to the Maryland average of 13%. Fewer younger seniors suggests the resident population skews older, likely requiring higher acuity care and more hands-on support. |
52% Residents Age 75–84 — State Benchmarked 52% of residents are 75–84, compared to the Maryland average of 31%. A high concentration in this mid-range bracket, where residents typically need moderate support with daily activities. |
27% Residents Age 85–94 — State Benchmarked 27% of residents are 85–94, compared to the Maryland average of 44%. The population here skews younger than the statewide norm, which may indicate a more active, lower-acuity community. |
13% Residents Age 95+ — State Benchmarked 13% of residents are 95 or older, compared to the Maryland average of 16%. In line with the statewide profile for the oldest resident bracket. |
| Queenstown Landing | AL MC RC | Queenstown | 78
Facility
78
MD AVG
43
Rank
#181 / 697 | No |
10
Facility
10
MD AVG
43
Rank
#837 / 985 | - | 5
Facility
5
MD AVG
21
Rank
#182 / 208 | - |
35% Male Residents — State Benchmarked 35% of residents are male, compared to the Maryland average of 31%. This facility caters to a majority female resident pool (65% female), consistent with the broader assisted living trend where women significantly outnumber men. |
65% Female Residents — State Benchmarked 65% of residents are female, compared to the Maryland average of 69%. Women comprise the large majority, consistent with national assisted living demographics where women live longer and enter care facilities at higher rates. |
98% White Residents — State Benchmarked 98% of residents are reported as White, compared to the Maryland average of 81%. A higher White share than is typical for assisted living in Maryland in this dataset — compare with peer facilities for local context. |
2% African American Residents — State Benchmarked 2% of residents are reported as African American or Black, compared to the Maryland average of 13%. A lower African American share than is typical in Maryland; local markets still vary widely. |
0% Other Ethnicity Residents — State Benchmarked 0% of residents fall into categories other than White or African American (combined), compared to the Maryland average of 6%. This column aggregates Hispanic, Asian, multiracial, and any other labeled groups that are not classified as White or African American. | - |
5% Residents Age 75–84 — State Benchmarked 5% of residents are 75–84, compared to the Maryland average of 31%. Below the state norm — the resident mix may skew either younger or older than this typical middle bracket. |
88% Residents Age 85–94 — State Benchmarked 88% of residents are 85–94, compared to the Maryland average of 44%. A high concentration of very elderly residents signals a higher-acuity facility with experience caring for advanced age-related needs. |
7% Residents Age 95+ — State Benchmarked 7% of residents are 95 or older, compared to the Maryland average of 16%. Most residents here have not yet reached the oldest-old bracket, suggesting a younger overall community. |
| Arbor Terrace Waugh Chapel | AL MC | Gambrills (Waugh Chapel Towne Centre) | 96
Facility
96
MD AVG
43
Rank
#140 / 697 | Yes |
47
Facility
47
MD AVG
43
Rank
#459 / 985 | Studio / 1 Bed / 2 Bed | 4
Facility
4
MD AVG
21
Rank
#191 / 208 | A+ |
30% Male Residents — State Benchmarked 30% of residents are male, compared to the Maryland average of 31%. This facility caters to a majority female resident pool (70% female), consistent with the broader assisted living trend where women significantly outnumber men. |
70% Female Residents — State Benchmarked 70% of residents are female, compared to the Maryland average of 69%. Women comprise the large majority, consistent with national assisted living demographics where women live longer and enter care facilities at higher rates. |
86% White Residents — State Benchmarked 86% of residents are reported as White, compared to the Maryland average of 81%. Close to the average for this category among assisted living facilities in Maryland with reported race/ethnicity data. |
12% African American Residents — State Benchmarked 12% of residents are reported as African American or Black, compared to the Maryland average of 13%. In line with the Maryland average for African American residents among facilities reporting this breakdown. |
3% Other Ethnicity Residents — State Benchmarked 3% of residents fall into categories other than White or African American (combined), compared to the Maryland average of 6%. This column aggregates Hispanic, Asian, multiracial, and any other labeled groups that are not classified as White or African American. Reported subgroups in this total: Asian (1%), Hawaiian/Pacific Islander (1%). |
10% Residents Age 65–74 — State Benchmarked 10% of residents are 65–74, compared to the Maryland average of 13%. Fewer younger seniors suggests the resident population skews older, likely requiring higher acuity care and more hands-on support. |
43% Residents Age 75–84 — State Benchmarked 43% of residents are 75–84, compared to the Maryland average of 31%. A high concentration in this mid-range bracket, where residents typically need moderate support with daily activities. |
39% Residents Age 85–94 — State Benchmarked 39% of residents are 85–94, compared to the Maryland average of 44%. This is typically the most common age bracket in assisted living — this facility is in line with the statewide norm. |
8% Residents Age 95+ — State Benchmarked 8% of residents are 95 or older, compared to the Maryland average of 16%. Most residents here have not yet reached the oldest-old bracket, suggesting a younger overall community. |
| Brookdale Olney | AL MC | Olney (Olney Estates) | 94
Facility
94
MD AVG
43
Rank
#148 / 697 | Yes |
16
Facility
16
MD AVG
43
Rank
#772 / 985 | Studio / 1 Bed / 2 Bed | 13
Facility
13
MD AVG
21
Rank
#141 / 208 | - |
33% Male Residents — State Benchmarked 33% of residents are male, compared to the Maryland average of 31%. This facility caters to a majority female resident pool (67% female), consistent with the broader assisted living trend where women significantly outnumber men. |
67% Female Residents — State Benchmarked 67% of residents are female, compared to the Maryland average of 69%. Women comprise the large majority, consistent with national assisted living demographics where women live longer and enter care facilities at higher rates. |
94% White Residents — State Benchmarked 94% of residents are reported as White, compared to the Maryland average of 81%. A higher White share than is typical for assisted living in Maryland in this dataset — compare with peer facilities for local context. |
3% African American Residents — State Benchmarked 3% of residents are reported as African American or Black, compared to the Maryland average of 13%. A lower African American share than is typical in Maryland; local markets still vary widely. |
3% Other Ethnicity Residents — State Benchmarked 3% of residents fall into categories other than White or African American (combined), compared to the Maryland average of 6%. This column aggregates Hispanic, Asian, multiracial, and any other labeled groups that are not classified as White or African American. Reported subgroups in this total: Asian (3%). |
8% Residents Age 65–74 — State Benchmarked 8% of residents are 65–74, compared to the Maryland average of 13%. Fewer younger seniors suggests the resident population skews older, likely requiring higher acuity care and more hands-on support. |
39% Residents Age 75–84 — State Benchmarked 39% of residents are 75–84, compared to the Maryland average of 31%. A high concentration in this mid-range bracket, where residents typically need moderate support with daily activities. |
22% Residents Age 85–94 — State Benchmarked 22% of residents are 85–94, compared to the Maryland average of 44%. The population here skews younger than the statewide norm, which may indicate a more active, lower-acuity community. |
28% Residents Age 95+ — State Benchmarked 28% of residents are 95 or older, compared to the Maryland average of 16%. A high proportion of the oldest-old suggests strong end-of-life care experience and very-high-acuity capabilities. |
| Charter Senior Living of Towson | AL MC | Baltimore (The Orchards) | 92
Facility
92
MD AVG
43
Rank
#155 / 697 | No |
36
Facility
36
MD AVG
43
Rank
#563 / 985 | Studio / 1 Bed | 5
Facility
5
MD AVG
21
Rank
#182 / 208 | - |
25% Male Residents — State Benchmarked 25% of residents are male, compared to the Maryland average of 31%. This facility caters to a majority female resident pool (75% female), consistent with the broader assisted living trend where women significantly outnumber men. |
75% Female Residents — State Benchmarked 75% of residents are female, compared to the Maryland average of 69%. Women comprise the large majority, consistent with national assisted living demographics where women live longer and enter care facilities at higher rates. |
88% White Residents — State Benchmarked 88% of residents are reported as White, compared to the Maryland average of 81%. Close to the average for this category among assisted living facilities in Maryland with reported race/ethnicity data. |
7% African American Residents — State Benchmarked 7% of residents are reported as African American or Black, compared to the Maryland average of 13%. In line with the Maryland average for African American residents among facilities reporting this breakdown. |
4% Other Ethnicity Residents — State Benchmarked 4% of residents fall into categories other than White or African American (combined), compared to the Maryland average of 6%. This column aggregates Hispanic, Asian, multiracial, and any other labeled groups that are not classified as White or African American. Reported subgroups in this total: Asian (3%), Hispanic (1%). | - |
22% Residents Age 75–84 — State Benchmarked 22% of residents are 75–84, compared to the Maryland average of 31%. Below the state norm — the resident mix may skew either younger or older than this typical middle bracket. |
60% Residents Age 85–94 — State Benchmarked 60% of residents are 85–94, compared to the Maryland average of 44%. A high concentration of very elderly residents signals a higher-acuity facility with experience caring for advanced age-related needs. |
15% Residents Age 95+ — State Benchmarked 15% of residents are 95 or older, compared to the Maryland average of 16%. In line with the statewide profile for the oldest resident bracket. |
Rows per page:

View all Nearby Homes
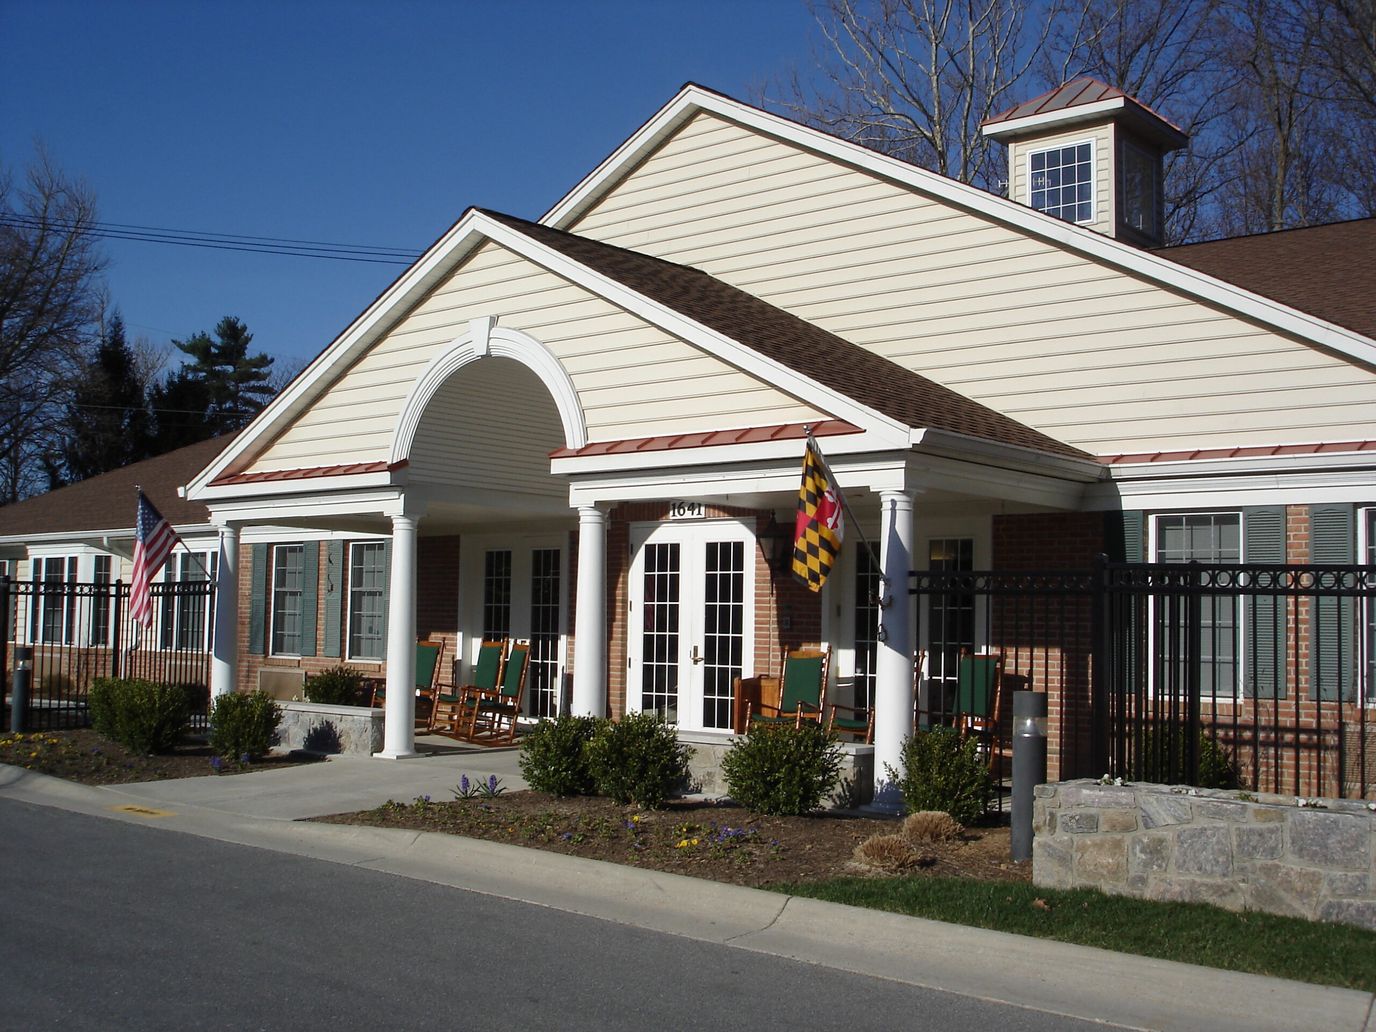
Overview of Brooke Grove Retirement Village


ASSISTED LIVING AT BROOKEGROVE
NURTURING FREEDOM OF MOVEMENT, OF CHOICE, OF SELF-DISCOVERY
Nothing says “home” like a beloved pet greeting you … the aroma of baking brownies … the sound of a child laughing … and the many other comforting touches you’ll find in The Meadows and The Woods assisted living residences at Brooke Grove Retirement Village . Here, on a pastoral retreat in a convenient Montgomery County, Maryland, location, skilled assistance blends seamlessly with the welcome feeling of home.
… BECAUSE WHAT SURROUNDS YOU REALLY MATTERS.
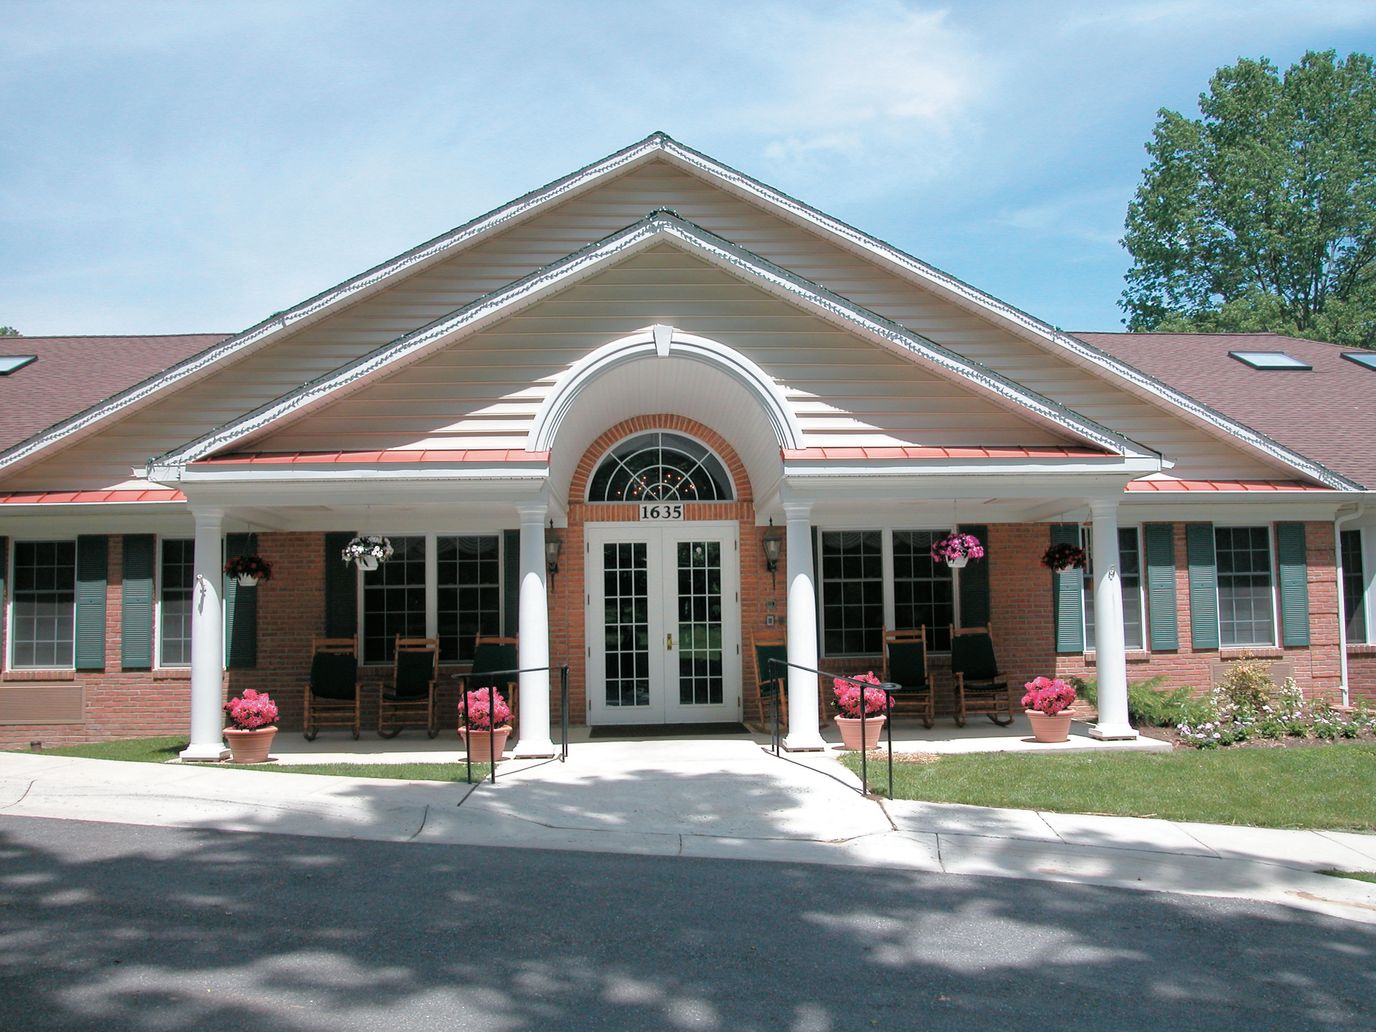
AN INNOVATIVE APPROACH TO ASSISTED LIVING
Specifically designed for assisted living or memory support, each residential-style dwelling is home to only 16 residents. Over-sized windows and skylights allow natural light to warm and brighten each room. Community members gather in family rooms with fireplaces and pianos, game and craft rooms, intimate dining rooms and sunny decks.
Everything at Brooke Grove is intentionally designed to enhance lives. We do this through LIFE ® principles and programming we’ve developed to create the cheerful atmosphere, opportunities for individual discovery, partnership with families and enriching experiences that set us apart.
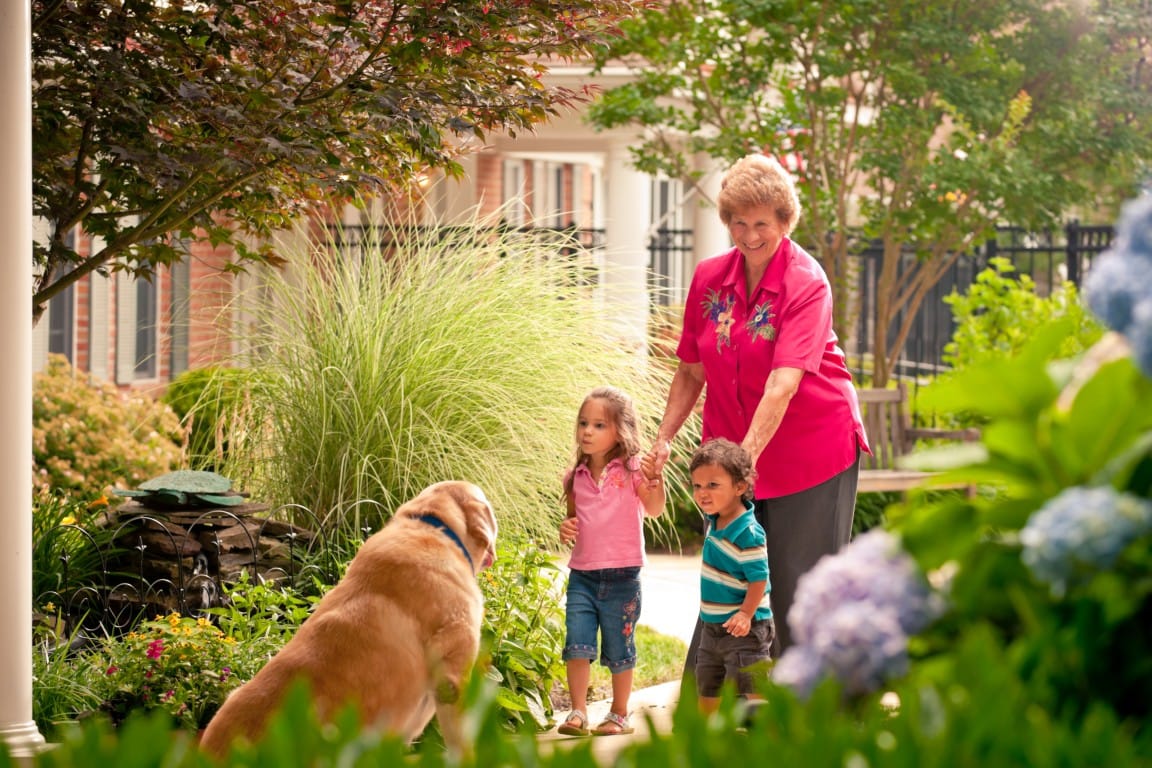
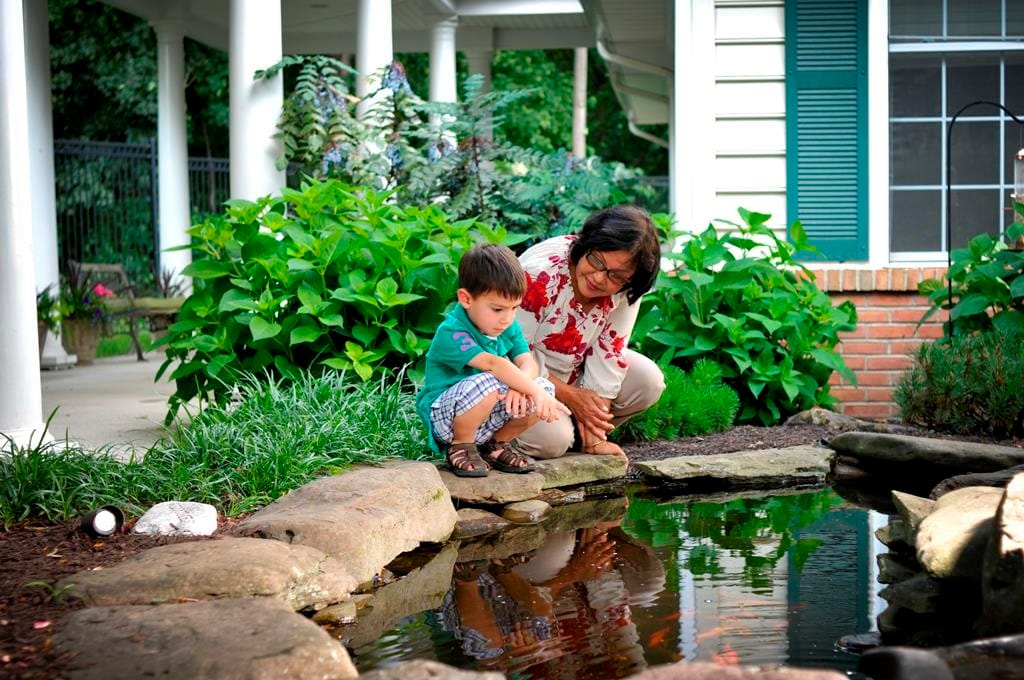
At Brooke Grove, safety and security are paramount but not confining. With easy access to large courtyards, residents move freely inside and out, visiting our neighborhood homes, strolling winding paths, and enjoying our peaceful wooded setting. An ornamental Koi pond, flower and sensory gardens, and a playground for visiting children charm and entertain.
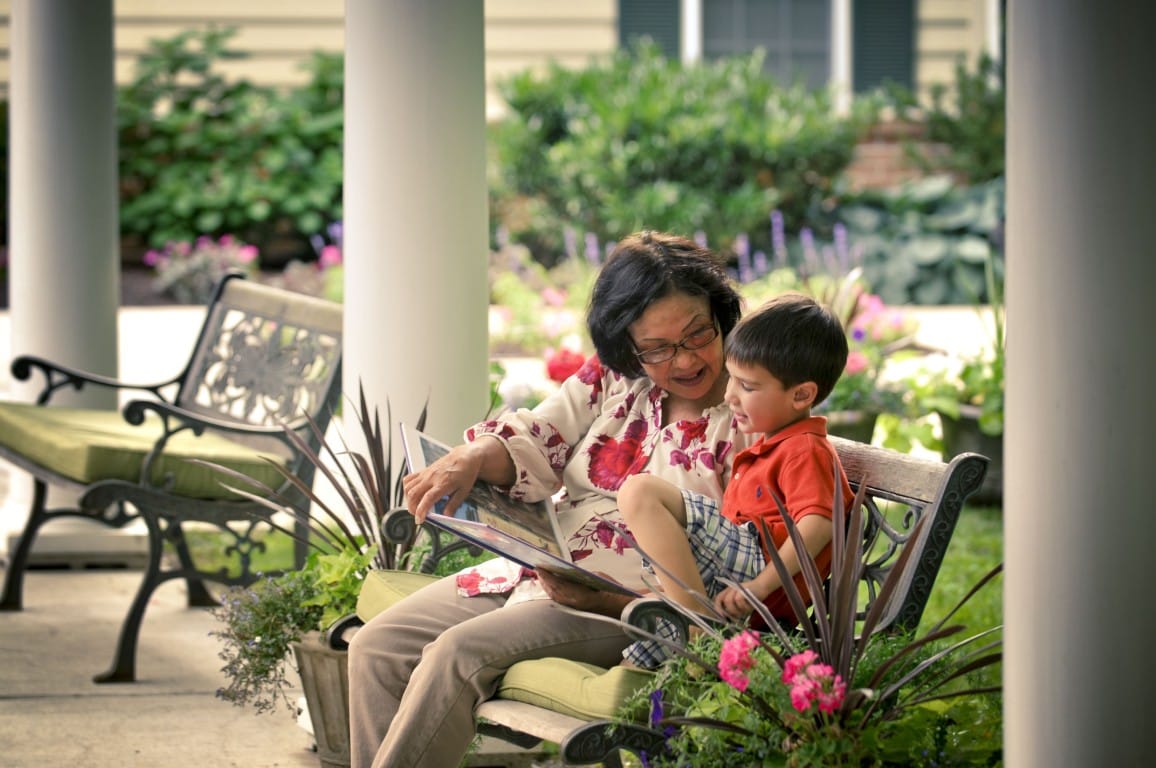
Those who live here continue to grow and learn, to participate in lifelong hobbies and explore new ones, to love and care for one another, and to feel a sense of purpose with each new day.
ASSISTED LIVING AMENITIES & SERVICES
Five different residential-style homes with secure and stimulating environments that promote independence and choice
24-hour licensed, professional staff
Assistance with daily living tasks such as dressing, bathing, eating and taking medications
Specially trained staff educated in assisting people with memory loss
Spacious, private rooms with sitting areas and private baths (some efficiencies available)
Three wholesome meals a day with delicious options
Innovative LIFE® enrichment programming with meaningful activities and off-site excursions
Access to outdoor gardens, walking paths and fish pond
Linen, laundry and housekeeping services
Occupational, physical and speech therapies
Chaplaincy services and spiritual programs for all faiths
Priority access to Brooke Grove’s rehabilitation and long-term care
Respite care to offer family members a break or a chance to experience Brooke Grove on a trial basis
Full-time, licensed social worker
Overview of Beyond Blessedd Assisted Living Facility
Celebrate your golden years in the nurturing environment of Beyond Blessedd Assisted Living Facility in Baltimore, MD. The community is purposely built to accommodate those needing extra care and support through their personalized assisted living services. From personal care to medication management, they provide all the support you’ll need to stay on track with your well-being.
The community prioritizes residents’ nutrition by providing nutritionally balanced meals approved by attending physicians. Stay connected and active with a range of recreational, religious, and social activities held regularly. Here, you can comfortably live your best life amidst a community tailored to your every need.
Overview of Nu-Life Assisted Living at 13201 Partridge Dr.


Located on Partridge Drive in Silver Spring, MD, Nu-Life Assisted Living is a trustworthy senior living community, offering exceptional assisted living services in a nurturing environment for seniors. Here, residents enjoy utmost peace of mind and comfort knowing that a devoted care team is available 24 hours a day to offer round the clock supervision, assistance with daily living activities, personal care support, medication assistance, and more. The community ensures each resident is given a relaxing living space with housekeeping services for a low-maintenance lifestyle.
Participate in a broad array of fun and exciting activities held within and outside the community, giving plenty of opportunities for making new friends, staying active, and discovering new interests. Delicious and nutritious meals are also offered, with accommodations for special dietary needs and unique preferences, making mealtimes an enjoyable experience. Overall, Nu-Life Assisted Living in Partridge Drive is an ideal place for those seeking a well-maintained community with attentive team members who prioritize residents’ well-being.
Enjoy retirement life in an intimate and family-like environment with Good Samaritan Assisted Living, a welcoming senior living community that offers assisted living, memory care, personal care, and respite care. Residents are provided with round the clock care and attention in their well-designed accommodations by a dedicated team of caregivers. With convenient services like housekeeping, linen services, and scheduled transportation, residents are able to live a maintenance-free lifestyle.
Focused on elevating residents’ living experience, the community provides a broad range of exciting and enjoyable activities and fitness programs. Residents enjoy three daily, nutritious meals in the family style dining area that fosters the warmth of bonding over meals. The community also offers an array of amenities, including a library, salon, and well-maintained outdoor spaces.
An outstanding community set in the peaceful neighborhood of Myra Pl, Bowie, MD, Miracle Hands Care Services Assisted Living offers assisted living. Here, residents can rest their worries with a compassionate and highly trained team attending to their needs 24/7. Memory care, diabetic care, and incontinence care are also provided for residents’ unique needs. The community cares for residents’ personal needs and household responsibilities to provide residents with more time to do the things they truly enjoy.
Enrich retirement with fun activities and engaging programs tailored to residents’ enjoyment and wellness. Enjoy healthy and delicious meals with carefully planned meal plans catering to dietary needs and preferences. Non-ambulatory care, medication management, and transportation services are also provided for quick response to residents’ healthcare needs. Spend your golden years without worries with the community’s top-notch care and specially designed amenities.
Tucked away in Pikesville, MD, Trusted Home Care 1 is a trusted community designed to offer compassionate assisted living. Residents here are welcomed into warm, comforting accommodations with laundry and housekeeping services for a maintenance-free lifestyle. With 24/7 daily living assistance, skilled nursing, and various therapy services, residents maintain their health and well-being with no worries.
The community ensures residents consistently receive proper care and attention with individualized care plans and regular health monitoring. Various celebrations, events, and activities are regularly held to motivate residents to stay active and engaged. Residents here can achieve their maximum potential through comprehensive care services, healthy meals, and enriching activities.
Beautifully nestled in Hamilton, MD, Beautiful Blessings Assisted Living is a welcoming community designed for assisted living. It provides residents a peaceful and supportive setting for receiving 24/7 daily living assistance like personal grooming, medication management, and healthcare coordination. Residents here maintain their peace of mind with 24-hour supervision and easy access to an excellent healthcare provider for their medical needs.
Fun and engaging activities like movie nights and exercise sessions foster both leisure and stimulation for a vibrant living experience. Healthy and nourishing meals are served daily to make sure everyone maintains a healthy and energized body. With its comprehensive care services and thoughtful amenities, Beautiful Blessings Assisted Living stands out as a nurturing community that delivers exceptional care.
Peacefully nestled in the quiet residential area of Ailsa Avenue, Baltimore, MD, First Family Living I is an astounding community that offers assisted living. The community is dedicated to enhancing residents’ quality of life with top-tier care and assistance around the clock. With different levels of care, residents can rest assured of receiving the necessary care for their specific needs.
A full calendar of enjoyable activities and enriching programs are conducted for residents to easily adapt to their surroundings and live actively. Delight with healthy and nutritious meals that cater to their dietary needs and tastes. Spend your golden years without worries with the community’s top-tier care and specially designed amenities.
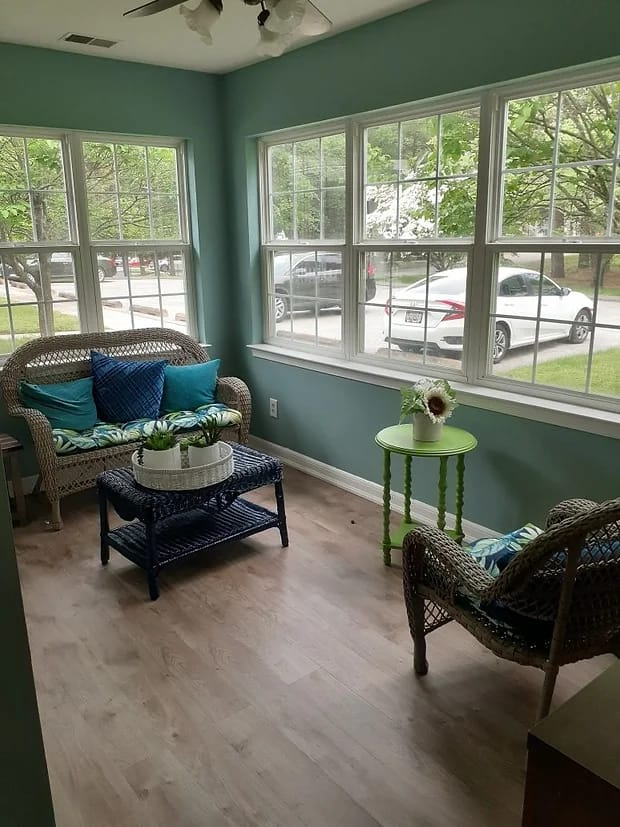
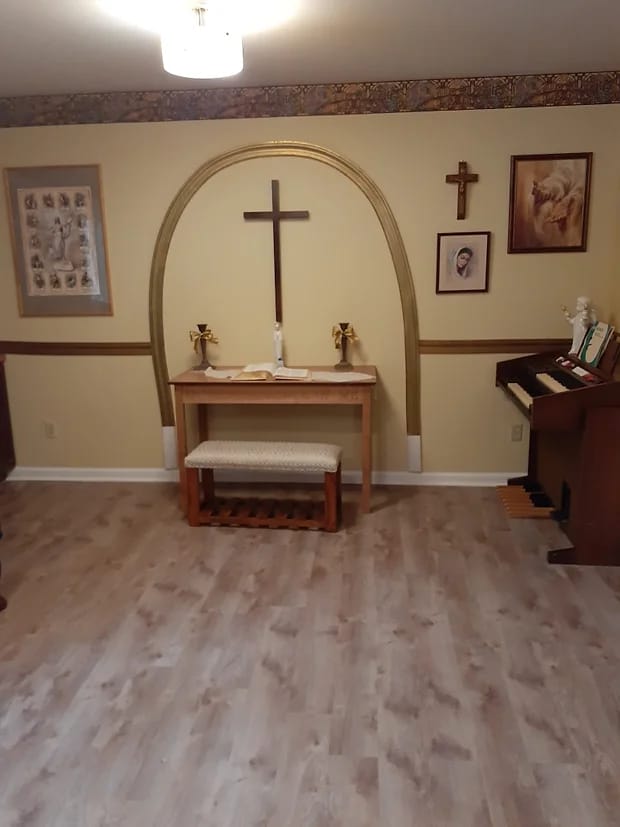
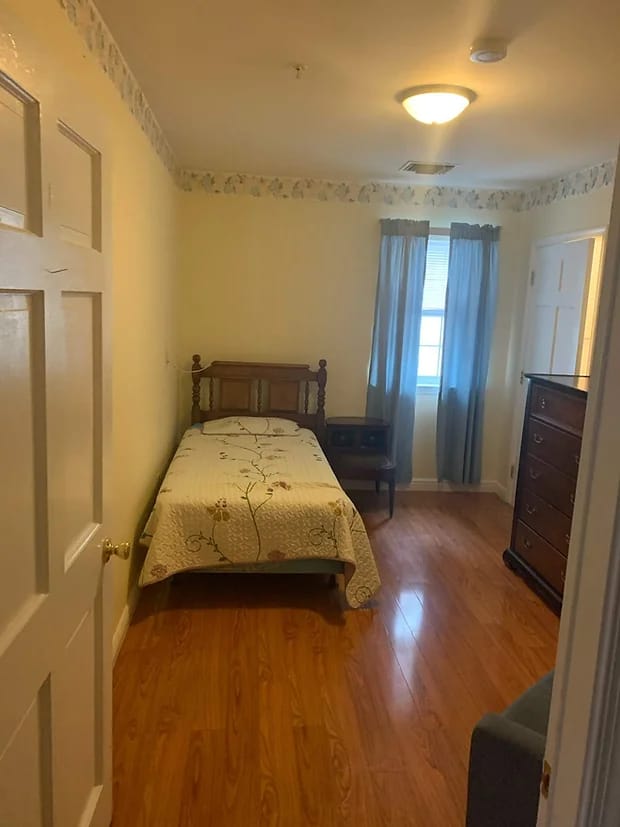
Founded on strong dedication to care, Household of Angels Assisted is a family-owned community in Gambrills, MD that offers a safe and cozy setting for assisted living. The community is designed to provide an array of supportive services like assistance with daily living activities, medication management, and therapy services. Residents also enjoy the convenience of having maintenance, housekeeping, and laundry services for a carefree living experience.
An activities director is also available to curate a calendar of fun and engaging activities based on individual interests and capabilities. Residents’ safety is guaranteed by emergency in-room call systems, door alarms, and a 24-hour awake team. Experience genuine care and loving support from dedicated people with Household of Angels Assisted.
Ranking Methodology
How we rank these assisted living communities
Every community above is evaluated across six weighted categories using public data including state inspection records, review platforms, BBB profiles, and operator-published materials.
Weighting overview
- 35%Resident Experience
- 25%Regulatory
- 15%Visual Media
- 10%Website
- 10%Stability
- 5%Environment
01
Resident & Family Experience 35%
The single largest share of every ranking. Aggregated review sentiment and volume from major platforms — the closest signal to real resident experience.
- Includes
- Review Sentiment
- Review Volume
02
Regulatory & Safety Record 25%
State inspection records, citations, and complaint visits. We weight per-inspection rates more heavily than raw counts.
- Includes
- State Inspections
- Citations/Inspection
- % Inspections w/ Citations
- Complaint Visits
- Accreditations
- BBB Rating
03
Visual Media & Transparency 15%
Communities that publish high-quality visuals give families a real preview. No photos or tours = a negative transparency signal.
- Includes
- Video Tours
- Virtual Walkthroughs
- Photo Quantity
- Photo Quality
04
Website & Operator Transparency 10%
Site quality and whether the operator publishes basic accountability information — staff names, contact details, ownership.
- Includes
- Website Content
- Mobile Usability
- Staff Info Available
- Owner Info Available
05
Community Stability 10%
Operational signals indicating whether a community is well-run and meeting demand.
- Includes
- Occupancy Rate
- Bed Options
06
Environment & Pricing 5%
Walkability and pricing transparency. Walk Score is weighted higher for Independent Living than for Memory Care, where most residents do not leave unaccompanied.
- Includes
- Walk Score
- Pricing Transparency
Who we are
Your Senior Care Partner, Every Step of the Way
We help families find affordable senior communities and unlock same day discounts, Medicaid, and Medicare options tailored to your needs.
Contact us Today
Frequently Asked Questions about Assisted Living in Maryland
What's the difference between assisted living and memory care in Maryland?
Assisted living in Maryland supports residents with daily activities (bathing, dressing, medication management) while preserving independence. Memory care is a specialized form of assisted living for residents living with Alzheimer's or dementia, and adds 24/7 secured environments, dementia-trained staff, and structured routines designed to reduce confusion and wandering.
What's the difference between assisted living and a nursing home in Maryland?
Assisted living in Maryland is a residential model focused on housing, hospitality, and help with daily activities. Nursing homes (skilled nursing facilities) provide 24/7 medical care from licensed nurses for residents with significant health needs, and are regulated more strictly under both state and federal CMS rules.
Does Maryland Medicaid cover assisted living?
Maryland Medicaid does not directly pay room-and-board for assisted living, but most states (including Maryland) offer Home and Community-Based Services (HCBS) waivers that can offset the cost of care services delivered inside a licensed community. Eligibility, waitlists, and covered services vary — check directly with the state Medicaid agency.
What is assisted living?
Assisted living combines private or semi-private apartments with help on activities of daily living (meals, bathing, dressing, medication management) and a social calendar — for residents who need some support but do not need 24/7 medical care.
How many assisted living facilities are listed on this page?
This page features 820 assisted living facilities in Maryland. Use the filters and comparison tools above to compare ratings, amenities, and pricing.
How do I choose the right assisted living facility in Maryland?
Start by matching the level of care offered to the resident's current and anticipated needs, then compare licensing status, staff-to-resident ratios, recent inspection results, and pricing. Tour at least two or three communities in Maryland, talk to current residents and families, and confirm what is included in the base rate versus billed as add-on services.
What should I look for when visiting assisted living facilities in Maryland?
Pay attention to staff interactions with residents, cleanliness and odor, food quality at meal times, the activity calendar, and how questions about pricing and care plans are answered. Ask to see the most recent state inspection report, the move-out / level-of-care-change policy, and a sample monthly bill that lists every fee.
Updated on
