


Where in Maryland are you looking?
Browse communities by city.
Compare Independent Living around Maryland
| Edenwald Senior Living | IL AL MC NH SNF | Towson (Southerly Road) | 94
Facility
94
MD AVG
43
Rank
#144 / 690 | No |
83
Facility
83
MD AVG
43
Rank
#70 / 985 | 1 Bed / 2 Bed | - | A+ |
18% Male Residents — State Benchmarked 18% of residents are male, compared to the Maryland average of 31%. This facility caters to a majority female resident pool (82% female), consistent with the broader assisted living trend where women significantly outnumber men. |
82% Female Residents — State Benchmarked 82% of residents are female, compared to the Maryland average of 69%. Women comprise the large majority, consistent with national assisted living demographics where women live longer and enter care facilities at higher rates. |
100% White Residents — State Benchmarked 100% of residents are reported as White, compared to the Maryland average of 81%. A higher White share than is typical for assisted living in Maryland in this dataset — compare with peer facilities for local context. |
0% African American Residents — State Benchmarked 0% of residents are reported as African American or Black, compared to the Maryland average of 13%. A lower African American share than is typical in Maryland; local markets still vary widely. |
0% Other Ethnicity Residents — State Benchmarked 0% of residents fall into categories other than White or African American (combined), compared to the Maryland average of 6%. This column aggregates Hispanic, Asian, multiracial, and any other labeled groups that are not classified as White or African American. | - |
13% Residents Age 75–84 — State Benchmarked 13% of residents are 75–84, compared to the Maryland average of 31%. Below the state norm — the resident mix may skew either younger or older than this typical middle bracket. |
53% Residents Age 85–94 — State Benchmarked 53% of residents are 85–94, compared to the Maryland average of 44%. A high concentration of very elderly residents signals a higher-acuity facility with experience caring for advanced age-related needs. |
35% Residents Age 95+ — State Benchmarked 35% of residents are 95 or older, compared to the Maryland average of 16%. A high proportion of the oldest-old suggests strong end-of-life care experience and very-high-acuity capabilities. |
| Homewood Living Frederick | IL AL MC NH SNF | Frederick | 120
Facility
120
MD AVG
43
Rank
#76 / 690 | Yes |
14
Facility
14
MD AVG
43
Rank
#788 / 985 | 1 Bed / 2 Bed | - | - | - | - | - | - | - | - | - | - | - |
| Ingleside at King Farm | IL AL MC NH SNF | Rockville (King Farm) | 45
Facility
45
MD AVG
43
Rank
#226 / 690 | Yes |
73
Facility
73
MD AVG
43
Rank
#152 / 985 | 1 Bed / 2 Bed | - | - | - | - | - | - | - | - | - | - | - |
| Bedford Court, a CCRC | IL AL HOS MC NH RC SNF | Silver Spring (International Drive) | 76
Facility
76
MD AVG
43
Rank
#179 / 690 | Yes |
64
Facility
64
MD AVG
43
Rank
#261 / 985 | Studio / 1 Bed | 34
Facility
34
MD AVG
21
Rank
#22 / 210 | - |
15% Male Residents — State Benchmarked 15% of residents are male, compared to the Maryland average of 31%. This facility caters to a majority female resident pool (85% female), consistent with the broader assisted living trend where women significantly outnumber men. |
85% Female Residents — State Benchmarked 85% of residents are female, compared to the Maryland average of 69%. Women comprise the large majority, consistent with national assisted living demographics where women live longer and enter care facilities at higher rates. |
95% White Residents — State Benchmarked 95% of residents are reported as White, compared to the Maryland average of 81%. A higher White share than is typical for assisted living in Maryland in this dataset — compare with peer facilities for local context. |
3% African American Residents — State Benchmarked 3% of residents are reported as African American or Black, compared to the Maryland average of 13%. A lower African American share than is typical in Maryland; local markets still vary widely. |
2% Other Ethnicity Residents — State Benchmarked 2% of residents fall into categories other than White or African American (combined), compared to the Maryland average of 6%. This column aggregates Hispanic, Asian, multiracial, and any other labeled groups that are not classified as White or African American. Reported subgroups in this total: Asian (2%). |
2% Residents Age 65–74 — State Benchmarked 2% of residents are 65–74, compared to the Maryland average of 13%. Fewer younger seniors suggests the resident population skews older, likely requiring higher acuity care and more hands-on support. |
8% Residents Age 75–84 — State Benchmarked 8% of residents are 75–84, compared to the Maryland average of 31%. Below the state norm — the resident mix may skew either younger or older than this typical middle bracket. |
65% Residents Age 85–94 — State Benchmarked 65% of residents are 85–94, compared to the Maryland average of 44%. A high concentration of very elderly residents signals a higher-acuity facility with experience caring for advanced age-related needs. |
26% Residents Age 95+ — State Benchmarked 26% of residents are 95 or older, compared to the Maryland average of 16%. A high proportion of the oldest-old suggests strong end-of-life care experience and very-high-acuity capabilities. |
| Lutheran Village at Miller’s Grant | IL AL NH SNF | Ellicott City (Lutheran Village At Miller’s Grant) | 36
Facility
36
MD AVG
43
Rank
#237 / 690 | Yes |
19
Facility
19
MD AVG
43
Rank
#746 / 985 | 1 Bed / 2 Bed | 21
Facility
21
MD AVG
21
Rank
#108 / 210 | - |
17% Male Residents — State Benchmarked 17% of residents are male, compared to the Maryland average of 31%. This facility caters to a majority female resident pool (83% female), consistent with the broader assisted living trend where women significantly outnumber men. |
83% Female Residents — State Benchmarked 83% of residents are female, compared to the Maryland average of 69%. Women comprise the large majority, consistent with national assisted living demographics where women live longer and enter care facilities at higher rates. |
83% White Residents — State Benchmarked 83% of residents are reported as White, compared to the Maryland average of 81%. Close to the average for this category among assisted living facilities in Maryland with reported race/ethnicity data. |
11% African American Residents — State Benchmarked 11% of residents are reported as African American or Black, compared to the Maryland average of 13%. In line with the Maryland average for African American residents among facilities reporting this breakdown. |
6% Other Ethnicity Residents — State Benchmarked 6% of residents fall into categories other than White or African American (combined), compared to the Maryland average of 6%. This column aggregates Hispanic, Asian, multiracial, and any other labeled groups that are not classified as White or African American. Reported subgroups in this total: Asian (6%). | - |
33% Residents Age 75–84 — State Benchmarked 33% of residents are 75–84, compared to the Maryland average of 31%. This is the second most common age bracket in assisted living, representing residents with moderate care needs. |
44% Residents Age 85–94 — State Benchmarked 44% of residents are 85–94, compared to the Maryland average of 44%. This is typically the most common age bracket in assisted living — this facility is in line with the statewide norm. |
22% Residents Age 95+ — State Benchmarked 22% of residents are 95 or older, compared to the Maryland average of 16%. A high proportion of the oldest-old suggests strong end-of-life care experience and very-high-acuity capabilities. |
| Residences at Vantage Point | IL AL HC MC NH SNF | Columbia (Town Center) | 44
Facility
44
MD AVG
43
Rank
#229 / 690 | Yes |
52
Facility
52
MD AVG
43
Rank
#402 / 985 | Studio / 1 Bed / 2 Bed | 36
Facility
36
MD AVG
21
Rank
#16 / 210 | - | - | - | - | - | - | - | - | - | - |
| Maplewood Park Place | IL AL MC NH SNF | Bethesda (Pooks Hill) | 29
Facility
29
MD AVG
43
Rank
#247 / 690 | Yes |
38
Facility
38
MD AVG
43
Rank
#542 / 985 | 1 Bed / 2 Bed | 30
Facility
30
MD AVG
21
Rank
#44 / 210 | - |
18% Male Residents — State Benchmarked 18% of residents are male, compared to the Maryland average of 31%. This facility caters to a majority female resident pool (82% female), consistent with the broader assisted living trend where women significantly outnumber men. |
82% Female Residents — State Benchmarked 82% of residents are female, compared to the Maryland average of 69%. Women comprise the large majority, consistent with national assisted living demographics where women live longer and enter care facilities at higher rates. |
100% White Residents — State Benchmarked 100% of residents are reported as White, compared to the Maryland average of 81%. A higher White share than is typical for assisted living in Maryland in this dataset — compare with peer facilities for local context. |
0% African American Residents — State Benchmarked 0% of residents are reported as African American or Black, compared to the Maryland average of 13%. A lower African American share than is typical in Maryland; local markets still vary widely. |
0% Other Ethnicity Residents — State Benchmarked 0% of residents fall into categories other than White or African American (combined), compared to the Maryland average of 6%. This column aggregates Hispanic, Asian, multiracial, and any other labeled groups that are not classified as White or African American. | - |
6% Residents Age 75–84 — State Benchmarked 6% of residents are 75–84, compared to the Maryland average of 31%. Below the state norm — the resident mix may skew either younger or older than this typical middle bracket. |
24% Residents Age 85–94 — State Benchmarked 24% of residents are 85–94, compared to the Maryland average of 44%. The population here skews younger than the statewide norm, which may indicate a more active, lower-acuity community. |
71% Residents Age 95+ — State Benchmarked 71% of residents are 95 or older, compared to the Maryland average of 16%. A high proportion of the oldest-old suggests strong end-of-life care experience and very-high-acuity capabilities. |
| Friends House Retirement Community | IL AL NH SNF | Sandy Spring | 24
Facility
24
MD AVG
43
Rank
#249 / 690 | No |
6
Facility
6
MD AVG
43
Rank
#891 / 985 | - | 20
Facility
20
MD AVG
21
Rank
#112 / 210 | - |
6% Male Residents — State Benchmarked 6% of residents are male, compared to the Maryland average of 31%. This facility caters to a majority female resident pool (94% female), consistent with the broader assisted living trend where women significantly outnumber men. |
94% Female Residents — State Benchmarked 94% of residents are female, compared to the Maryland average of 69%. Women comprise the large majority, consistent with national assisted living demographics where women live longer and enter care facilities at higher rates. |
94% White Residents — State Benchmarked 94% of residents are reported as White, compared to the Maryland average of 81%. A higher White share than is typical for assisted living in Maryland in this dataset — compare with peer facilities for local context. |
0% African American Residents — State Benchmarked 0% of residents are reported as African American or Black, compared to the Maryland average of 13%. A lower African American share than is typical in Maryland; local markets still vary widely. |
6% Other Ethnicity Residents — State Benchmarked 6% of residents fall into categories other than White or African American (combined), compared to the Maryland average of 6%. This column aggregates Hispanic, Asian, multiracial, and any other labeled groups that are not classified as White or African American. Reported subgroups in this total: Asian (6%). |
6% Residents Age 65–74 — State Benchmarked 6% of residents are 65–74, compared to the Maryland average of 13%. Fewer younger seniors suggests the resident population skews older, likely requiring higher acuity care and more hands-on support. |
18% Residents Age 75–84 — State Benchmarked 18% of residents are 75–84, compared to the Maryland average of 31%. Below the state norm — the resident mix may skew either younger or older than this typical middle bracket. |
53% Residents Age 85–94 — State Benchmarked 53% of residents are 85–94, compared to the Maryland average of 44%. A high concentration of very elderly residents signals a higher-acuity facility with experience caring for advanced age-related needs. |
24% Residents Age 95+ — State Benchmarked 24% of residents are 95 or older, compared to the Maryland average of 16%. A high proportion of the oldest-old suggests strong end-of-life care experience and very-high-acuity capabilities. |
| Revitz House | IL AL HC MC NH SNF | Rockville | 558
Facility
558
MD AVG
43
Rank
#1 / 690 | Yes |
81
Facility
81
MD AVG
43
Rank
#86 / 985 | 1 Bed | - | - | - | - | - | - | - | - | - | - | - |
| Broadmead | IL AL MC NH RC SNF | Cockeysville | 40
Facility
40
MD AVG
43
Rank
#233 / 690 | No |
0
Facility
0
MD AVG
43
Rank
#959 / 985 | - | 47
Facility
47
MD AVG
21
Rank
#3 / 210 | A+ | - | - | - | - | - | - | - | - | - |
| Blakehurst (Chestnut Green) | IL AL MC NH SNF | Towson | 35
Facility
35
MD AVG
43
Rank
#239 / 690 | No |
10
Facility
10
MD AVG
43
Rank
#837 / 985 | - | 33
Facility
33
MD AVG
21
Rank
#25 / 210 | - | - | - | - | - | - | - | - | - | - |
| Asbury Methodist Village | IL AL MC NH SNF | Gaithersburg (Russell Avenue) | 164
Facility
164
MD AVG
43
Rank
#26 / 690 | Yes |
41
Facility
41
MD AVG
43
Rank
#508 / 985 | - | 27
Facility
27
MD AVG
21
Rank
#62 / 210 | - |
21% Male Residents — State Benchmarked 21% of residents are male, compared to the Maryland average of 31%. This facility caters to a majority female resident pool (79% female), consistent with the broader assisted living trend where women significantly outnumber men. |
79% Female Residents — State Benchmarked 79% of residents are female, compared to the Maryland average of 69%. Women comprise the large majority, consistent with national assisted living demographics where women live longer and enter care facilities at higher rates. |
92% White Residents — State Benchmarked 92% of residents are reported as White, compared to the Maryland average of 81%. A higher White share than is typical for assisted living in Maryland in this dataset — compare with peer facilities for local context. |
1% African American Residents — State Benchmarked 1% of residents are reported as African American or Black, compared to the Maryland average of 13%. A lower African American share than is typical in Maryland; local markets still vary widely. |
7% Other Ethnicity Residents — State Benchmarked 7% of residents fall into categories other than White or African American (combined), compared to the Maryland average of 6%. This column aggregates Hispanic, Asian, multiracial, and any other labeled groups that are not classified as White or African American. Reported subgroups in this total: Asian (7%). |
1% Residents Age 65–74 — State Benchmarked 1% of residents are 65–74, compared to the Maryland average of 13%. Fewer younger seniors suggests the resident population skews older, likely requiring higher acuity care and more hands-on support. |
21% Residents Age 75–84 — State Benchmarked 21% of residents are 75–84, compared to the Maryland average of 31%. Below the state norm — the resident mix may skew either younger or older than this typical middle bracket. |
48% Residents Age 85–94 — State Benchmarked 48% of residents are 85–94, compared to the Maryland average of 44%. This is typically the most common age bracket in assisted living — this facility is in line with the statewide norm. |
30% Residents Age 95+ — State Benchmarked 30% of residents are 95 or older, compared to the Maryland average of 16%. A high proportion of the oldest-old suggests strong end-of-life care experience and very-high-acuity capabilities. |
| Ginger Cove | IL AL HC MC NH SNF | Annapolis (River Crescent Drive) | 96
Facility
96
MD AVG
43
Rank
#136 / 690 | No |
51
Facility
51
MD AVG
43
Rank
#413 / 985 | 1 Bed / 2 Bed | 42
Facility
42
MD AVG
21
Rank
#8 / 210 | A+ |
40% Male Residents — State Benchmarked 40% of residents are male, compared to the Maryland average of 31%. A relatively balanced gender mix for assisted living, where facilities typically skew heavily female. |
60% Female Residents — State Benchmarked 60% of residents are female, compared to the Maryland average of 69%. Closer to an even gender split than most assisted living facilities, which typically have 65–75% female residents. |
100% White Residents — State Benchmarked 100% of residents are reported as White, compared to the Maryland average of 81%. A higher White share than is typical for assisted living in Maryland in this dataset — compare with peer facilities for local context. |
0% African American Residents — State Benchmarked 0% of residents are reported as African American or Black, compared to the Maryland average of 13%. A lower African American share than is typical in Maryland; local markets still vary widely. |
0% Other Ethnicity Residents — State Benchmarked 0% of residents fall into categories other than White or African American (combined), compared to the Maryland average of 6%. This column aggregates Hispanic, Asian, multiracial, and any other labeled groups that are not classified as White or African American. | - |
13% Residents Age 75–84 — State Benchmarked 13% of residents are 75–84, compared to the Maryland average of 31%. Below the state norm — the resident mix may skew either younger or older than this typical middle bracket. |
64% Residents Age 85–94 — State Benchmarked 64% of residents are 85–94, compared to the Maryland average of 44%. A high concentration of very elderly residents signals a higher-acuity facility with experience caring for advanced age-related needs. |
22% Residents Age 95+ — State Benchmarked 22% of residents are 95 or older, compared to the Maryland average of 16%. A high proportion of the oldest-old suggests strong end-of-life care experience and very-high-acuity capabilities. |
| Charlestown Community | IL NH | Baltimore | 238
Facility
238
MD AVG
43
Rank
#5 / 690 | No |
36
Facility
36
MD AVG
43
Rank
#563 / 985 | - | 35
Facility
35
MD AVG
21
Rank
#18 / 210 | - | - | - | - | - | - | - | - | - | - |
| Pickersgill Retirement Community | IL AL NH SNF | Baltimore (Chestnut Hill) | 138
Facility
138
MD AVG
43
Rank
#56 / 690 | No |
45
Facility
45
MD AVG
43
Rank
#475 / 985 | - | - | A+ |
24% Male Residents — State Benchmarked 24% of residents are male, compared to the Maryland average of 31%. This facility caters to a majority female resident pool (76% female), consistent with the broader assisted living trend where women significantly outnumber men. |
76% Female Residents — State Benchmarked 76% of residents are female, compared to the Maryland average of 69%. Women comprise the large majority, consistent with national assisted living demographics where women live longer and enter care facilities at higher rates. |
95% White Residents — State Benchmarked 95% of residents are reported as White, compared to the Maryland average of 81%. A higher White share than is typical for assisted living in Maryland in this dataset — compare with peer facilities for local context. |
1% African American Residents — State Benchmarked 1% of residents are reported as African American or Black, compared to the Maryland average of 13%. A lower African American share than is typical in Maryland; local markets still vary widely. |
4% Other Ethnicity Residents — State Benchmarked 4% of residents fall into categories other than White or African American (combined), compared to the Maryland average of 6%. This column aggregates Hispanic, Asian, multiracial, and any other labeled groups that are not classified as White or African American. Reported subgroups in this total: Asian (4%). |
3% Residents Age 65–74 — State Benchmarked 3% of residents are 65–74, compared to the Maryland average of 13%. Fewer younger seniors suggests the resident population skews older, likely requiring higher acuity care and more hands-on support. |
27% Residents Age 75–84 — State Benchmarked 27% of residents are 75–84, compared to the Maryland average of 31%. This is the second most common age bracket in assisted living, representing residents with moderate care needs. |
55% Residents Age 85–94 — State Benchmarked 55% of residents are 85–94, compared to the Maryland average of 44%. A high concentration of very elderly residents signals a higher-acuity facility with experience caring for advanced age-related needs. |
15% Residents Age 95+ — State Benchmarked 15% of residents are 95 or older, compared to the Maryland average of 16%. In line with the statewide profile for the oldest resident bracket. |
Rows per page:

View all Nearby Homes
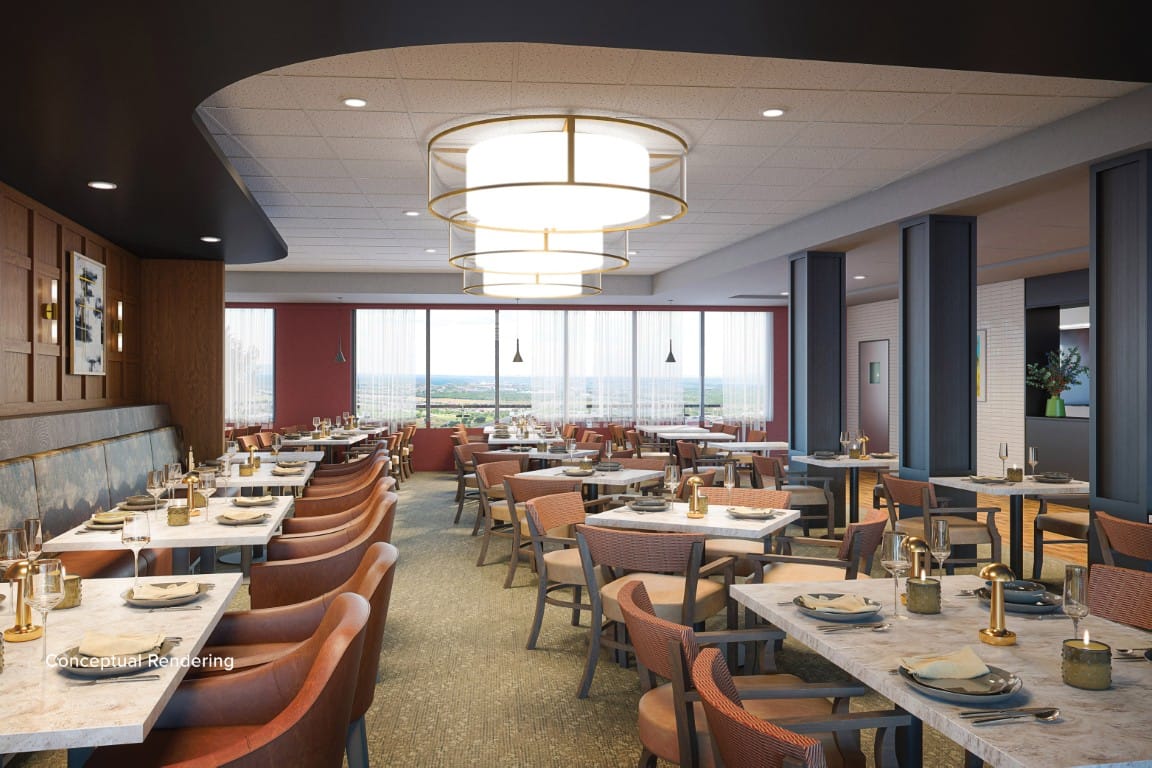
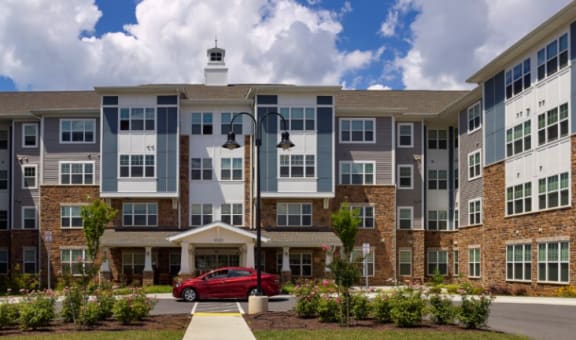
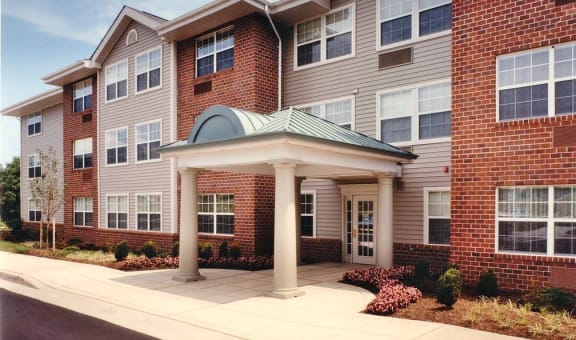
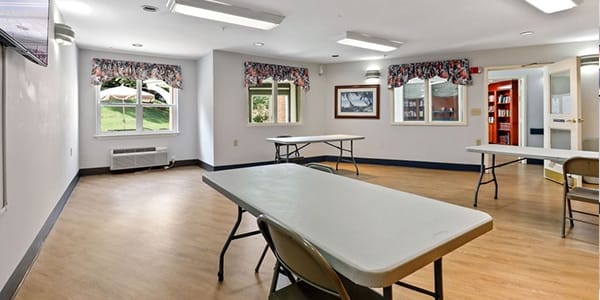
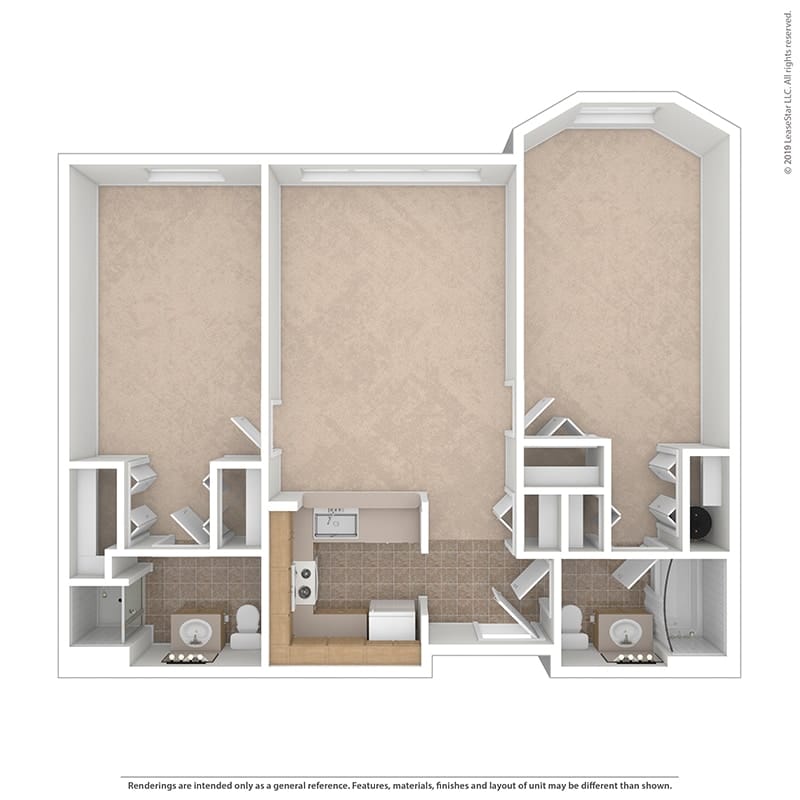
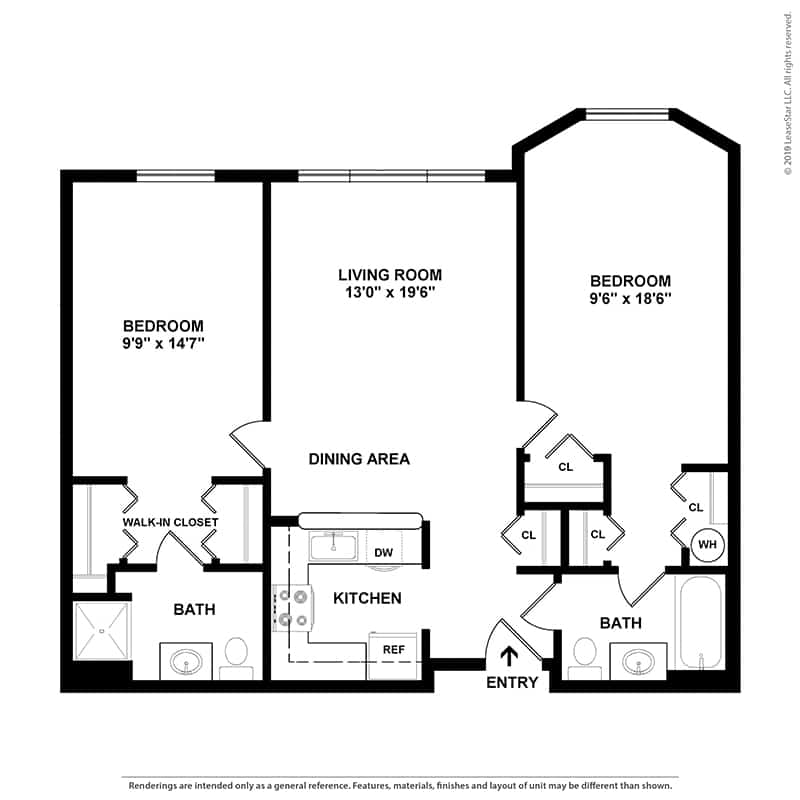
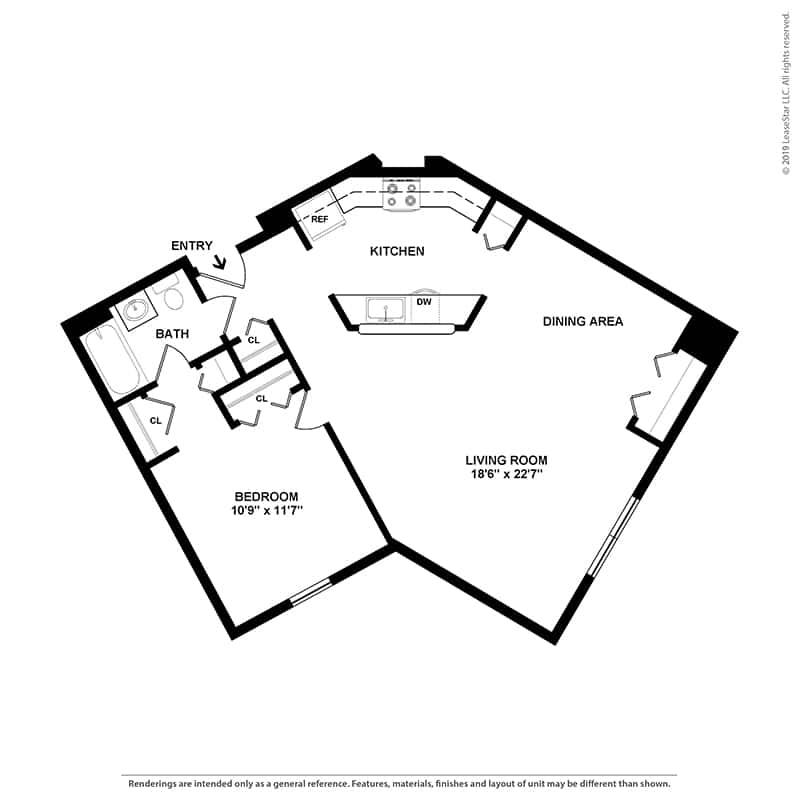
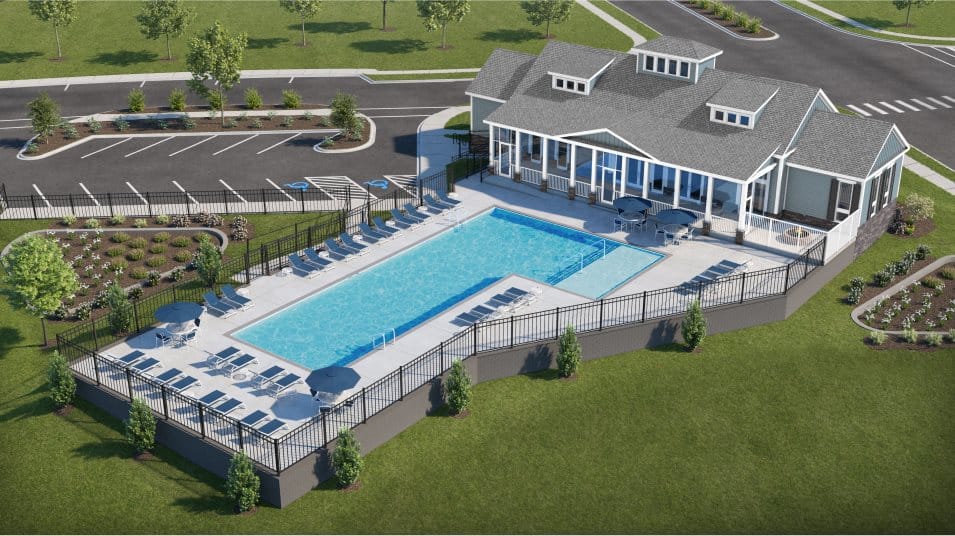
Surrounded by thriving local amenities in Bethesda, MD, The Grandview Senior Living Community is a welcoming community that offers independent living. The community has cozy and specially designed one- and two-bedroom floor plans, ensuring residents are comfortable and safe. A compassionate maintenance team also helps residents with their chores and maintenance for their convenience.
Residents have fun and make new friends with a well-thought-out calendar of fun activities and enriching programs. Delightful and healthy dining options are also available, ensuring residents have the finest dining experience that caters to their dietary needs and preferences. Transportation services are also provided, so residents can easily access their needs. Amenities include a swimming pool, a fitness center, a game room, a salon, a medical center, and walking trails.
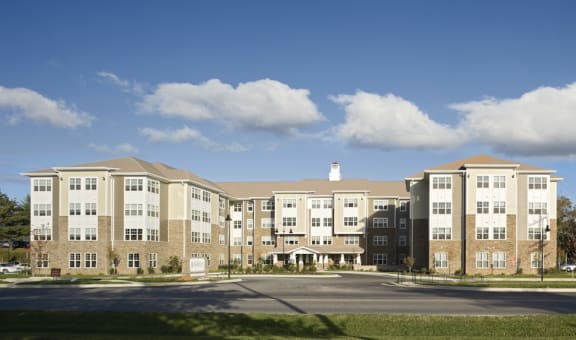
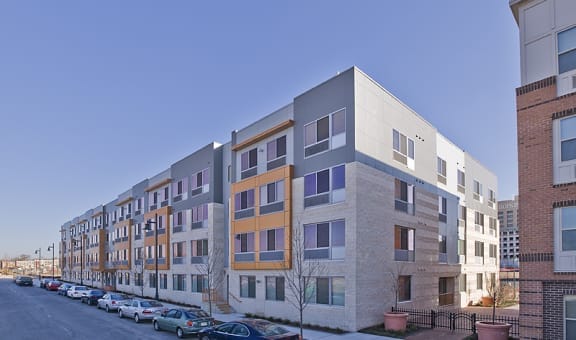
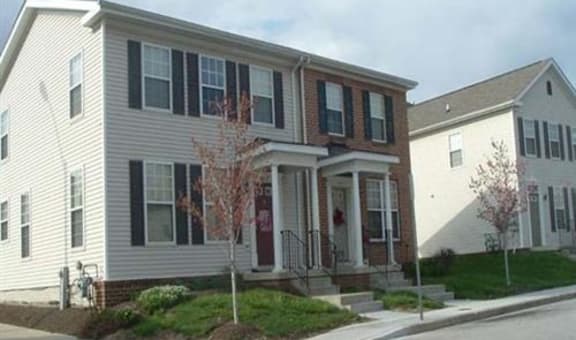
Ideally located in the vibrant setting of Dundalk, MD, Park View at Dundalk is a dedicated 55+ community that offers independent living. Featuring cozy and purposely built one-bedroom floor plans, the community ensures residents are comfortable and safe. 24-hour emergency maintenance and laundry spaces are also provided, so residents have a hassle-free living.
Residents can spend their days as they please with convenient access to thriving local amenities and entertainment sites nearby. With a fully equipped kitchen, residents can prepare meals according to their dietary needs and preferences. Pets are also welcome to accompany residents to ease their loneliness. The community is ideal for those seeking independence in their golden years.
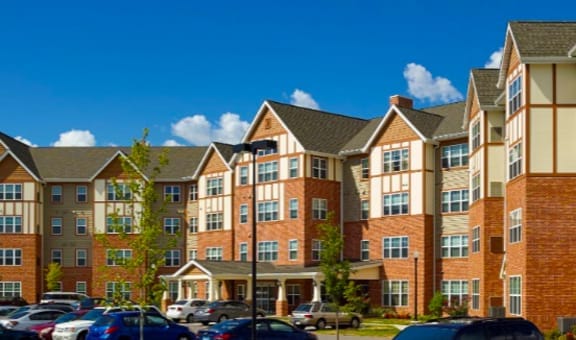
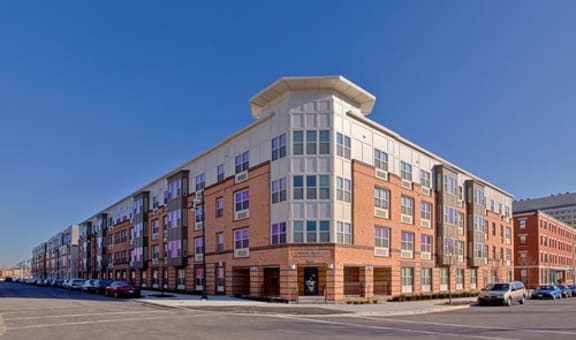
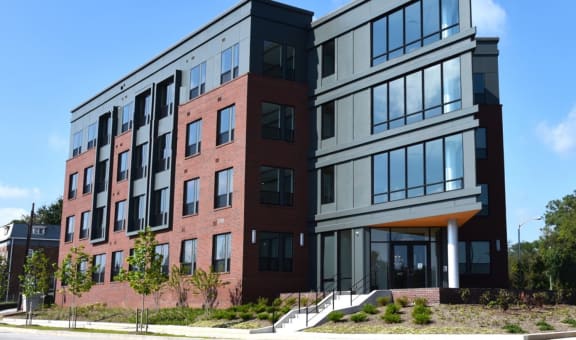
Make the most of your best years at The Greens at Logan Field, an idyllic retreat in Dundalk, MD, offering independent living. The community has beautifully furnished and cozy one- and two-bedroom floor plans, ensuring residents are comfortable and safe. Residents have a hassle-free lifestyle with on-site maintenance, management, and laundry spaces.
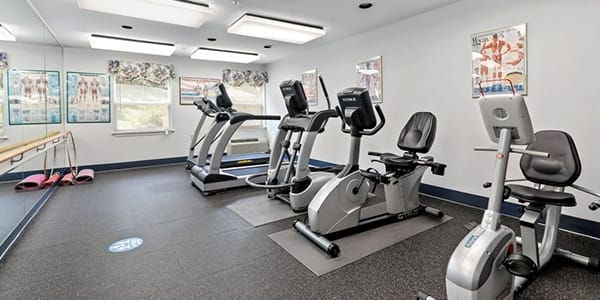
Shopping, dining, and recreation sites are easily accessible, providing residents with endless leisure and wellness opportunities. A fully equipped kitchen is also available, allowing residents to prepare meals according to their dietary needs and preferences. Amenities include a fitness center, a computer care, a library, a billiard alcove, and a crafts alcove, creating the ideal setting for residents to thrive in retirement.
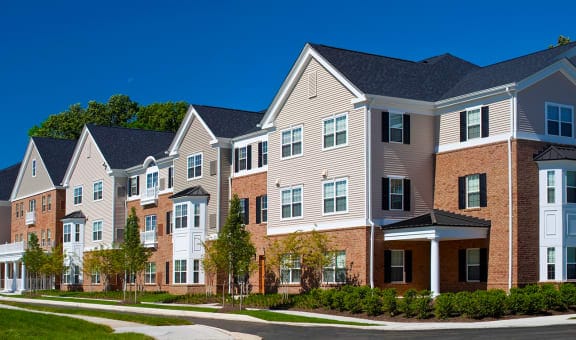
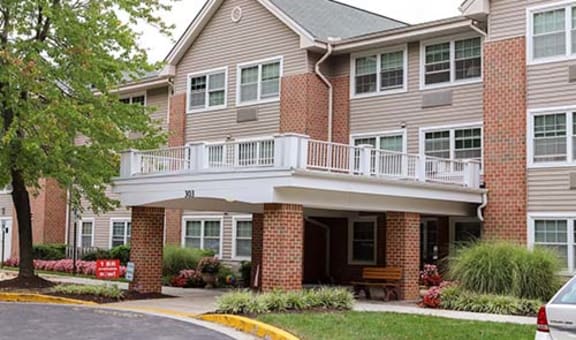
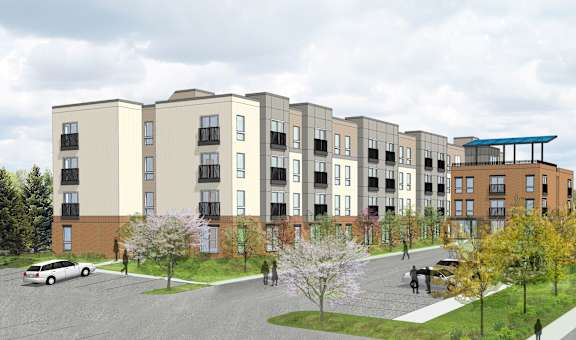
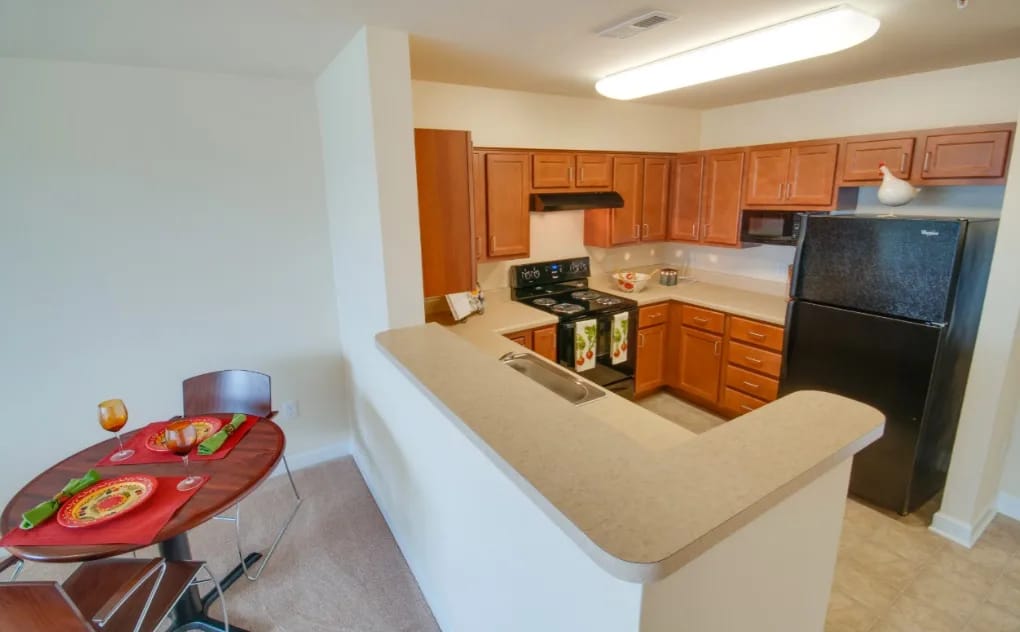
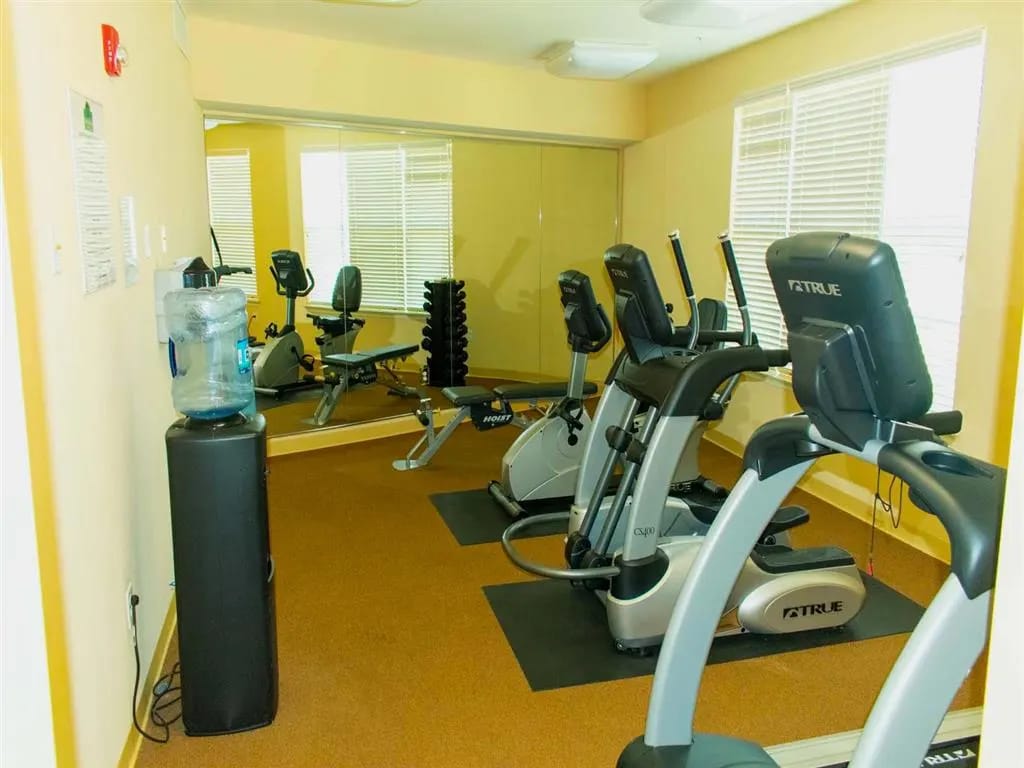
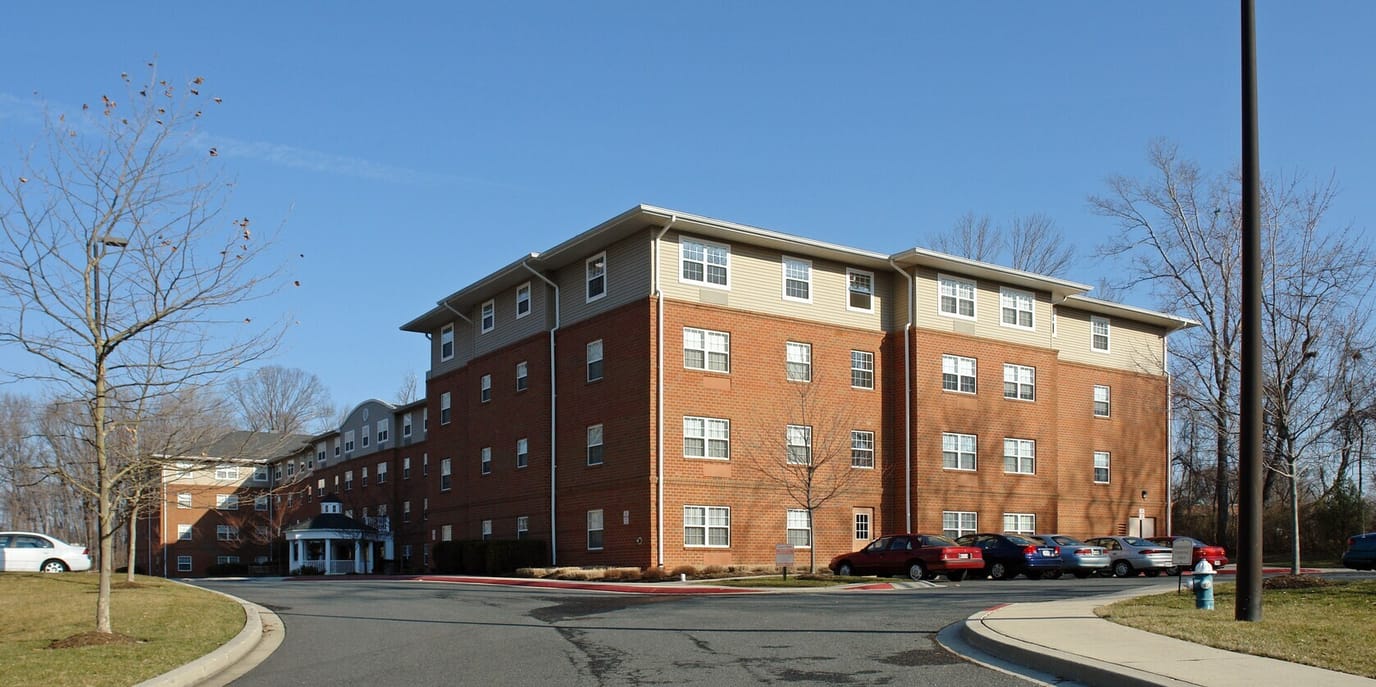
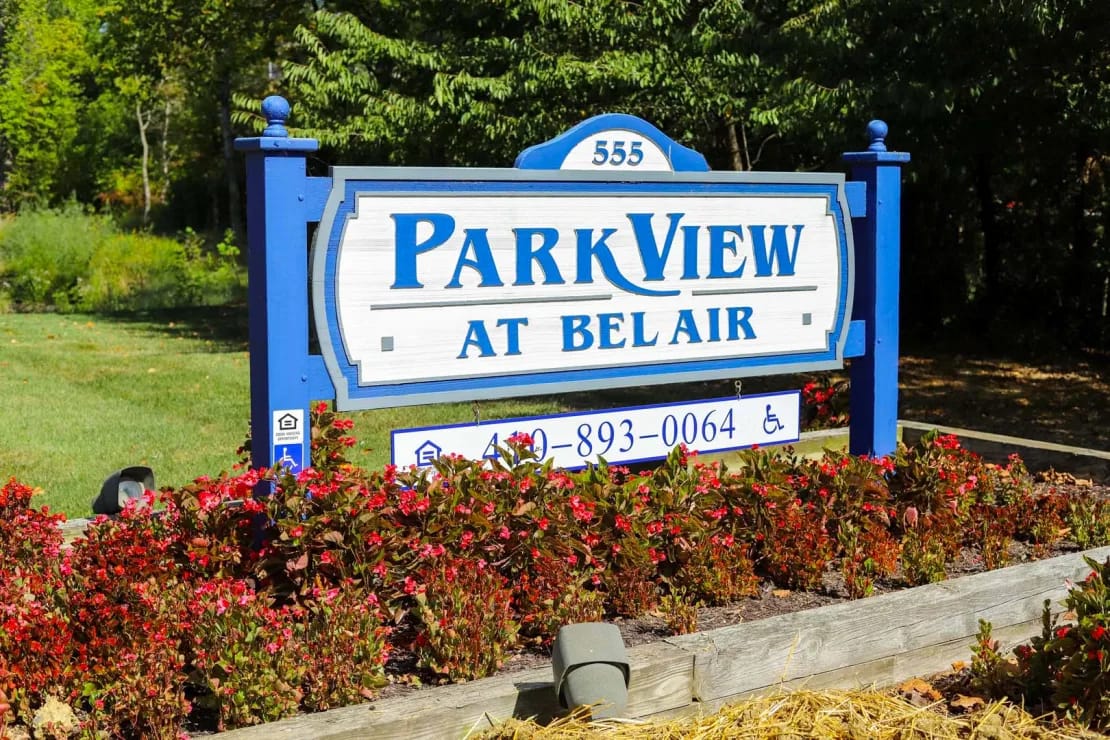
Make every moment of your best years count at Park View at Bel Air, a distinguished 62+ community in Bel Air, MD, offering independent living. Featuring beautifully furnished and cozy one- and two-bedroom floor plans, the community ensures residents are comfortable and safe. Residents can keep their peace of mind with round-the-clock emergency maintenance, on-site management, and laundry spaces.
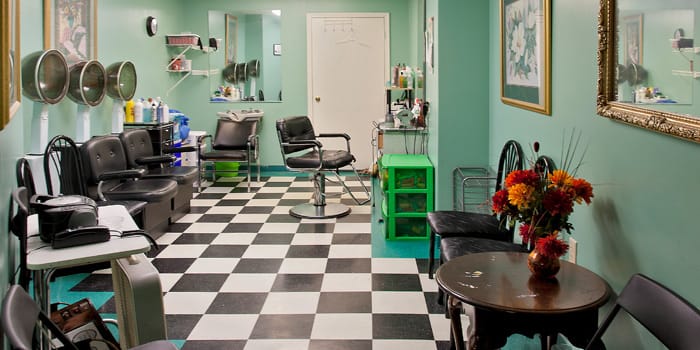
Thriving local shops and recreation sites are easily accessible, providing residents with endless leisure and wellness opportunities. Residents can also prepare meals based on their dietary needs and preferences with a modern kitchen in each unit. Pets are also welcome to accompany residents to ease their loneliness, although restrictions apply. The community is equipped with a library, a fitness center, a salon, and a wellness suite, ensuring residents have a blissful retirement.
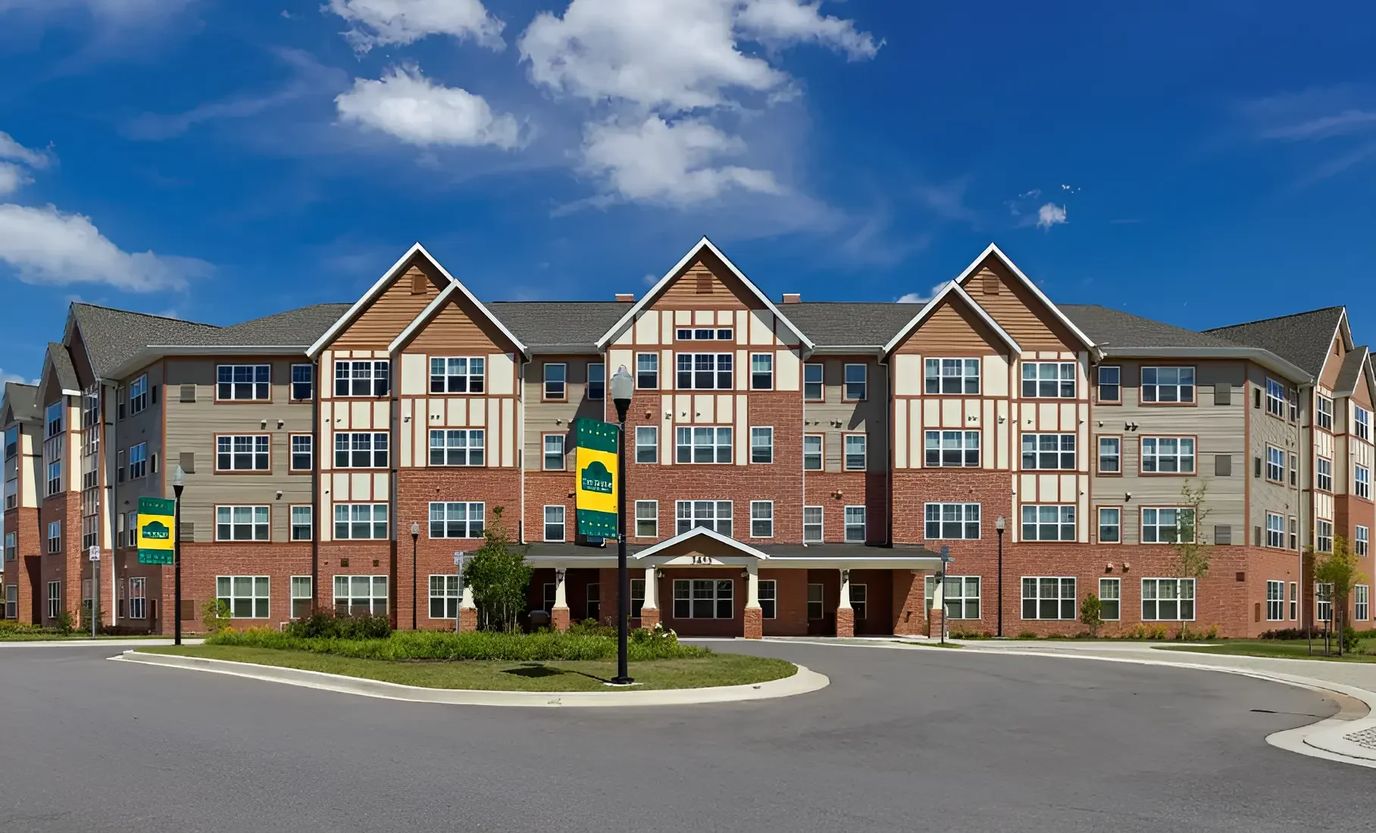
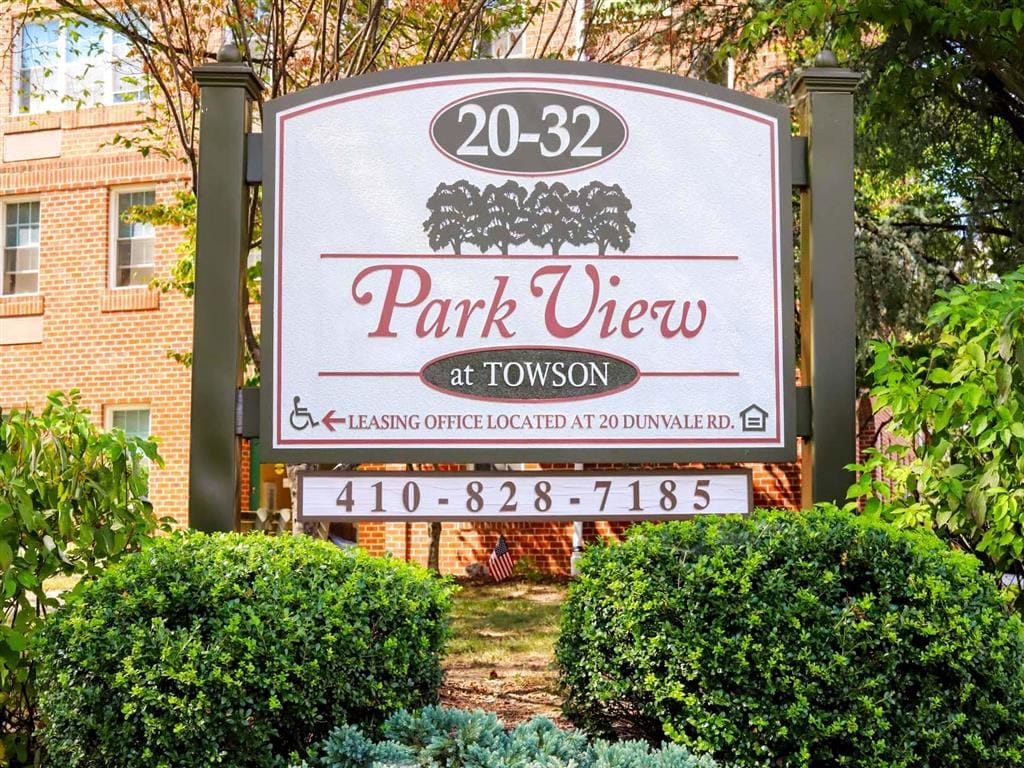
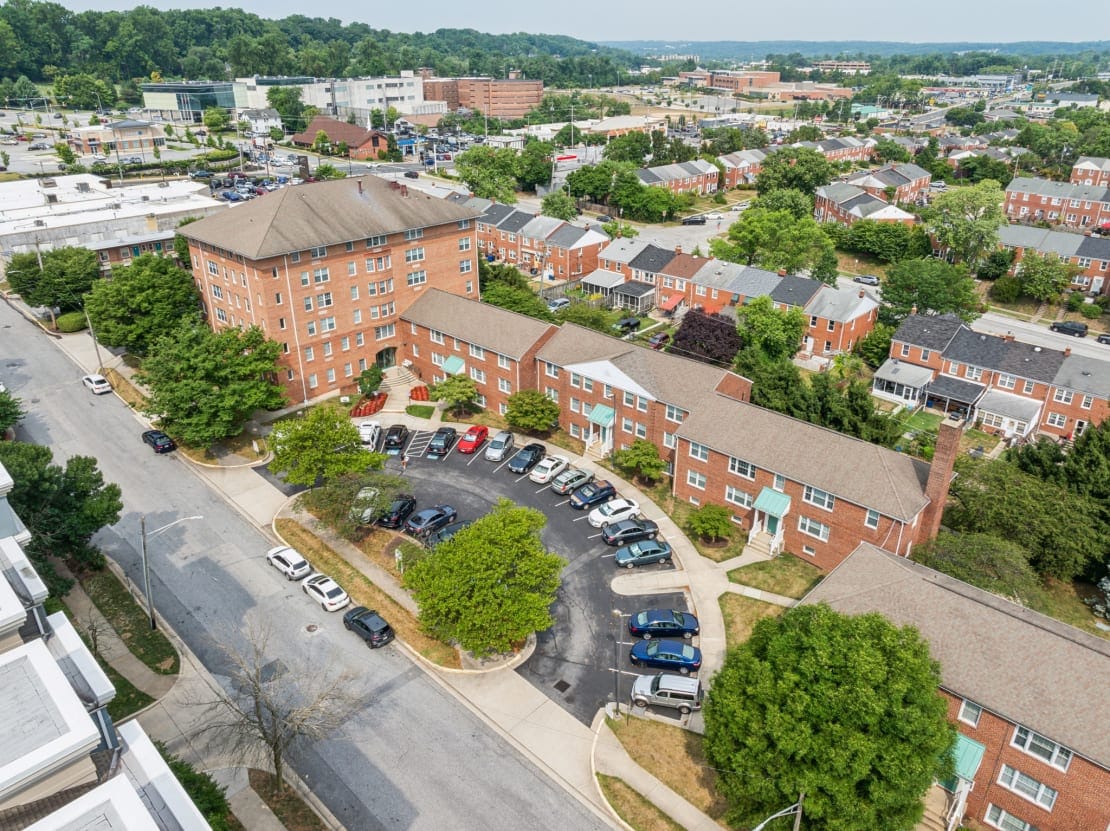
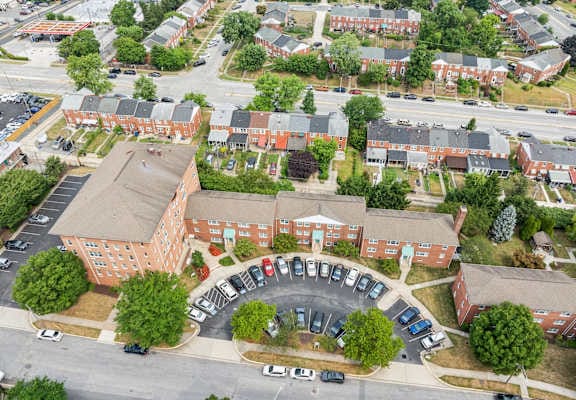
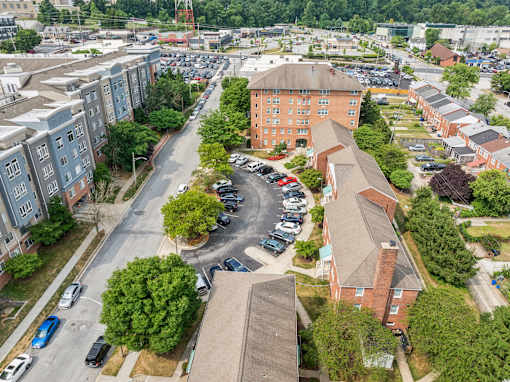
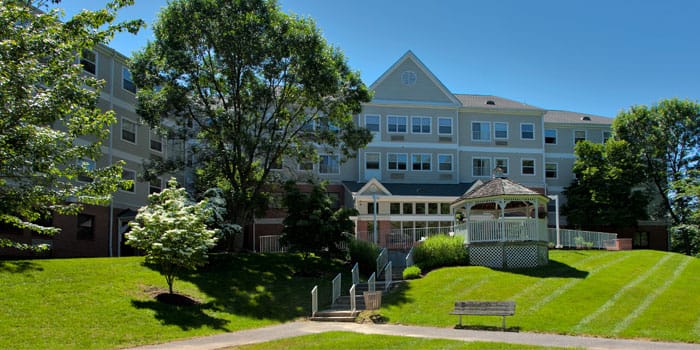
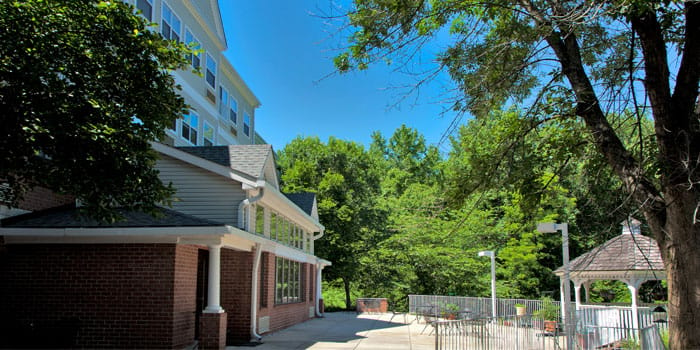
Spend your golden years at Park View at Towson, an idyllic retreat in Towson, MD, offering independent living. The community is committed to enhancing the living experiences of those 55+, providing cozy and specially designed one- and two-bedroom floor plans. Residents can feel at ease with round-the-clock emergency maintenance and convenient apartment features.
Fun recreational activities and exciting events are conducted, encouraging residents to live actively and make new friends. Residents also have easy access to plenty of dining options that cater to their dietary needs and preferences, with delightful restaurants and shops in the area. The community is equipped with a courtyard, a gazebo, a library, a media room, and a garden club.
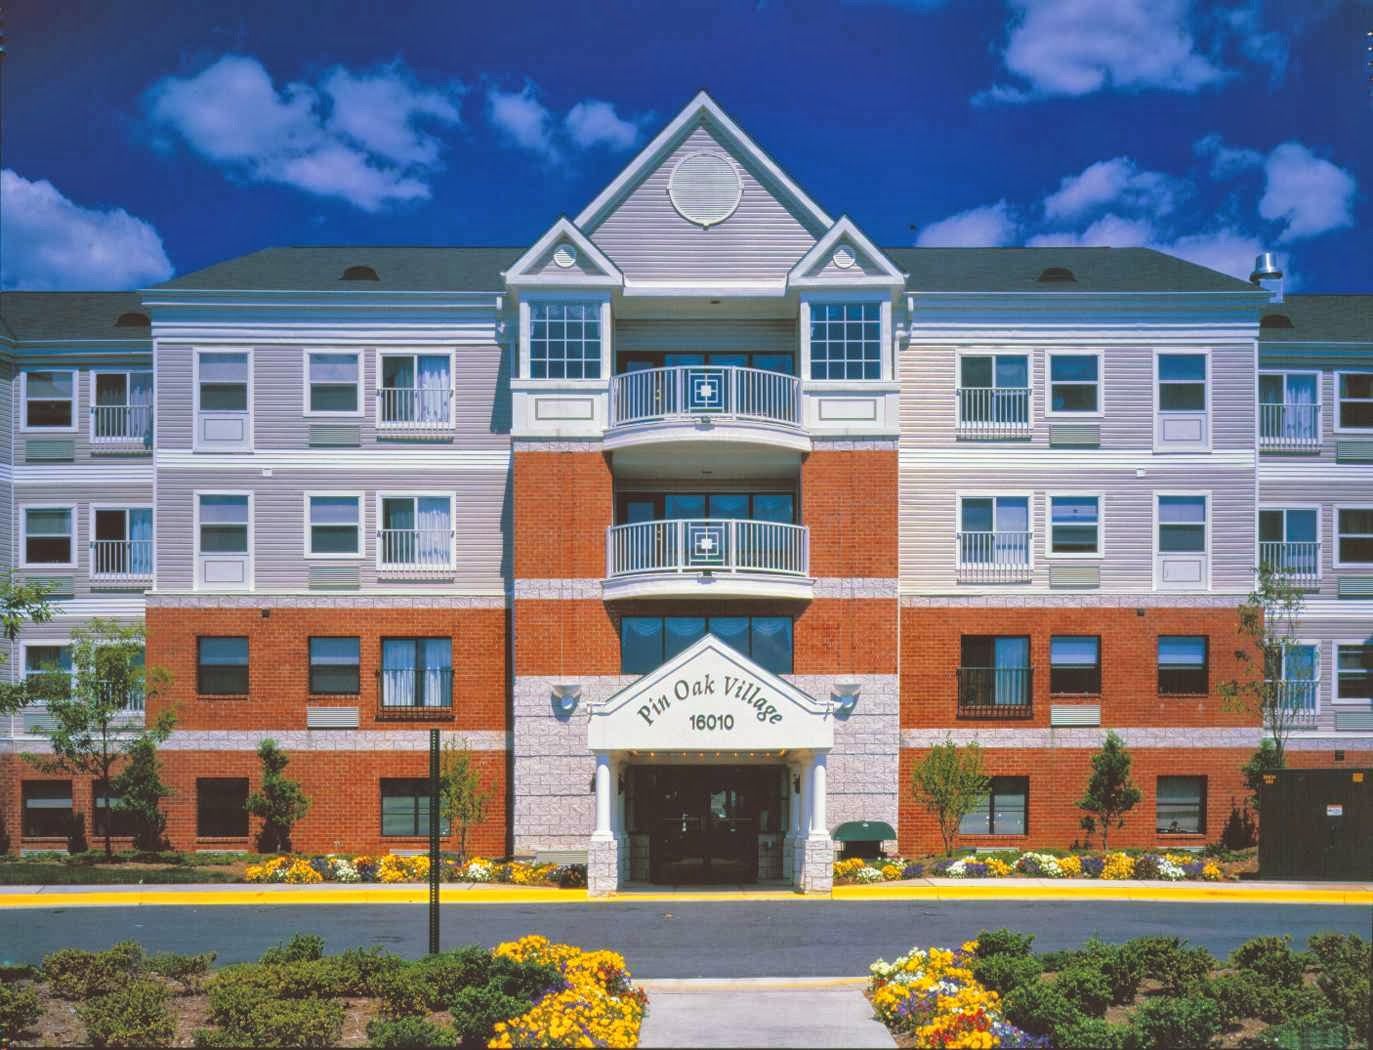
Make the most of your best years at Pin Oak Village, a distinct community in Bowie, MD, offering independent living. Featuring purposely built and spacious one- and two-bedroom floor plans, the community ensures residents are comfortable and safe. The community also helps with chores and maintenance, so residents have a hassle-free living.
A carefully curated calendar of engaging activities and enriching programs is conducted to keep residents active and socially connected. With delightful restaurants and shops nearby, residents have easy access to plenty of dining options that cater to their dietary needs and preferences. A friendly setting and various state-of-the-art amenities are also provided, so residents can thrive in retirement.
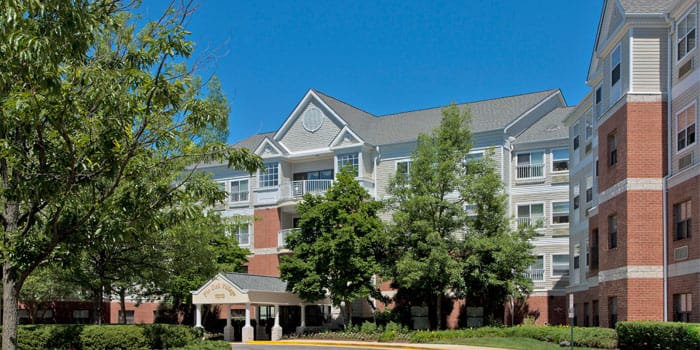
Live the best of your golden years at Beechfield Manors, an outstanding community in Bowie, MD, offering independent living. Prioritizing those 55+, the community has specially designed and spacious one- and two-bedroom floor plans. Residents also enjoy a hassle-free living with maintenance services and plenty of convenient apartment features.
Thriving local shops and recreation spaces are easily accessible, ensuring residents will not run out of things to do for leisure and wellness. Residents also enjoy various dining options with fully equipped kitchens. The community is a great option for those seeking independence in retirement, especially with its vibrant and welcoming setting.
The Residence at Eden Green is an 85-bed assisted living and memory care community located at 410 Colonial Drive in Denton, Maryland. Serving older adults in Caroline County, the facility is situated on 28 acres along the Eastern Shore and accepts Medicaid.
Monthly pricing starts at $5,725 for semi-private accommodations and $6,950 for private rooms. Current occupancy figures are not reported in the available source data, so families should inquire directly regarding availability and potential waitlists.
The Maryland Department of Health, Office of Health Care Quality, oversees the inspection of this facility. No specific inspection history is available in the current source records, and the community maintains a citations-per-inspection rate of zero. Records indicate that no civil money penalties or payment denials have been imposed by CMS within the past three years.
The facility offers 16 confirmed amenities, including a fitness center, rehabilitation clinic, craft room, library, and computer center. Outdoor spaces feature a lake, patios, and garden areas. Controlled access entry is in place for security. The dining program provides three daily meals, and resident programming includes recreational, educational, and spiritual activities. Respite care is available for short-term stays.
Families seeking assisted living or memory care in a large-scale residential setting on the Eastern Shore may find this facility suitable. Families evaluating The Residence at Eden Green should confirm the administrator, current occupancy, and the full inspection history directly with the Maryland Department of Health before making a placement decision.
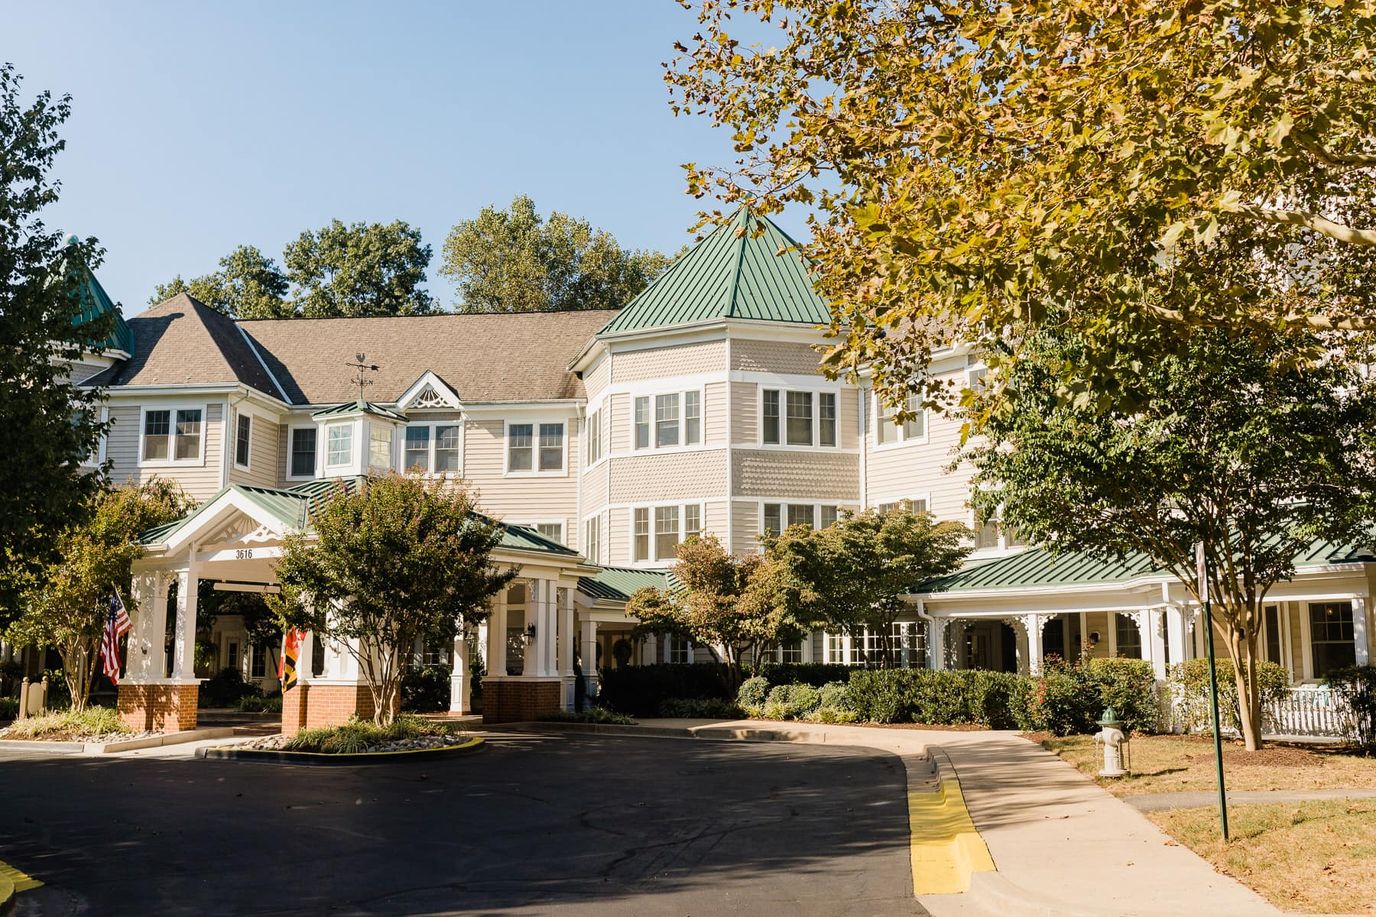
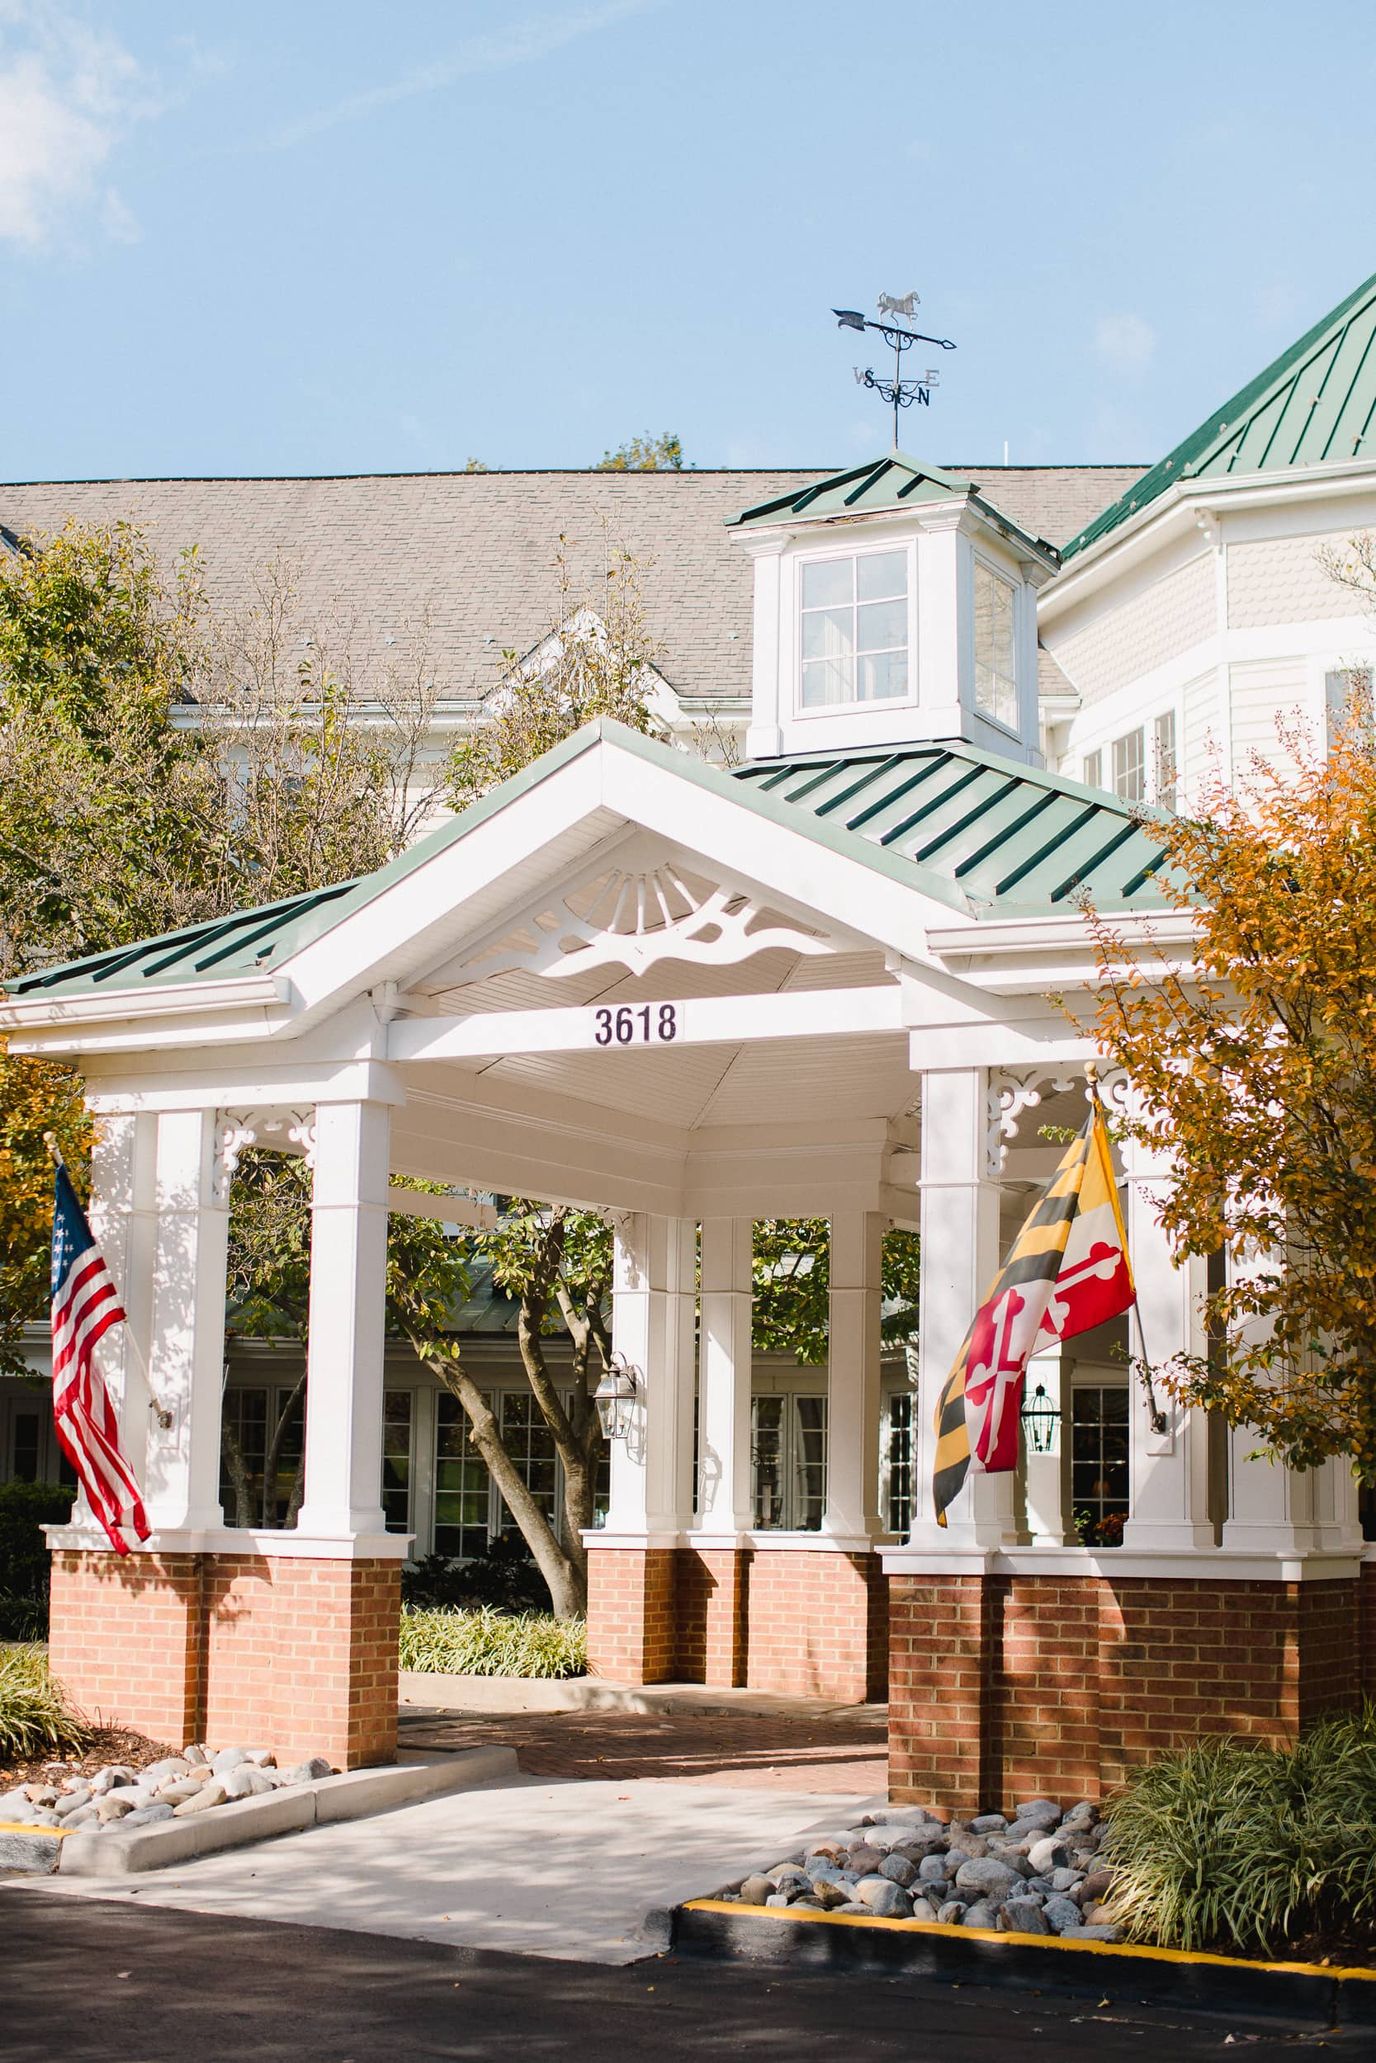
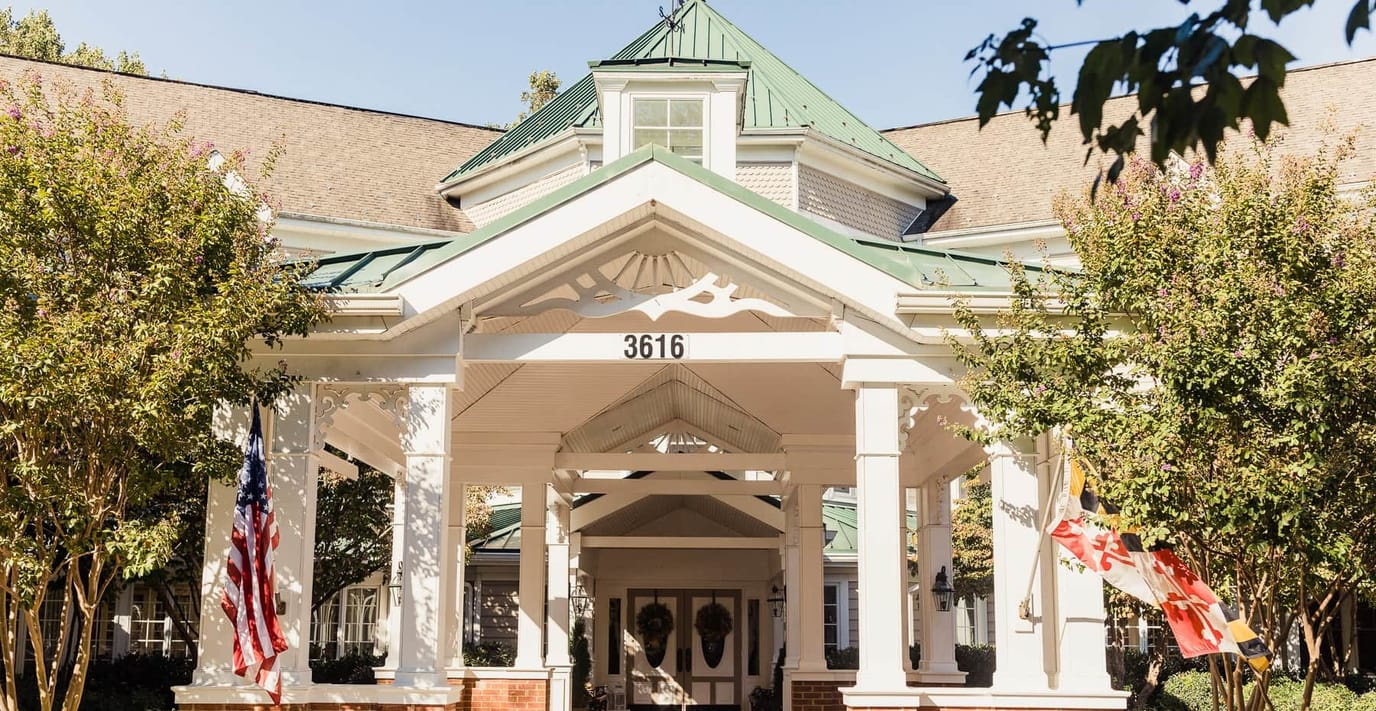
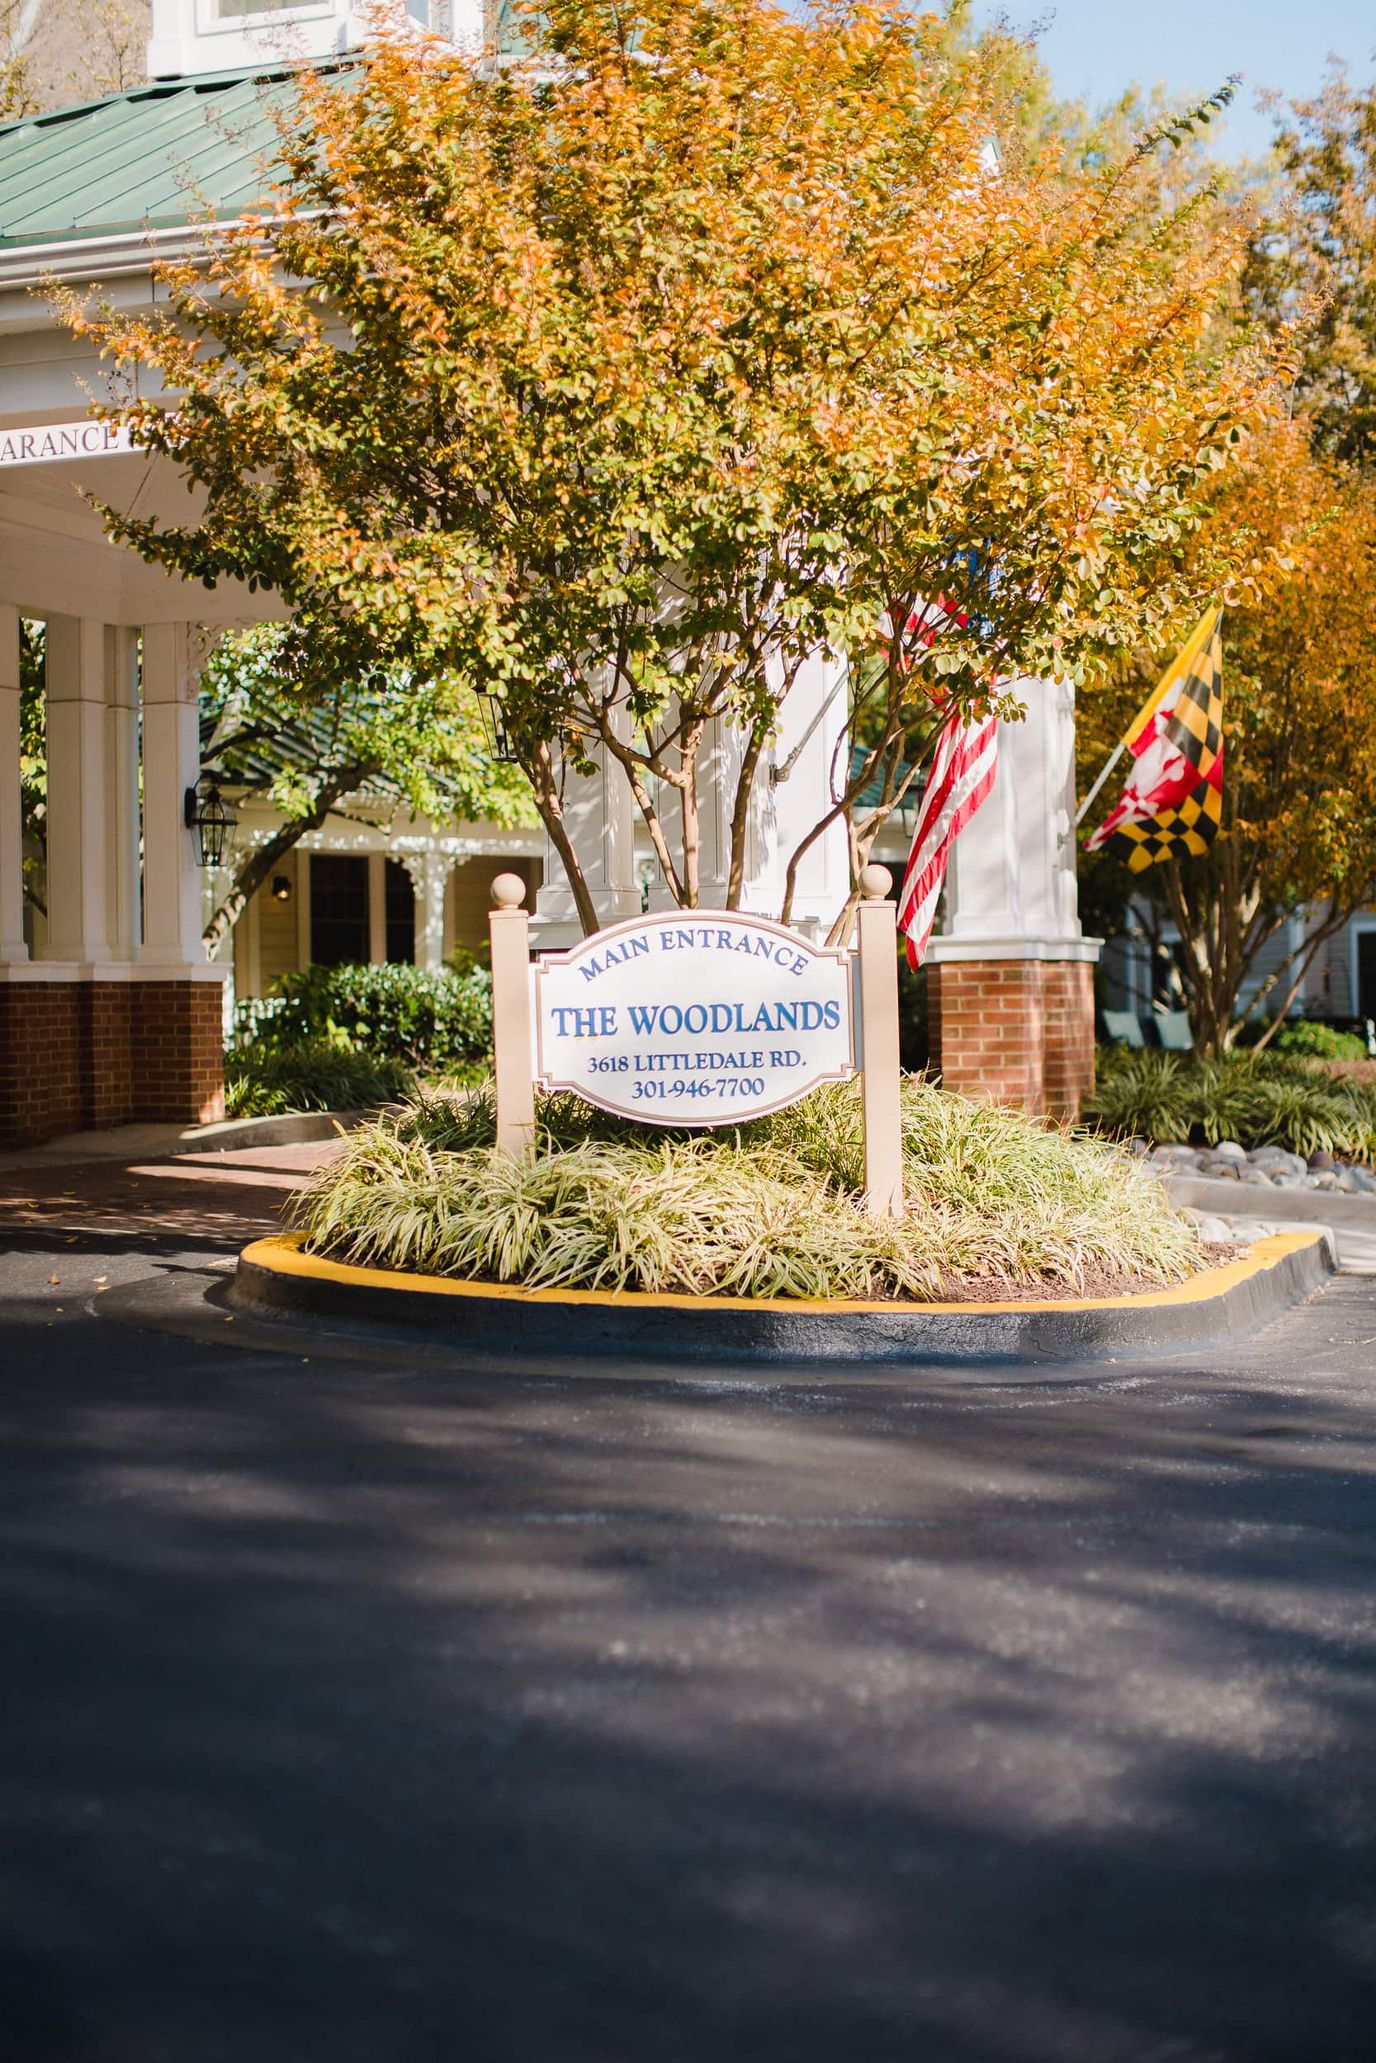
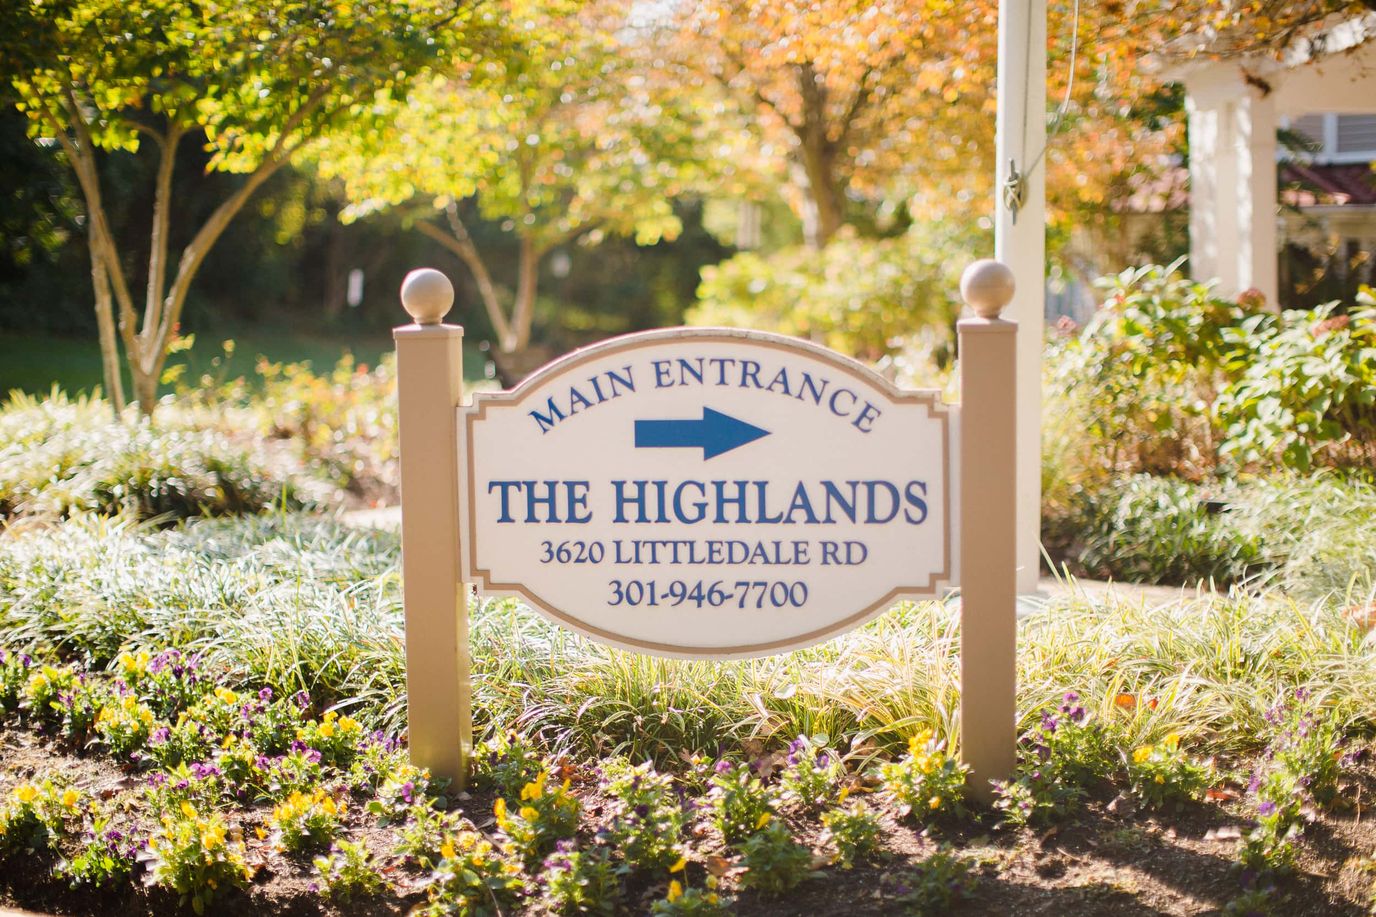
Overview of Kensington Park – Groves & Woodlands

Kensington Park – Groves & Woodlands is a 160-bed senior living community located at 3616–3618 Littledale Road in Kensington, Maryland. Serving older adults in Montgomery County, the facility operates as part of Kensington Park Senior Living and provides independent living, assisted living, memory care, and rehabilitation services.
The Maryland Department of Health, Office of Health Care Quality, oversees the inspection of this facility. No specific inspection history is reported in the current source records, and the community maintains a citations-per-inspection rate of zero. No civil money penalties or payment denials appear in the available regulatory data.
The community features specialized programming including a social and lifestyle club, post-acute rehabilitation, and an in-home care extension. A dedicated couples care program is available for residents with differing care requirements. Specific details regarding staffing ratios, on-site amenities, dining menus, and monthly pricing are not reported in the source data, so families should request these details during a tour.
Situated in Kensington, the facility suits families seeking a continuum-of-care community with specific provisions for couples requiring different levels of support. Families evaluating Kensington Park – Groves & Woodlands should confirm Medicaid acceptance, current occupancy, and the full inspection history directly with the Maryland Department of Health before making a placement decision.
Arden Courts of Kensington is a 64-bed memory care community at 4301 Knowles Avenue in Kensington, Maryland, serving the Montgomery County area. Owned by HCR ManorCare, the facility specializes in care for individuals living with Alzheimer’s disease and related dementias, providing a service model that encompasses dedicated memory care, assisted living, and short-term respite stays.
The Maryland Department of Health, Office of Health Care Quality, oversees regulatory compliance for the community. Current 2026 filings show the facility maintains a citations-per-inspection rate of zero, and records indicate that no civil money penalties or payment denials have been imposed by CMS within the past three years. While specific occupancy figures and monthly pricing are not reported in the available source data, the 64-bed capacity is dedicated to a residential setting designed to support resident independence through secure, specialized spaces.
Support is provided 24/7 by a professional team trained specifically in dementia care protocols to manage the complex needs of residents with cognitive decline. The facility design utilizes a residential living model intended to foster a familiar, low-stress environment while ensuring 24-hour monitoring and safety. Because specific data points such as caregiver-to-resident ratios, licensed nurse hours, and comparative quality measures, including fall rates or psychotropic medication use, are not currently reported, these represent information gaps that require direct inquiry.
The community features secure indoor and outdoor spaces designed specifically for those with memory impairment, though specific lists of on-site amenities and dining program details are not publicly listed. Standard services for this care level typically include assistance with all activities of daily living, housekeeping, and meal service.
Shared common areas are structured to encourage social engagement while maintaining safety. Families must confirm the specific suite layouts and emergency call system features during an on-site tour, as these details are not captured in current reporting.
Those seeking specialized dementia care in a dedicated residential environment may find this community appropriate. Interested individuals should confirm Medicaid acceptance, current occupancy status, and the full inspection history directly with the Maryland Department of Health before making a placement decision.
Ranking Methodology
How we rank these independent living communities
Every community above is evaluated across six weighted categories using public data including state inspection records, review platforms, BBB profiles, and operator-published materials.
Weighting overview
- 35%Resident Experience
- 25%Regulatory
- 15%Visual Media
- 10%Website
- 10%Stability
- 5%Environment
01
Resident & Family Experience 35%
The single largest share of every ranking. Aggregated review sentiment and volume from major platforms — the closest signal to real resident experience.
- Includes
- Review Sentiment
- Review Volume
02
Regulatory & Safety Record 25%
State inspection records, citations, and complaint visits. We weight per-inspection rates more heavily than raw counts.
- Includes
- State Inspections
- Citations/Inspection
- % Inspections w/ Citations
- Complaint Visits
- Accreditations
- BBB Rating
03
Visual Media & Transparency 15%
Communities that publish high-quality visuals give families a real preview. No photos or tours = a negative transparency signal.
- Includes
- Video Tours
- Virtual Walkthroughs
- Photo Quantity
- Photo Quality
04
Website & Operator Transparency 10%
Site quality and whether the operator publishes basic accountability information — staff names, contact details, ownership.
- Includes
- Website Content
- Mobile Usability
- Staff Info Available
- Owner Info Available
05
Community Stability 10%
Operational signals indicating whether a community is well-run and meeting demand.
- Includes
- Occupancy Rate
- Bed Options
06
Environment & Pricing 5%
Walkability and pricing transparency. Walk Score is weighted higher for Independent Living than for Memory Care, where most residents do not leave unaccompanied.
- Includes
- Walk Score
- Pricing Transparency
Who we are
Your Senior Care Partner, Every Step of the Way
We help families find affordable senior communities and unlock same day discounts, Medicaid, and Medicare options tailored to your needs.
Contact us Today
Frequently Asked Questions about Independent Living in Maryland
What is independent living?
Independent living communities are residential settings for active older adults — typically with private apartments or cottages, shared amenities (dining, fitness, activities), and no built-in medical care.
How many independent living communities are listed on this page?
This page features 164 independent living communities in Maryland. Use the filters and comparison tools above to compare ratings, amenities, and pricing.
How do I choose the right independent living community in Maryland?
Start by matching the level of care offered to the resident's current and anticipated needs, then compare licensing status, staff-to-resident ratios, recent inspection results, and pricing. Tour at least two or three communities in Maryland, talk to current residents and families, and confirm what is included in the base rate versus billed as add-on services.
What should I look for when visiting independent living communities in Maryland?
Pay attention to staff interactions with residents, cleanliness and odor, food quality at meal times, the activity calendar, and how questions about pricing and care plans are answered. Ask to see the most recent state inspection report, the move-out / level-of-care-change policy, and a sample monthly bill that lists every fee.
Updated on
