


Where in Maryland are you looking?
Browse communities by city.
Compare Independent Living around Maryland
| Edenwald Senior Living | IL AL MC NH SNF | Towson (Southerly Road) | 94
Facility
94
MD AVG
43
Rank
#144 / 690 | No |
83
Facility
83
MD AVG
43
Rank
#70 / 985 | 1 Bed / 2 Bed | - | A+ |
18% Male Residents — State Benchmarked 18% of residents are male, compared to the Maryland average of 31%. This facility caters to a majority female resident pool (82% female), consistent with the broader assisted living trend where women significantly outnumber men. |
82% Female Residents — State Benchmarked 82% of residents are female, compared to the Maryland average of 69%. Women comprise the large majority, consistent with national assisted living demographics where women live longer and enter care facilities at higher rates. |
100% White Residents — State Benchmarked 100% of residents are reported as White, compared to the Maryland average of 81%. A higher White share than is typical for assisted living in Maryland in this dataset — compare with peer facilities for local context. |
0% African American Residents — State Benchmarked 0% of residents are reported as African American or Black, compared to the Maryland average of 13%. A lower African American share than is typical in Maryland; local markets still vary widely. |
0% Other Ethnicity Residents — State Benchmarked 0% of residents fall into categories other than White or African American (combined), compared to the Maryland average of 6%. This column aggregates Hispanic, Asian, multiracial, and any other labeled groups that are not classified as White or African American. | - |
13% Residents Age 75–84 — State Benchmarked 13% of residents are 75–84, compared to the Maryland average of 31%. Below the state norm — the resident mix may skew either younger or older than this typical middle bracket. |
53% Residents Age 85–94 — State Benchmarked 53% of residents are 85–94, compared to the Maryland average of 44%. A high concentration of very elderly residents signals a higher-acuity facility with experience caring for advanced age-related needs. |
35% Residents Age 95+ — State Benchmarked 35% of residents are 95 or older, compared to the Maryland average of 16%. A high proportion of the oldest-old suggests strong end-of-life care experience and very-high-acuity capabilities. |
| Homewood Living Frederick | IL AL MC NH SNF | Frederick | 120
Facility
120
MD AVG
43
Rank
#76 / 690 | Yes |
14
Facility
14
MD AVG
43
Rank
#788 / 985 | 1 Bed / 2 Bed | - | - | - | - | - | - | - | - | - | - | - |
| Ingleside at King Farm | IL AL MC NH SNF | Rockville (King Farm) | 45
Facility
45
MD AVG
43
Rank
#226 / 690 | Yes |
73
Facility
73
MD AVG
43
Rank
#152 / 985 | 1 Bed / 2 Bed | - | - | - | - | - | - | - | - | - | - | - |
| Bedford Court, a CCRC | IL AL HOS MC NH RC SNF | Silver Spring (International Drive) | 76
Facility
76
MD AVG
43
Rank
#179 / 690 | Yes |
64
Facility
64
MD AVG
43
Rank
#261 / 985 | Studio / 1 Bed | 34
Facility
34
MD AVG
21
Rank
#22 / 210 | - |
15% Male Residents — State Benchmarked 15% of residents are male, compared to the Maryland average of 31%. This facility caters to a majority female resident pool (85% female), consistent with the broader assisted living trend where women significantly outnumber men. |
85% Female Residents — State Benchmarked 85% of residents are female, compared to the Maryland average of 69%. Women comprise the large majority, consistent with national assisted living demographics where women live longer and enter care facilities at higher rates. |
95% White Residents — State Benchmarked 95% of residents are reported as White, compared to the Maryland average of 81%. A higher White share than is typical for assisted living in Maryland in this dataset — compare with peer facilities for local context. |
3% African American Residents — State Benchmarked 3% of residents are reported as African American or Black, compared to the Maryland average of 13%. A lower African American share than is typical in Maryland; local markets still vary widely. |
2% Other Ethnicity Residents — State Benchmarked 2% of residents fall into categories other than White or African American (combined), compared to the Maryland average of 6%. This column aggregates Hispanic, Asian, multiracial, and any other labeled groups that are not classified as White or African American. Reported subgroups in this total: Asian (2%). |
2% Residents Age 65–74 — State Benchmarked 2% of residents are 65–74, compared to the Maryland average of 13%. Fewer younger seniors suggests the resident population skews older, likely requiring higher acuity care and more hands-on support. |
8% Residents Age 75–84 — State Benchmarked 8% of residents are 75–84, compared to the Maryland average of 31%. Below the state norm — the resident mix may skew either younger or older than this typical middle bracket. |
65% Residents Age 85–94 — State Benchmarked 65% of residents are 85–94, compared to the Maryland average of 44%. A high concentration of very elderly residents signals a higher-acuity facility with experience caring for advanced age-related needs. |
26% Residents Age 95+ — State Benchmarked 26% of residents are 95 or older, compared to the Maryland average of 16%. A high proportion of the oldest-old suggests strong end-of-life care experience and very-high-acuity capabilities. |
| Lutheran Village at Miller’s Grant | IL AL NH SNF | Ellicott City (Lutheran Village At Miller’s Grant) | 36
Facility
36
MD AVG
43
Rank
#237 / 690 | Yes |
19
Facility
19
MD AVG
43
Rank
#746 / 985 | 1 Bed / 2 Bed | 21
Facility
21
MD AVG
21
Rank
#108 / 210 | - |
17% Male Residents — State Benchmarked 17% of residents are male, compared to the Maryland average of 31%. This facility caters to a majority female resident pool (83% female), consistent with the broader assisted living trend where women significantly outnumber men. |
83% Female Residents — State Benchmarked 83% of residents are female, compared to the Maryland average of 69%. Women comprise the large majority, consistent with national assisted living demographics where women live longer and enter care facilities at higher rates. |
83% White Residents — State Benchmarked 83% of residents are reported as White, compared to the Maryland average of 81%. Close to the average for this category among assisted living facilities in Maryland with reported race/ethnicity data. |
11% African American Residents — State Benchmarked 11% of residents are reported as African American or Black, compared to the Maryland average of 13%. In line with the Maryland average for African American residents among facilities reporting this breakdown. |
6% Other Ethnicity Residents — State Benchmarked 6% of residents fall into categories other than White or African American (combined), compared to the Maryland average of 6%. This column aggregates Hispanic, Asian, multiracial, and any other labeled groups that are not classified as White or African American. Reported subgroups in this total: Asian (6%). | - |
33% Residents Age 75–84 — State Benchmarked 33% of residents are 75–84, compared to the Maryland average of 31%. This is the second most common age bracket in assisted living, representing residents with moderate care needs. |
44% Residents Age 85–94 — State Benchmarked 44% of residents are 85–94, compared to the Maryland average of 44%. This is typically the most common age bracket in assisted living — this facility is in line with the statewide norm. |
22% Residents Age 95+ — State Benchmarked 22% of residents are 95 or older, compared to the Maryland average of 16%. A high proportion of the oldest-old suggests strong end-of-life care experience and very-high-acuity capabilities. |
| Residences at Vantage Point | IL AL HC MC NH SNF | Columbia (Town Center) | 44
Facility
44
MD AVG
43
Rank
#229 / 690 | Yes |
52
Facility
52
MD AVG
43
Rank
#402 / 985 | Studio / 1 Bed / 2 Bed | 36
Facility
36
MD AVG
21
Rank
#16 / 210 | - | - | - | - | - | - | - | - | - | - |
| Maplewood Park Place | IL AL MC NH SNF | Bethesda (Pooks Hill) | 29
Facility
29
MD AVG
43
Rank
#247 / 690 | Yes |
38
Facility
38
MD AVG
43
Rank
#542 / 985 | 1 Bed / 2 Bed | 30
Facility
30
MD AVG
21
Rank
#44 / 210 | - |
18% Male Residents — State Benchmarked 18% of residents are male, compared to the Maryland average of 31%. This facility caters to a majority female resident pool (82% female), consistent with the broader assisted living trend where women significantly outnumber men. |
82% Female Residents — State Benchmarked 82% of residents are female, compared to the Maryland average of 69%. Women comprise the large majority, consistent with national assisted living demographics where women live longer and enter care facilities at higher rates. |
100% White Residents — State Benchmarked 100% of residents are reported as White, compared to the Maryland average of 81%. A higher White share than is typical for assisted living in Maryland in this dataset — compare with peer facilities for local context. |
0% African American Residents — State Benchmarked 0% of residents are reported as African American or Black, compared to the Maryland average of 13%. A lower African American share than is typical in Maryland; local markets still vary widely. |
0% Other Ethnicity Residents — State Benchmarked 0% of residents fall into categories other than White or African American (combined), compared to the Maryland average of 6%. This column aggregates Hispanic, Asian, multiracial, and any other labeled groups that are not classified as White or African American. | - |
6% Residents Age 75–84 — State Benchmarked 6% of residents are 75–84, compared to the Maryland average of 31%. Below the state norm — the resident mix may skew either younger or older than this typical middle bracket. |
24% Residents Age 85–94 — State Benchmarked 24% of residents are 85–94, compared to the Maryland average of 44%. The population here skews younger than the statewide norm, which may indicate a more active, lower-acuity community. |
71% Residents Age 95+ — State Benchmarked 71% of residents are 95 or older, compared to the Maryland average of 16%. A high proportion of the oldest-old suggests strong end-of-life care experience and very-high-acuity capabilities. |
| Friends House Retirement Community | IL AL NH SNF | Sandy Spring | 24
Facility
24
MD AVG
43
Rank
#249 / 690 | No |
6
Facility
6
MD AVG
43
Rank
#891 / 985 | - | 20
Facility
20
MD AVG
21
Rank
#112 / 210 | - |
6% Male Residents — State Benchmarked 6% of residents are male, compared to the Maryland average of 31%. This facility caters to a majority female resident pool (94% female), consistent with the broader assisted living trend where women significantly outnumber men. |
94% Female Residents — State Benchmarked 94% of residents are female, compared to the Maryland average of 69%. Women comprise the large majority, consistent with national assisted living demographics where women live longer and enter care facilities at higher rates. |
94% White Residents — State Benchmarked 94% of residents are reported as White, compared to the Maryland average of 81%. A higher White share than is typical for assisted living in Maryland in this dataset — compare with peer facilities for local context. |
0% African American Residents — State Benchmarked 0% of residents are reported as African American or Black, compared to the Maryland average of 13%. A lower African American share than is typical in Maryland; local markets still vary widely. |
6% Other Ethnicity Residents — State Benchmarked 6% of residents fall into categories other than White or African American (combined), compared to the Maryland average of 6%. This column aggregates Hispanic, Asian, multiracial, and any other labeled groups that are not classified as White or African American. Reported subgroups in this total: Asian (6%). |
6% Residents Age 65–74 — State Benchmarked 6% of residents are 65–74, compared to the Maryland average of 13%. Fewer younger seniors suggests the resident population skews older, likely requiring higher acuity care and more hands-on support. |
18% Residents Age 75–84 — State Benchmarked 18% of residents are 75–84, compared to the Maryland average of 31%. Below the state norm — the resident mix may skew either younger or older than this typical middle bracket. |
53% Residents Age 85–94 — State Benchmarked 53% of residents are 85–94, compared to the Maryland average of 44%. A high concentration of very elderly residents signals a higher-acuity facility with experience caring for advanced age-related needs. |
24% Residents Age 95+ — State Benchmarked 24% of residents are 95 or older, compared to the Maryland average of 16%. A high proportion of the oldest-old suggests strong end-of-life care experience and very-high-acuity capabilities. |
| Revitz House | IL AL HC MC NH SNF | Rockville | 558
Facility
558
MD AVG
43
Rank
#1 / 690 | Yes |
81
Facility
81
MD AVG
43
Rank
#86 / 985 | 1 Bed | - | - | - | - | - | - | - | - | - | - | - |
| Broadmead | IL AL MC NH RC SNF | Cockeysville | 40
Facility
40
MD AVG
43
Rank
#233 / 690 | No |
0
Facility
0
MD AVG
43
Rank
#959 / 985 | - | 47
Facility
47
MD AVG
21
Rank
#3 / 210 | A+ | - | - | - | - | - | - | - | - | - |
| Blakehurst (Chestnut Green) | IL AL MC NH SNF | Towson | 35
Facility
35
MD AVG
43
Rank
#239 / 690 | No |
10
Facility
10
MD AVG
43
Rank
#837 / 985 | - | 33
Facility
33
MD AVG
21
Rank
#25 / 210 | - | - | - | - | - | - | - | - | - | - |
| Asbury Methodist Village | IL AL MC NH SNF | Gaithersburg (Russell Avenue) | 164
Facility
164
MD AVG
43
Rank
#26 / 690 | Yes |
41
Facility
41
MD AVG
43
Rank
#508 / 985 | - | 27
Facility
27
MD AVG
21
Rank
#62 / 210 | - |
21% Male Residents — State Benchmarked 21% of residents are male, compared to the Maryland average of 31%. This facility caters to a majority female resident pool (79% female), consistent with the broader assisted living trend where women significantly outnumber men. |
79% Female Residents — State Benchmarked 79% of residents are female, compared to the Maryland average of 69%. Women comprise the large majority, consistent with national assisted living demographics where women live longer and enter care facilities at higher rates. |
92% White Residents — State Benchmarked 92% of residents are reported as White, compared to the Maryland average of 81%. A higher White share than is typical for assisted living in Maryland in this dataset — compare with peer facilities for local context. |
1% African American Residents — State Benchmarked 1% of residents are reported as African American or Black, compared to the Maryland average of 13%. A lower African American share than is typical in Maryland; local markets still vary widely. |
7% Other Ethnicity Residents — State Benchmarked 7% of residents fall into categories other than White or African American (combined), compared to the Maryland average of 6%. This column aggregates Hispanic, Asian, multiracial, and any other labeled groups that are not classified as White or African American. Reported subgroups in this total: Asian (7%). |
1% Residents Age 65–74 — State Benchmarked 1% of residents are 65–74, compared to the Maryland average of 13%. Fewer younger seniors suggests the resident population skews older, likely requiring higher acuity care and more hands-on support. |
21% Residents Age 75–84 — State Benchmarked 21% of residents are 75–84, compared to the Maryland average of 31%. Below the state norm — the resident mix may skew either younger or older than this typical middle bracket. |
48% Residents Age 85–94 — State Benchmarked 48% of residents are 85–94, compared to the Maryland average of 44%. This is typically the most common age bracket in assisted living — this facility is in line with the statewide norm. |
30% Residents Age 95+ — State Benchmarked 30% of residents are 95 or older, compared to the Maryland average of 16%. A high proportion of the oldest-old suggests strong end-of-life care experience and very-high-acuity capabilities. |
| Ginger Cove | IL AL HC MC NH SNF | Annapolis (River Crescent Drive) | 96
Facility
96
MD AVG
43
Rank
#136 / 690 | No |
51
Facility
51
MD AVG
43
Rank
#413 / 985 | 1 Bed / 2 Bed | 42
Facility
42
MD AVG
21
Rank
#8 / 210 | A+ |
40% Male Residents — State Benchmarked 40% of residents are male, compared to the Maryland average of 31%. A relatively balanced gender mix for assisted living, where facilities typically skew heavily female. |
60% Female Residents — State Benchmarked 60% of residents are female, compared to the Maryland average of 69%. Closer to an even gender split than most assisted living facilities, which typically have 65–75% female residents. |
100% White Residents — State Benchmarked 100% of residents are reported as White, compared to the Maryland average of 81%. A higher White share than is typical for assisted living in Maryland in this dataset — compare with peer facilities for local context. |
0% African American Residents — State Benchmarked 0% of residents are reported as African American or Black, compared to the Maryland average of 13%. A lower African American share than is typical in Maryland; local markets still vary widely. |
0% Other Ethnicity Residents — State Benchmarked 0% of residents fall into categories other than White or African American (combined), compared to the Maryland average of 6%. This column aggregates Hispanic, Asian, multiracial, and any other labeled groups that are not classified as White or African American. | - |
13% Residents Age 75–84 — State Benchmarked 13% of residents are 75–84, compared to the Maryland average of 31%. Below the state norm — the resident mix may skew either younger or older than this typical middle bracket. |
64% Residents Age 85–94 — State Benchmarked 64% of residents are 85–94, compared to the Maryland average of 44%. A high concentration of very elderly residents signals a higher-acuity facility with experience caring for advanced age-related needs. |
22% Residents Age 95+ — State Benchmarked 22% of residents are 95 or older, compared to the Maryland average of 16%. A high proportion of the oldest-old suggests strong end-of-life care experience and very-high-acuity capabilities. |
| Charlestown Community | IL NH | Baltimore | 238
Facility
238
MD AVG
43
Rank
#5 / 690 | No |
36
Facility
36
MD AVG
43
Rank
#563 / 985 | - | 35
Facility
35
MD AVG
21
Rank
#18 / 210 | - | - | - | - | - | - | - | - | - | - |
| Pickersgill Retirement Community | IL AL NH SNF | Baltimore (Chestnut Hill) | 138
Facility
138
MD AVG
43
Rank
#56 / 690 | No |
45
Facility
45
MD AVG
43
Rank
#475 / 985 | - | - | A+ |
24% Male Residents — State Benchmarked 24% of residents are male, compared to the Maryland average of 31%. This facility caters to a majority female resident pool (76% female), consistent with the broader assisted living trend where women significantly outnumber men. |
76% Female Residents — State Benchmarked 76% of residents are female, compared to the Maryland average of 69%. Women comprise the large majority, consistent with national assisted living demographics where women live longer and enter care facilities at higher rates. |
95% White Residents — State Benchmarked 95% of residents are reported as White, compared to the Maryland average of 81%. A higher White share than is typical for assisted living in Maryland in this dataset — compare with peer facilities for local context. |
1% African American Residents — State Benchmarked 1% of residents are reported as African American or Black, compared to the Maryland average of 13%. A lower African American share than is typical in Maryland; local markets still vary widely. |
4% Other Ethnicity Residents — State Benchmarked 4% of residents fall into categories other than White or African American (combined), compared to the Maryland average of 6%. This column aggregates Hispanic, Asian, multiracial, and any other labeled groups that are not classified as White or African American. Reported subgroups in this total: Asian (4%). |
3% Residents Age 65–74 — State Benchmarked 3% of residents are 65–74, compared to the Maryland average of 13%. Fewer younger seniors suggests the resident population skews older, likely requiring higher acuity care and more hands-on support. |
27% Residents Age 75–84 — State Benchmarked 27% of residents are 75–84, compared to the Maryland average of 31%. This is the second most common age bracket in assisted living, representing residents with moderate care needs. |
55% Residents Age 85–94 — State Benchmarked 55% of residents are 85–94, compared to the Maryland average of 44%. A high concentration of very elderly residents signals a higher-acuity facility with experience caring for advanced age-related needs. |
15% Residents Age 95+ — State Benchmarked 15% of residents are 95 or older, compared to the Maryland average of 16%. In line with the statewide profile for the oldest resident bracket. |
Rows per page:

View all Nearby Homes
Overview of Kentlands Manor Senior Apartments

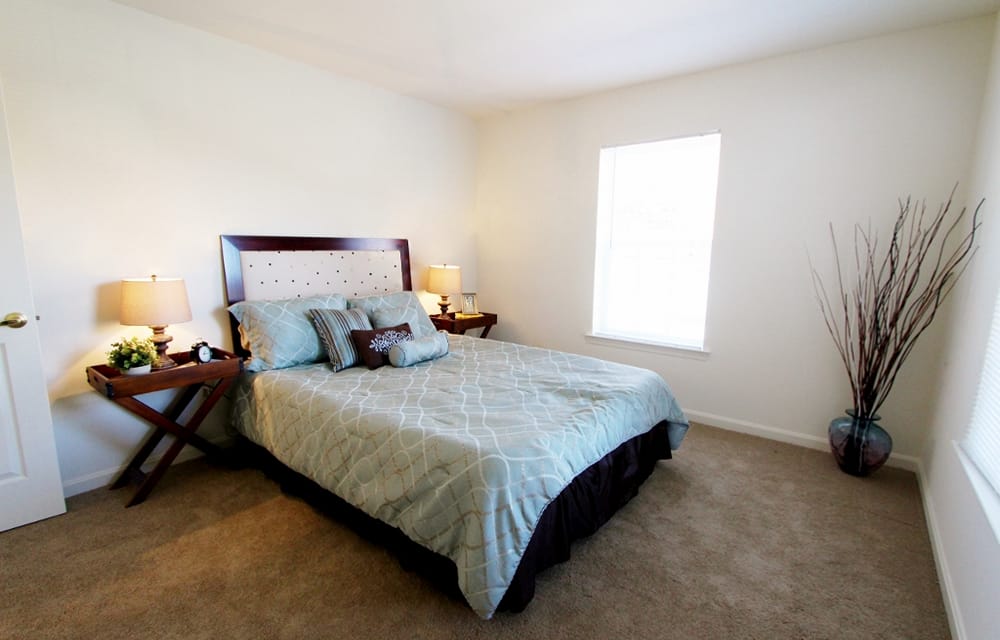
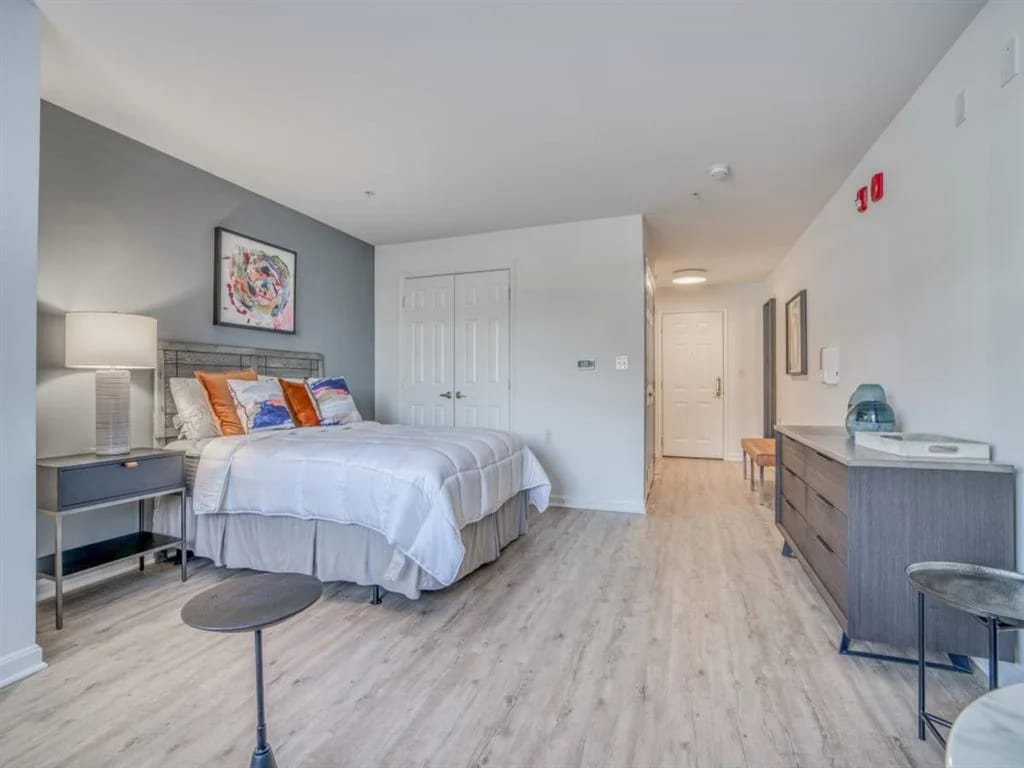
Kentlands Manor Senior Apartments is a distinguished community in the vibrant residential area of Booth Street, Gaithersburg, MD, that offers independent living. For 62+ residents, the community features spacious and snug one- and two-bedroom accommodations, ensuring their comfort and safety. With the community’s warm and welcoming environment, residents are encouraged to interact with their surroundings.
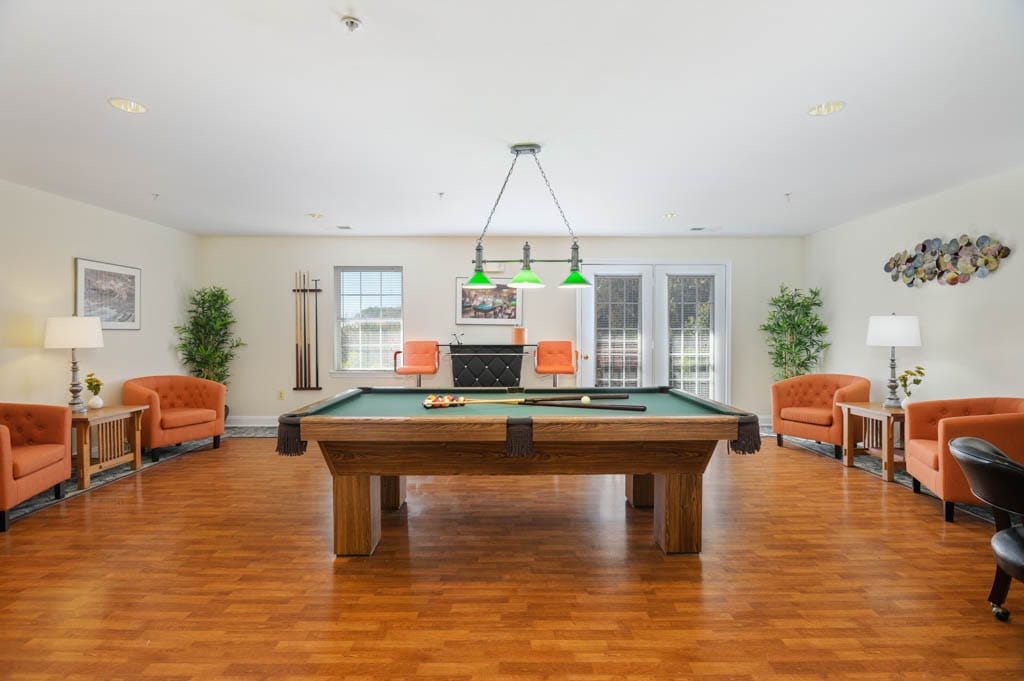
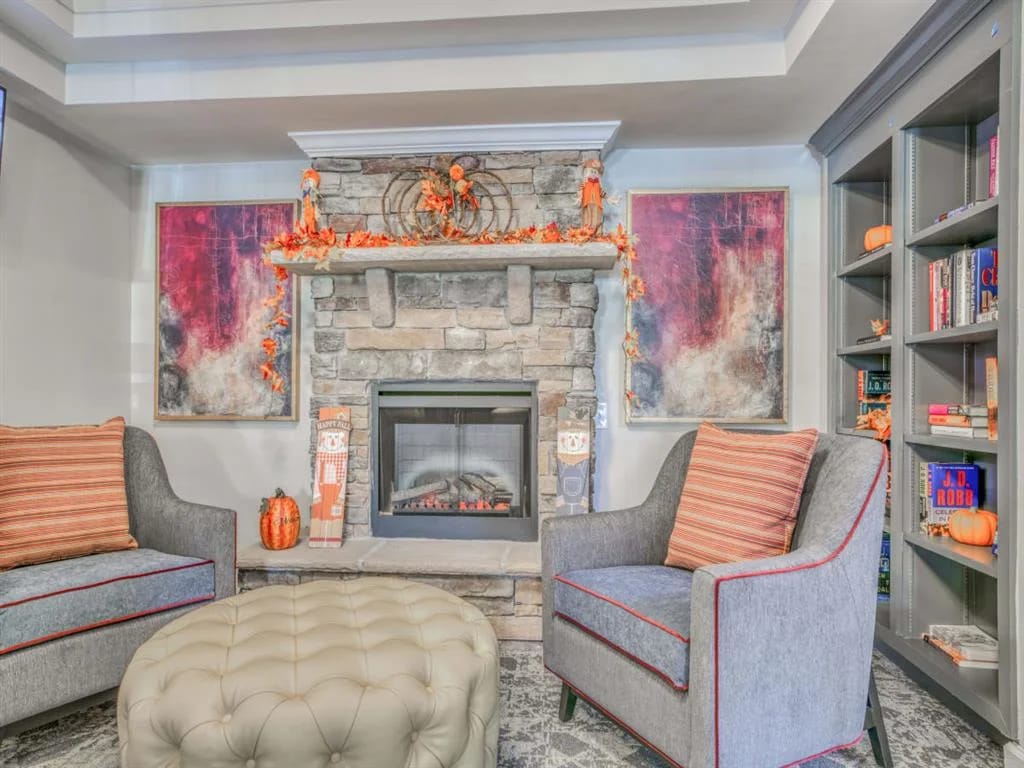
The community also conducts enriching activities and engaging programs, allowing residents to choose the best that fits their preferred lifestyle. With plenty of delightful restaurants nearby and a well-equipped kitchen, residents enjoy mealtimes that satisfy their dietary needs and preferences. Amenities also include a billiards room, a movie lounge, a library, a beauty salon, and a fitness center, creating the perfect backdrop for recreation and socialization.
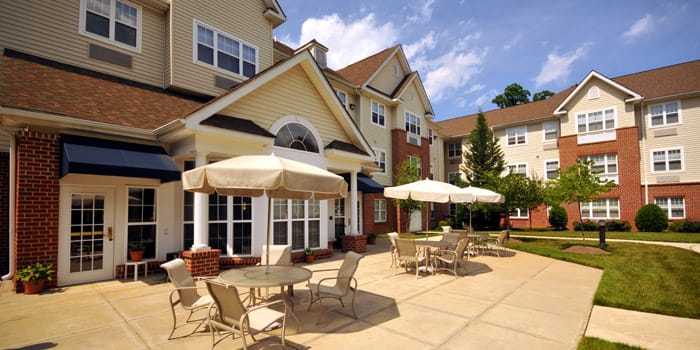
Ideally situated near MedStart Health: Medical Center at Leisure World Boulevard in Norbeck Road, Silver Spring, MD, Hampshire Village is a distinguished community that offers independent living. Here, residents choose from cozy and specially designed one- and two-bedroom accommodations, ensuring their comfort and convenience. The community is also equipped with an emergency pull cord, grab bars, smoke detectors, and sprinkler systems to ease residents’ worries.
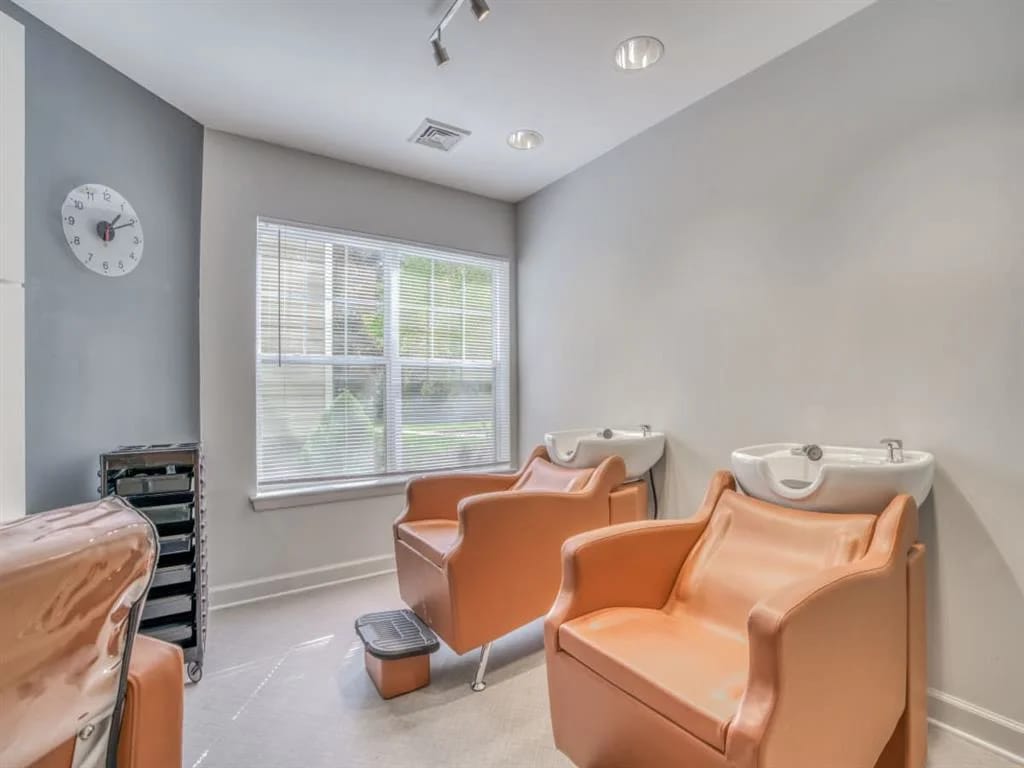
With various fun activities and engaging programs, residents are encouraged to live actively and interact with their friends. Residents also enjoy mealtimes with the community’s breakfast bar and fully equipped kitchens, ensuring the finest dining experience. The community also features a variety of amenities, including a beauty salon, a business center, a cafe, a fitness center, a library, beautifully landscaped courtyards, and serene walking paths, creating the perfect backdrop for a vibrant retirement.
Age gracefully at Charles E. Smith Life Communities-Revitz House, a distinguished community located in the harmonious neighborhood of Rockville, MD, offering independent living. Beautifully designed one-bedroom floor plans are provided in a warm and welcoming environment, ensuring residents are comfortable and safe. A 24-hour concierge and a personal emergency response system are available for residents’ safety.
Residents will not run out of things to do, with plenty of recreational opportunities and engaging programs. Delightful dining options are also available, ensuring residents have the finest dining experience that caters to their dietary needs and preferences. Filled with state-of-the-art amenities and exceptional services, the community ensures residents have the finest retirement experience.
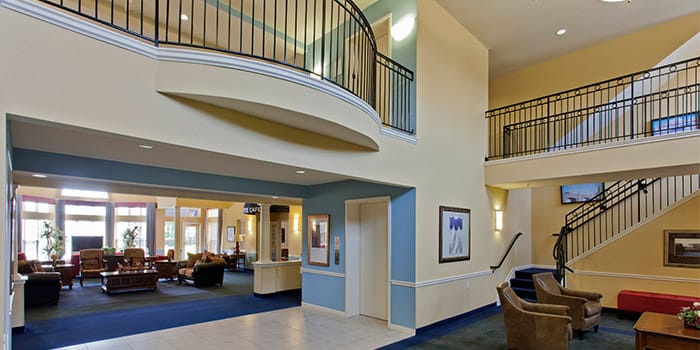
Overview of Kensington Park Senior Living

Situated on Littledale Road in Kensington, Maryland, Kensington Park Senior Living is a residential care community that offers independent living, assisted living, and memory care. Residents can choose between private and semi-private accommodations within a three-story setting.
The neighborhood has a walkability score of 49, allowing access to some nearby destinations on foot, while most errands require transportation. Designed to support varying levels of care, the community also serves older adults seeking an active lifestyle as well as those needing daily assistance or specialized memory care.
Weinberg Woods sits in Baltimore’s Cheswolde neighborhood, built specifically for people 62 and up who want their own apartment without the upkeep. It’s a mid-rise, one-bedroom units only, smoke-free, and pets are welcome. Walk Score comes in at 36 here, so most trips mean getting in a car, this isn’t a walk-everywhere kind of location.
Inside, there’s a fitness center, a library, a media room, and a common dining room for residents who want company at mealtime. A shuttle runs residents out to shops and restaurants nearby, which matters a lot once driving becomes less appealing or less possible. Controlled access entry and 24-hour emergency maintenance cover the security and “something’s broken at midnight” side of things.
Here’s what actually sets this place apart: a Kosher Eating Together Program built into the community’s regular offerings, plus an Active Residents’ Association that gives residents real input into what happens here. There’s also a service coordinator whose job is specifically to keep people engaged and connected, not just housed.
Independent living means exactly what it sounds like. No daily care built in, no medical staff on-site, residents are running their own lives here. What Weinberg Woods offers on top of that baseline is structure without hovering: a shuttle instead of a car requirement, a dining room instead of eating alone, cultural and social programming instead of just four walls. For someone who wants independence with a built-in community around it, particularly one with Jewish cultural life woven in, this is what that looks like on paper.
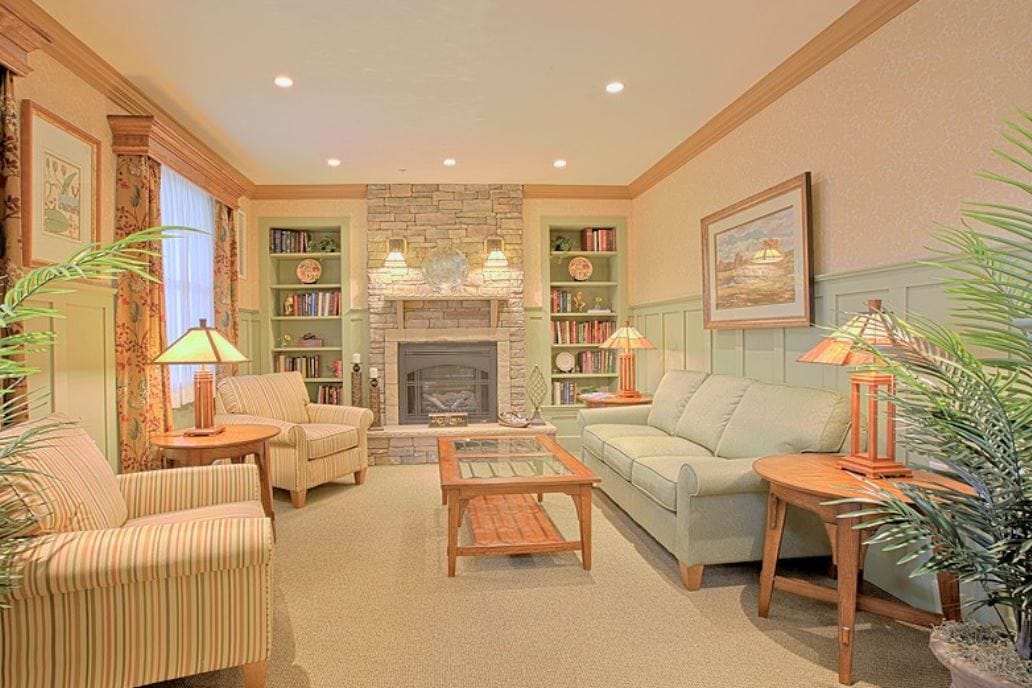
Overview of Victoria Park at Walkersville
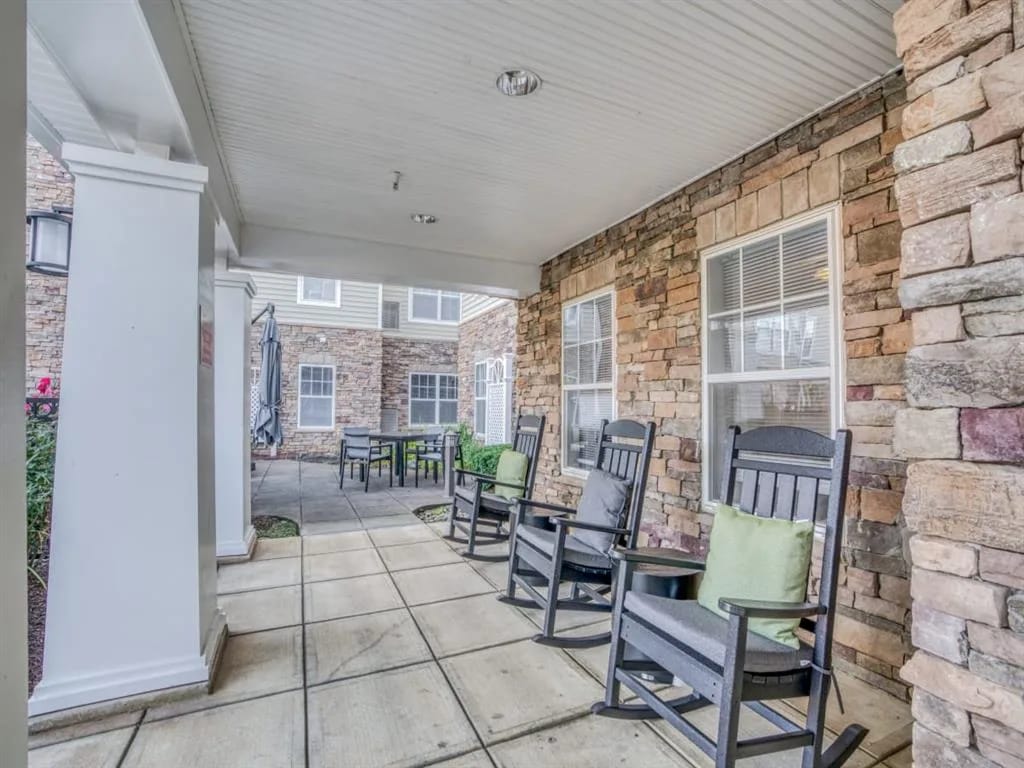
Nestling in Walkersville, Victoria Park, provides quality senior living for 62+ retirees in Maryland. The vibrant home offers the best convenience and comfort for seniors who want to stay active and have a quaint lifestyle. The nurturing environment empowers and enhances the quality of life for residents by tailored care to each unique individual. Victoria Park approaches senior living in a modern way that embraces and enriches its residents’ overall wellness.
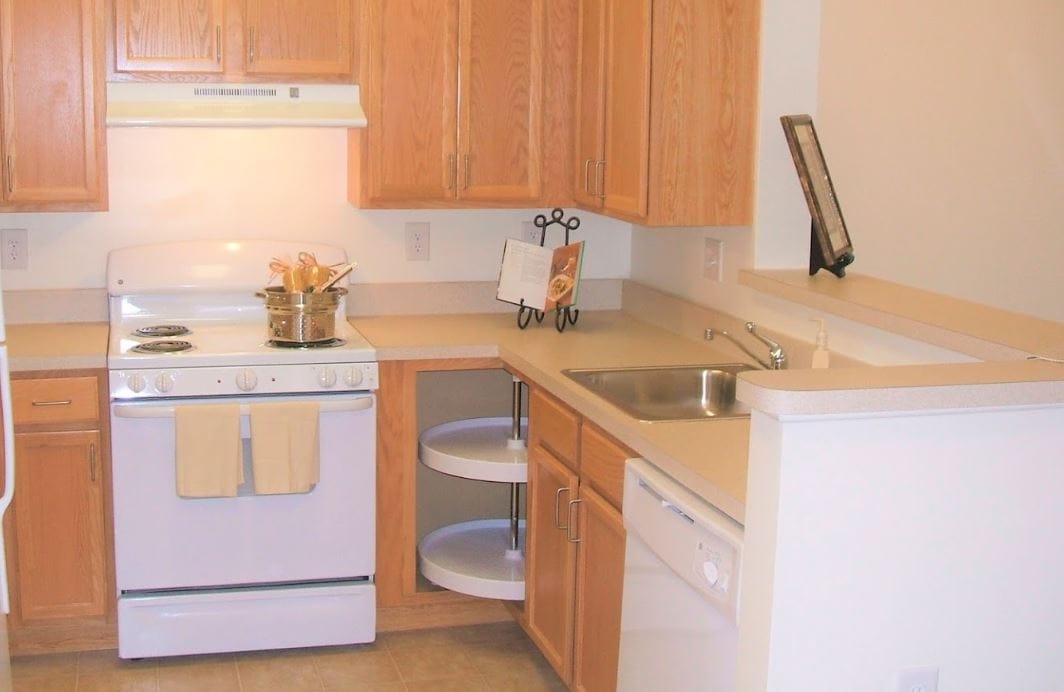
Community amenities and services include washer/dryer hookups, transportation services, bathroom grab bars, airconditioning, a dishwasher, a complete kitchenette, outdoor patios, parking, a health and wellness center, a library, billiards, and social events.
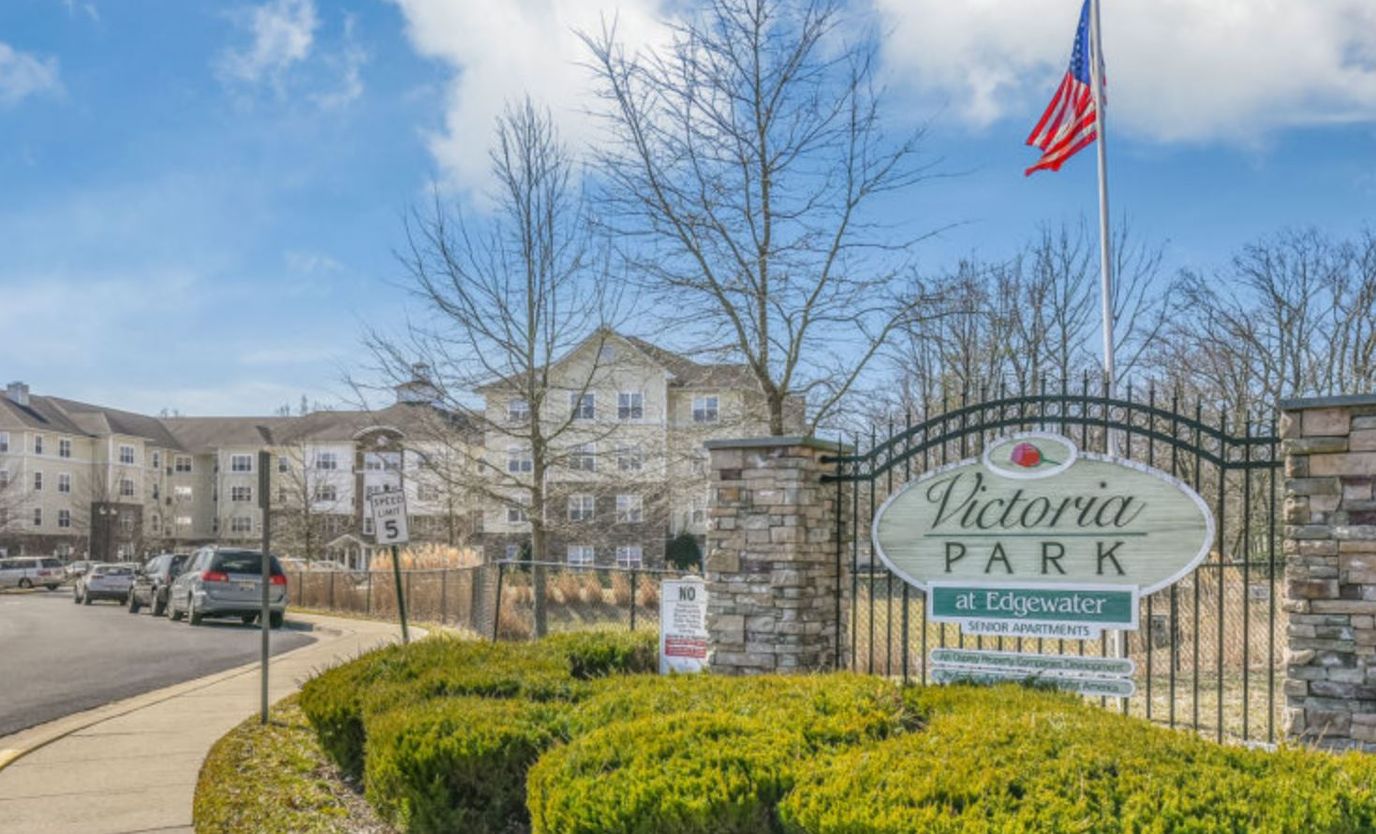
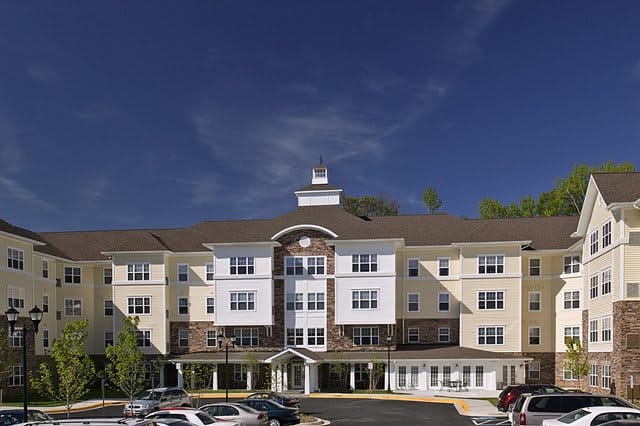
Victoria Park at Edgewater is an assisted living community that offers a comfortable lifestyle to seniors aged 62 and above. This pet-friendly community nestled in Anne Arundel County offers a fresh approach to senior apartment living. Victoria Park at Edgewater offers a range of amenities, including a fitness center, arts & crafts area, and well-maintained grounds. The caring on-site staff ensures a high standard of living for Avanath Communities residents.
Experience a welcoming atmosphere at Victoria Park at Edgewater, where a fulfilling lifestyle is within easy reach. Residents can get access to the billiards room or enjoy socializing in the community room. The one and two-bedroom floor plans feature modern amenities like fully-equipped kitchens with breakfast bars and spacious closets.
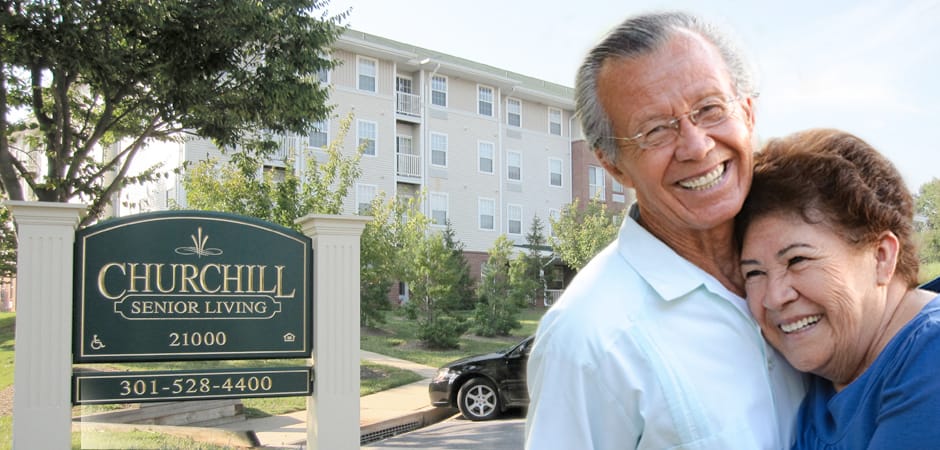
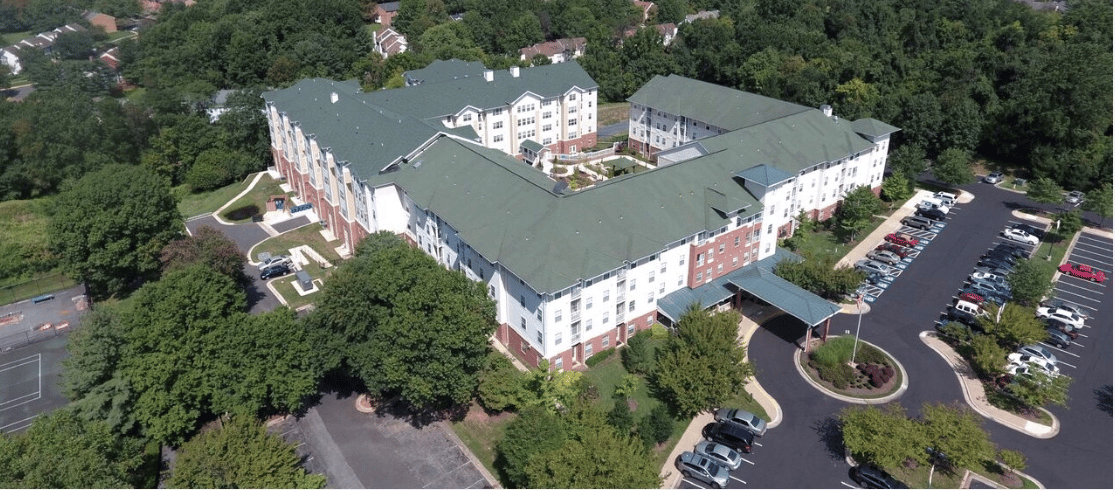
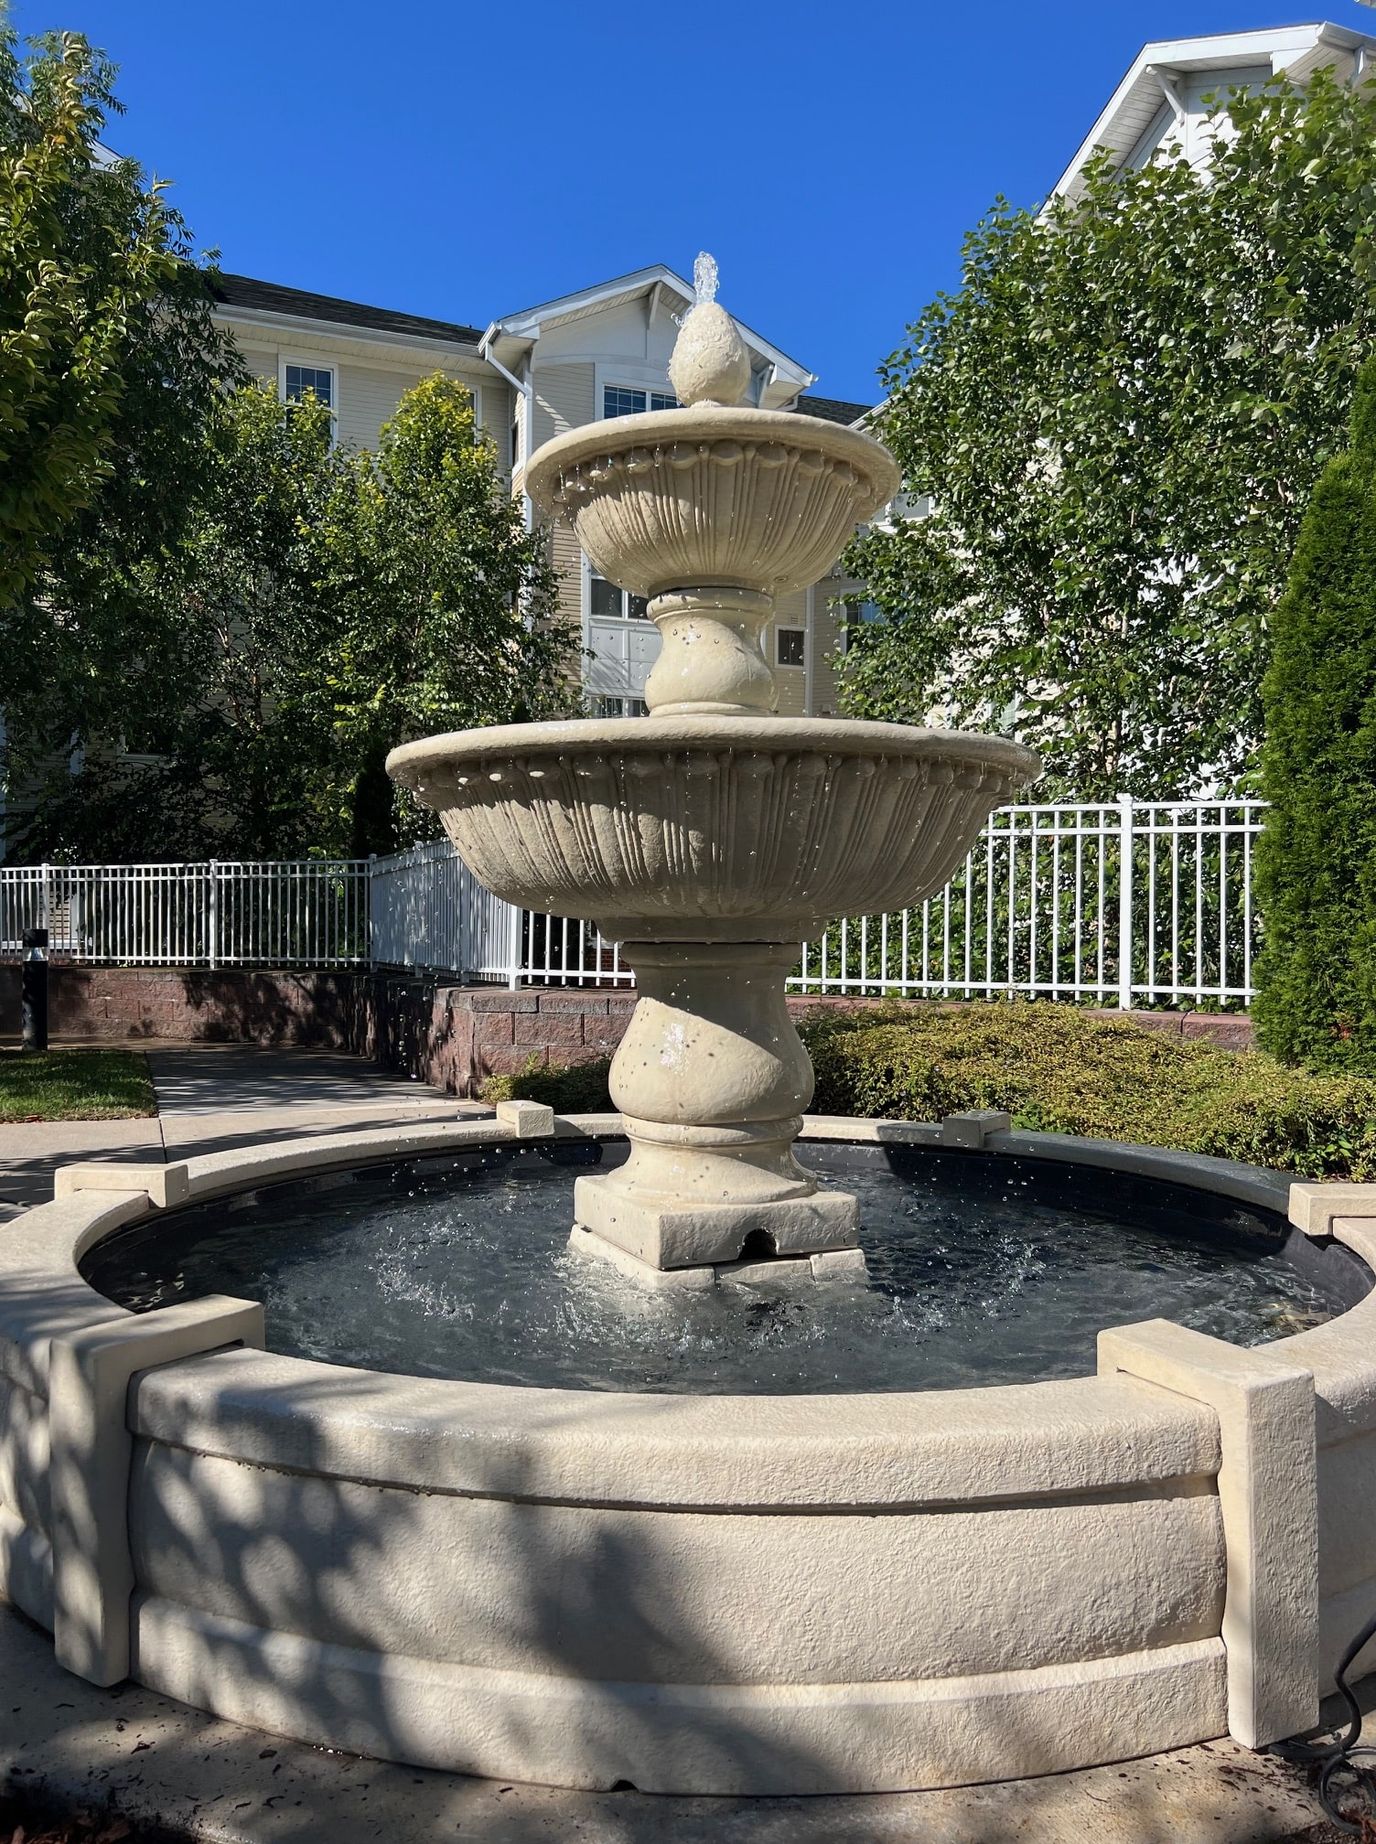
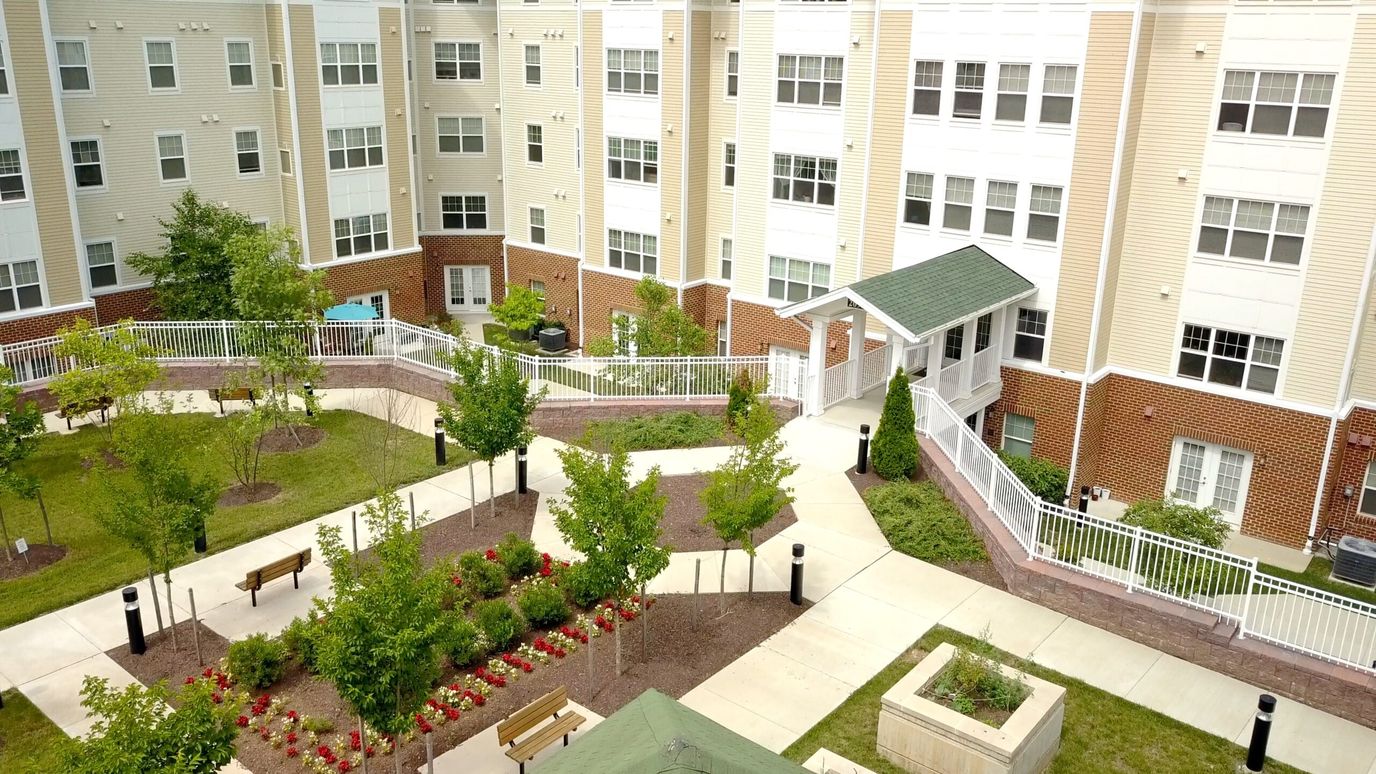
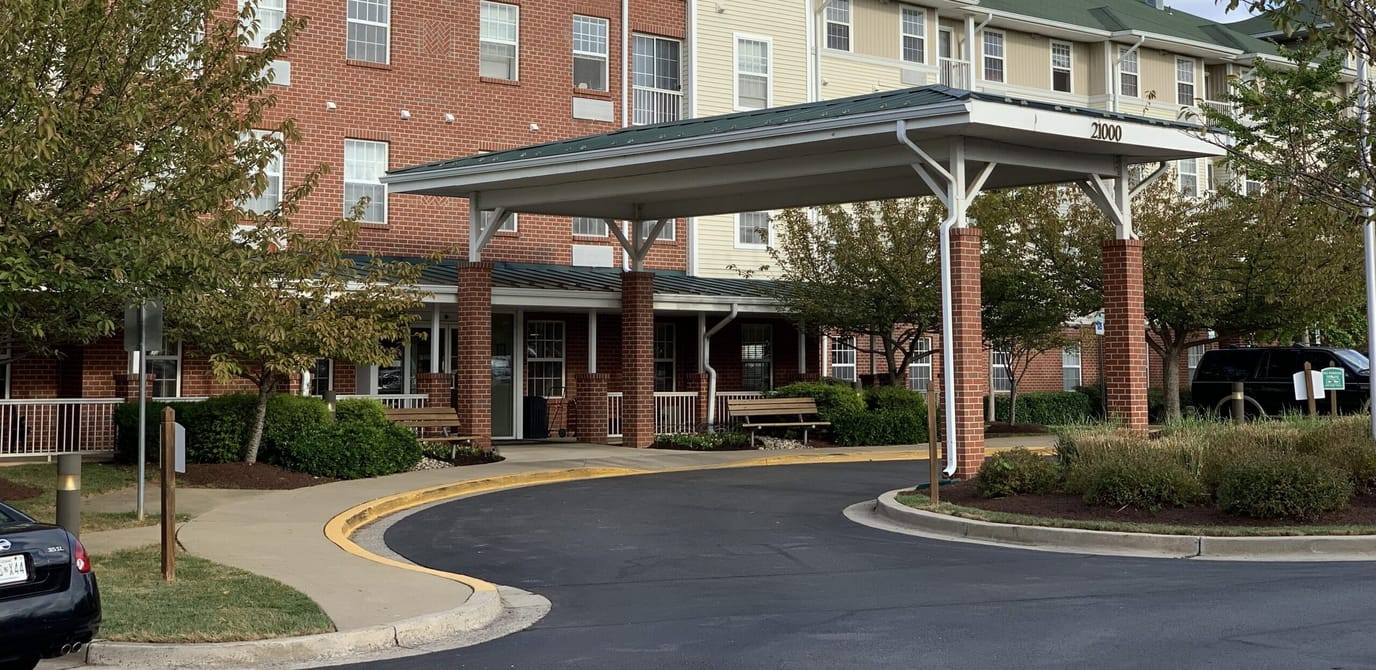
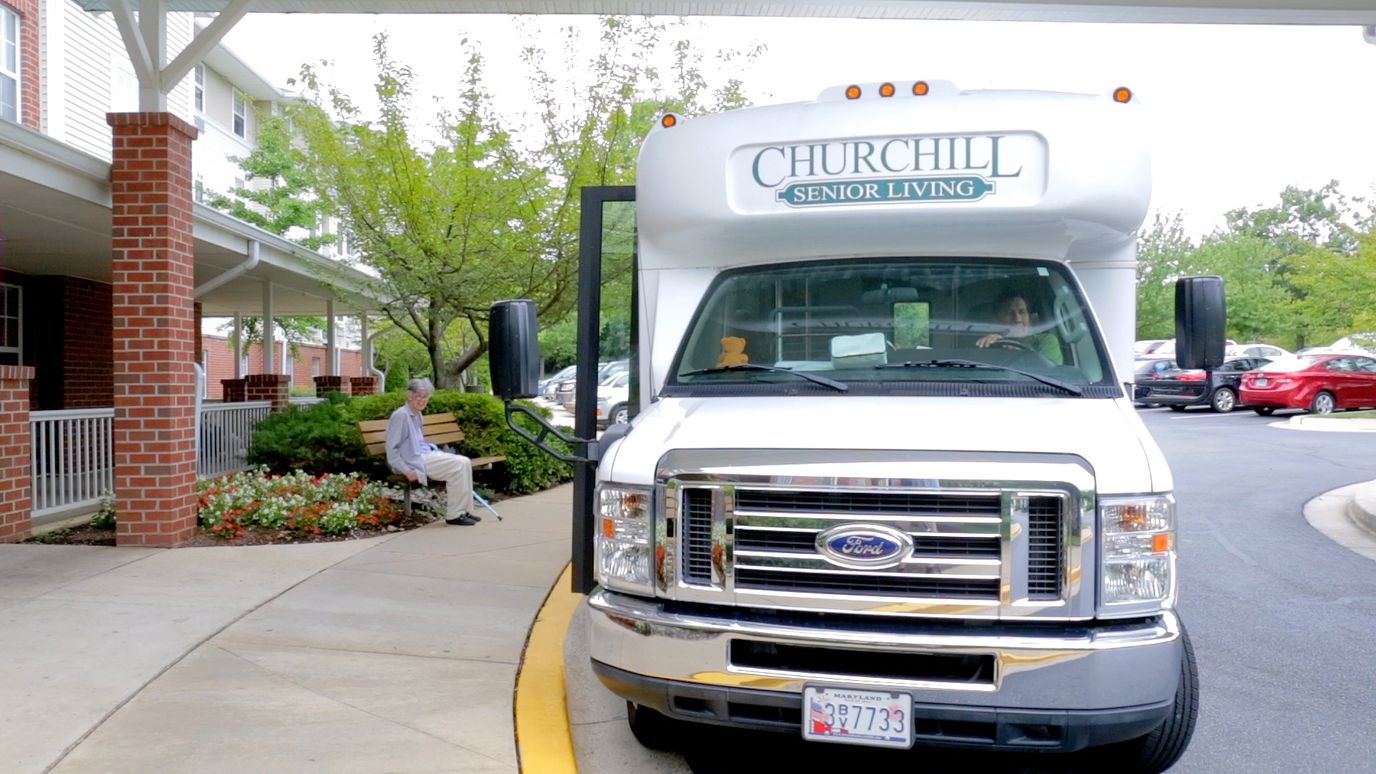
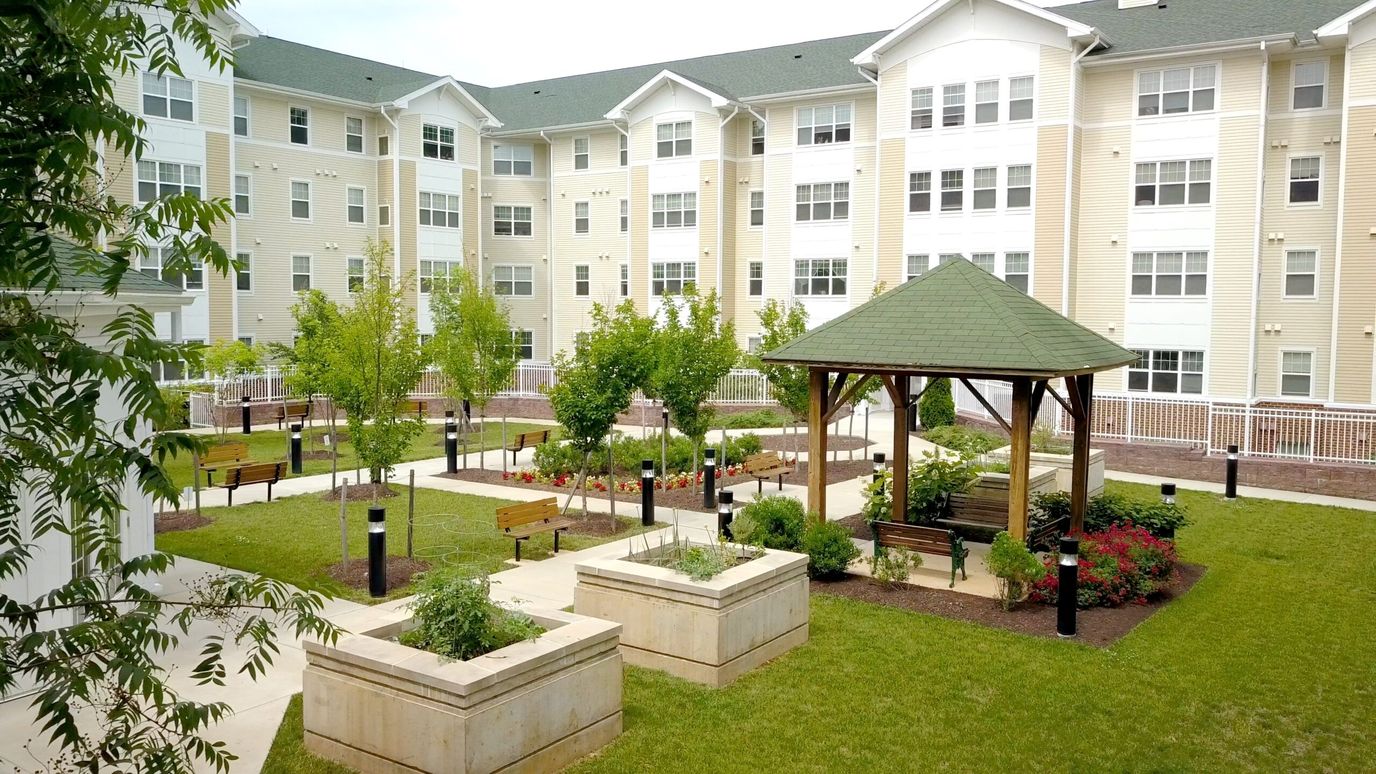
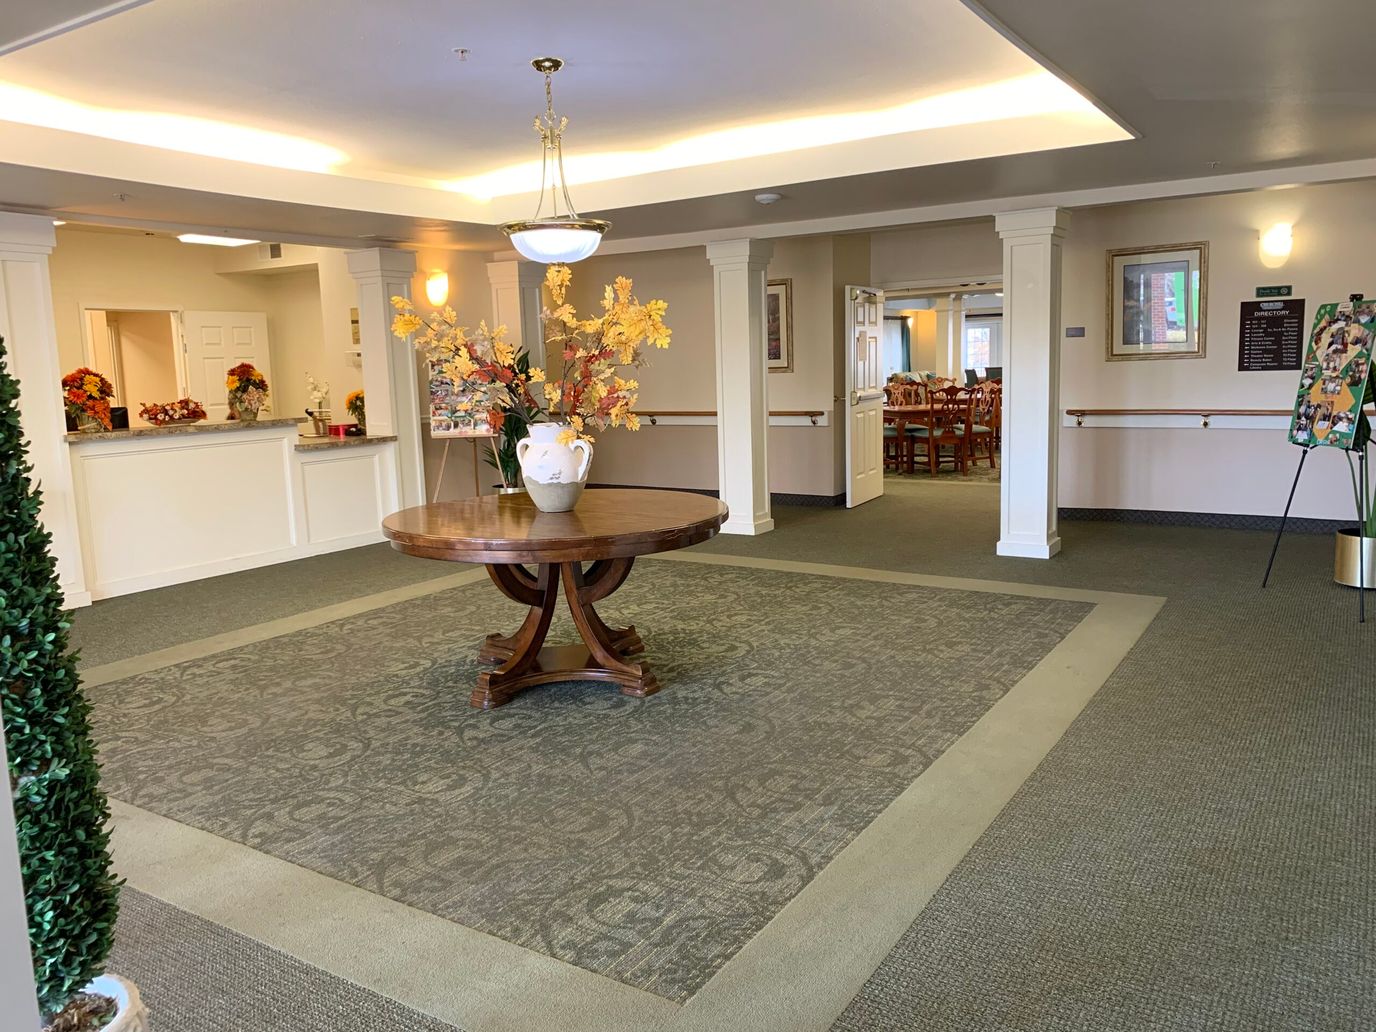
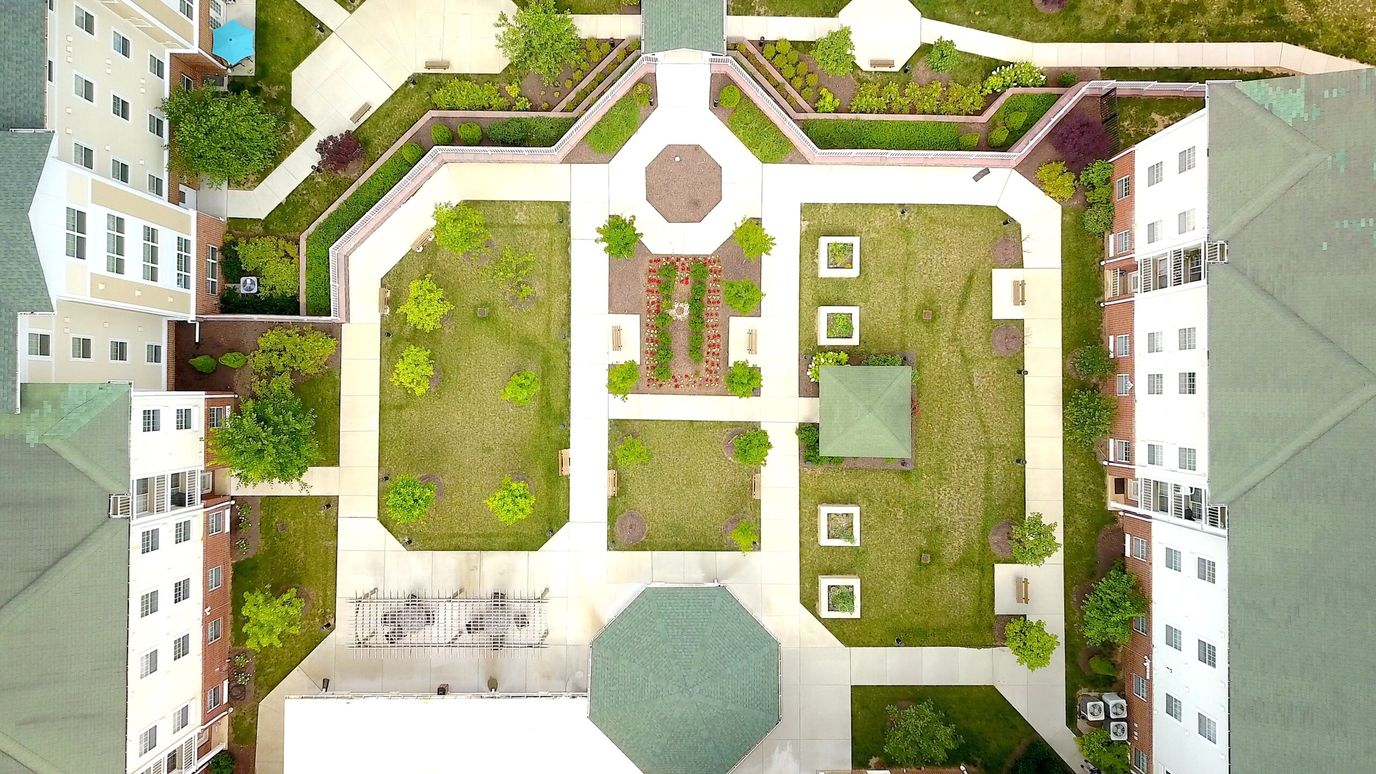
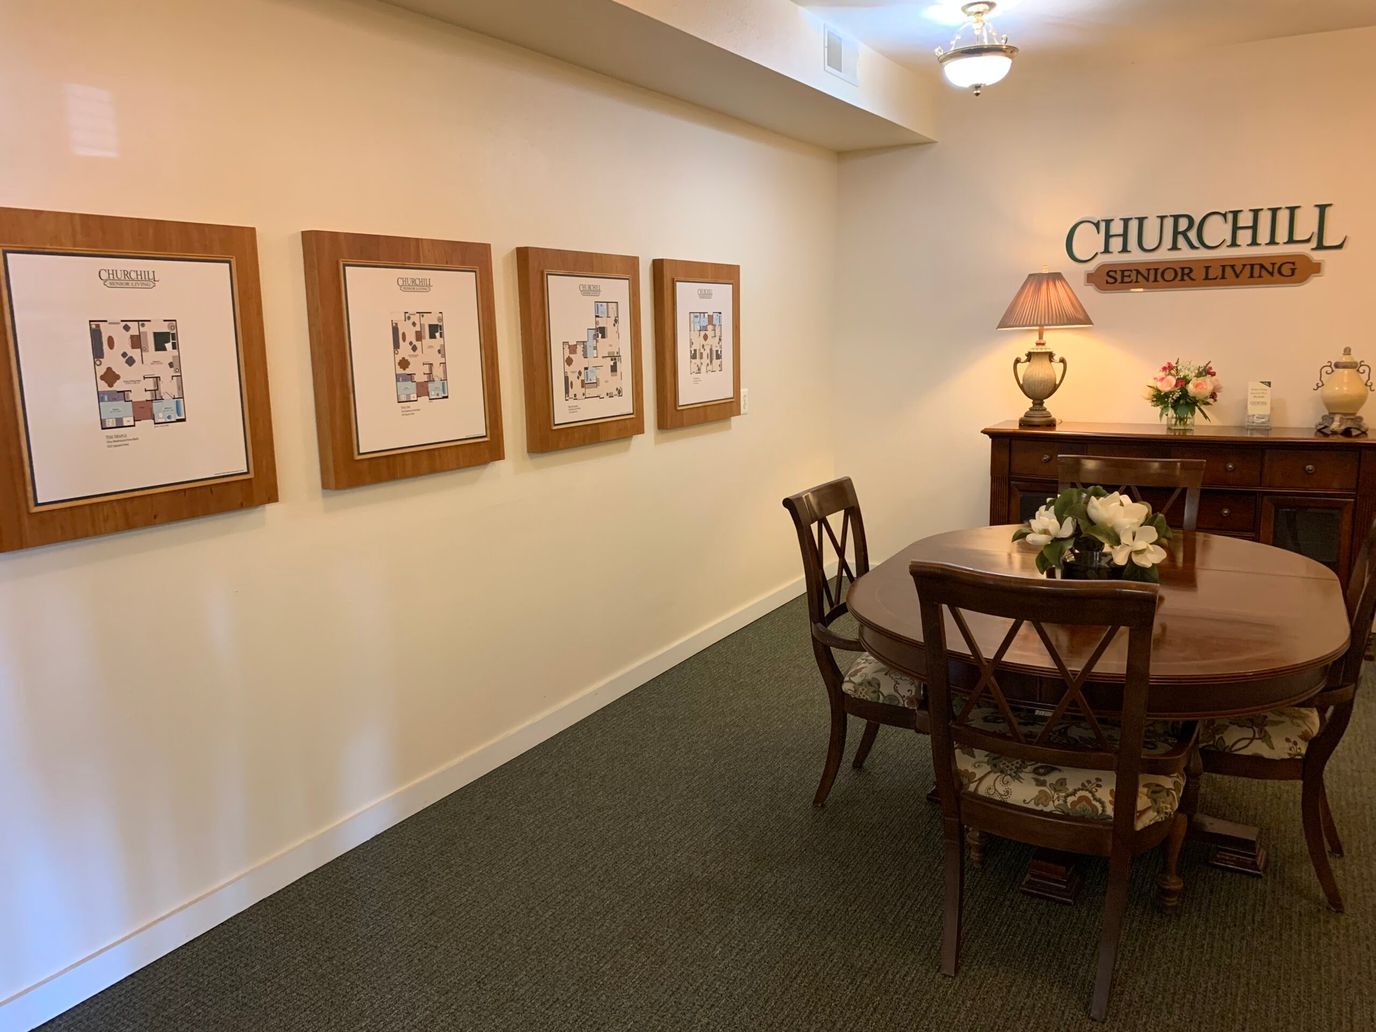
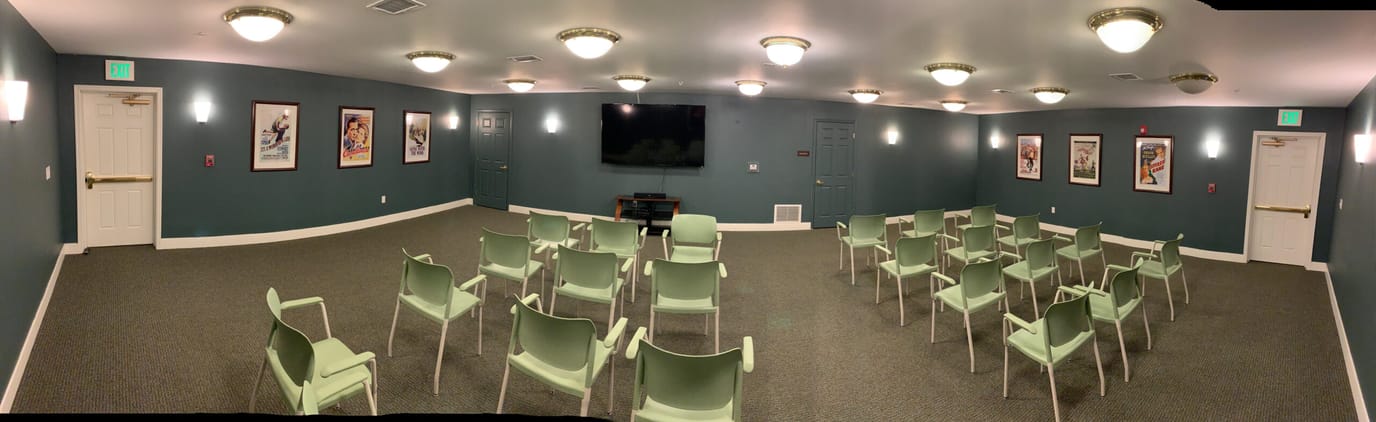
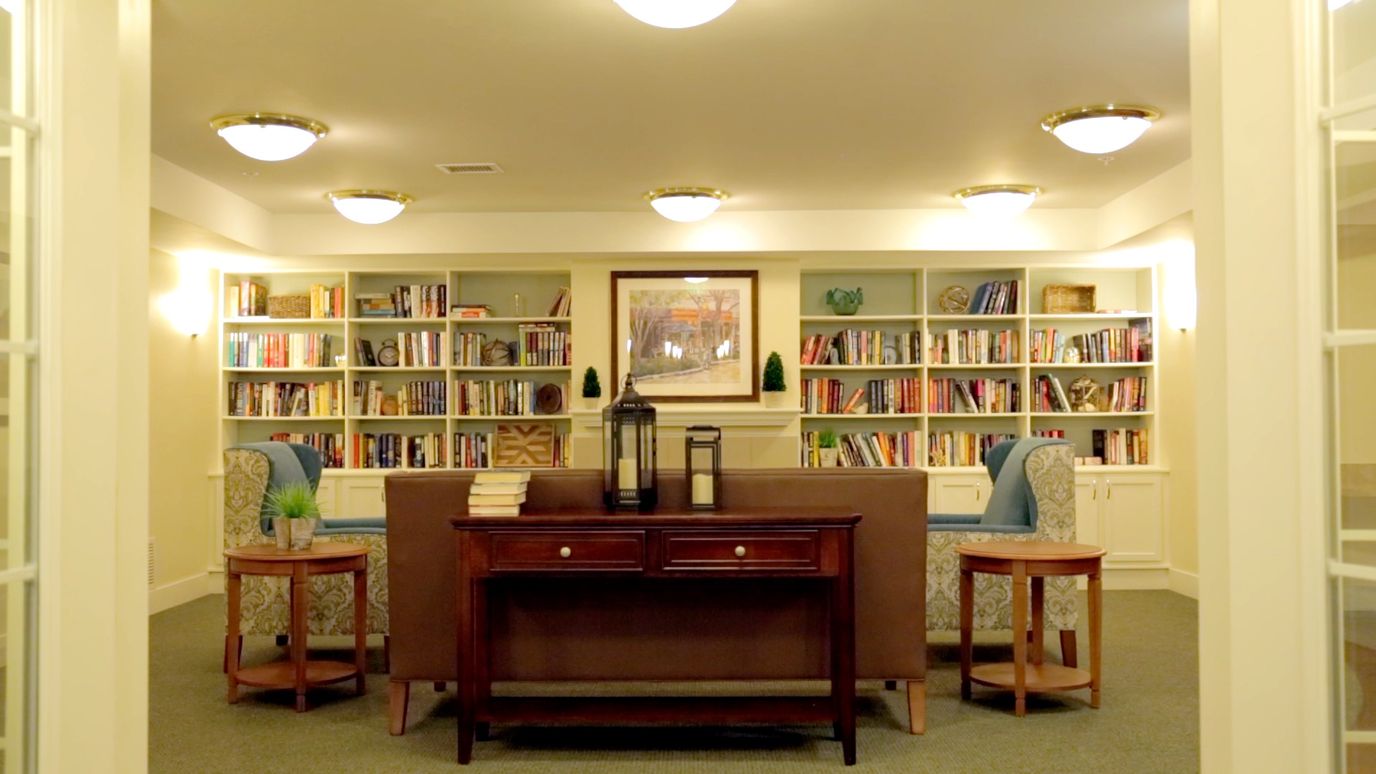
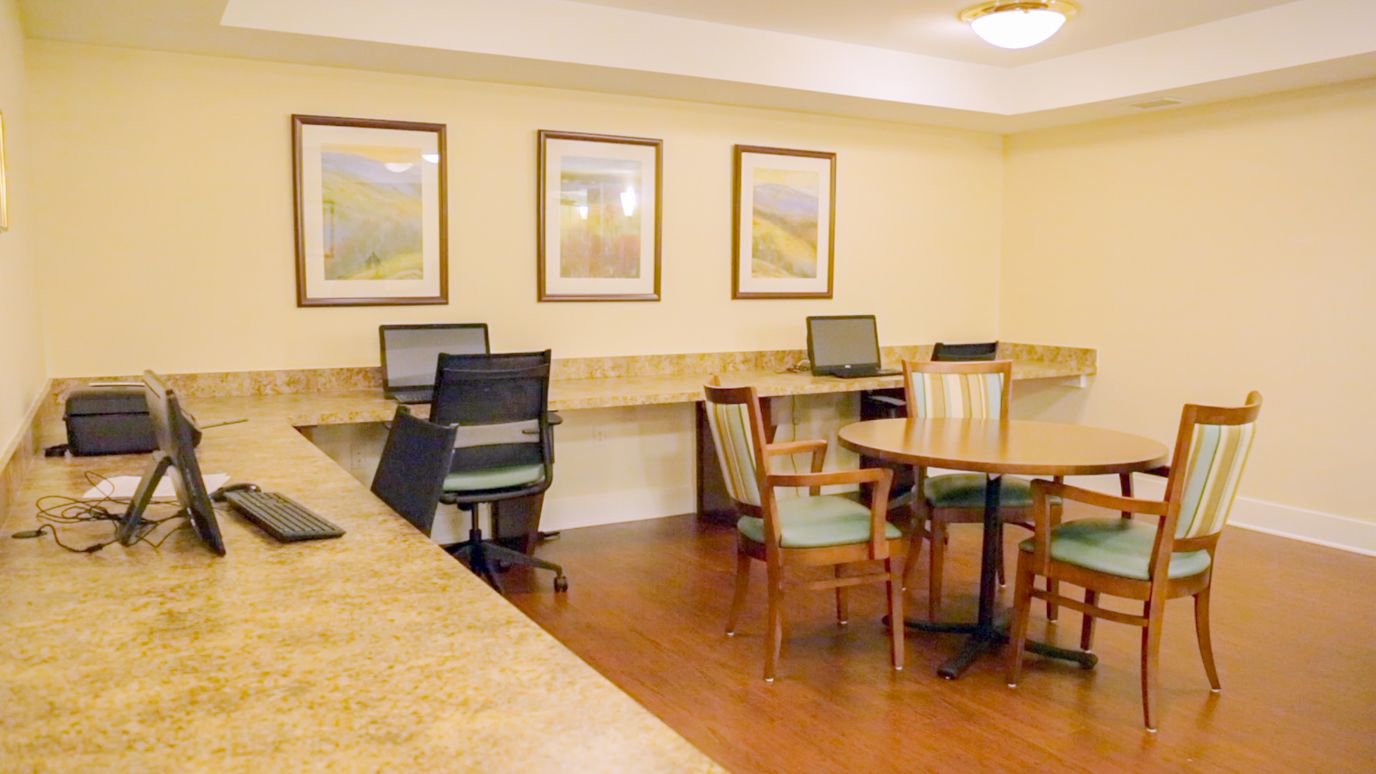
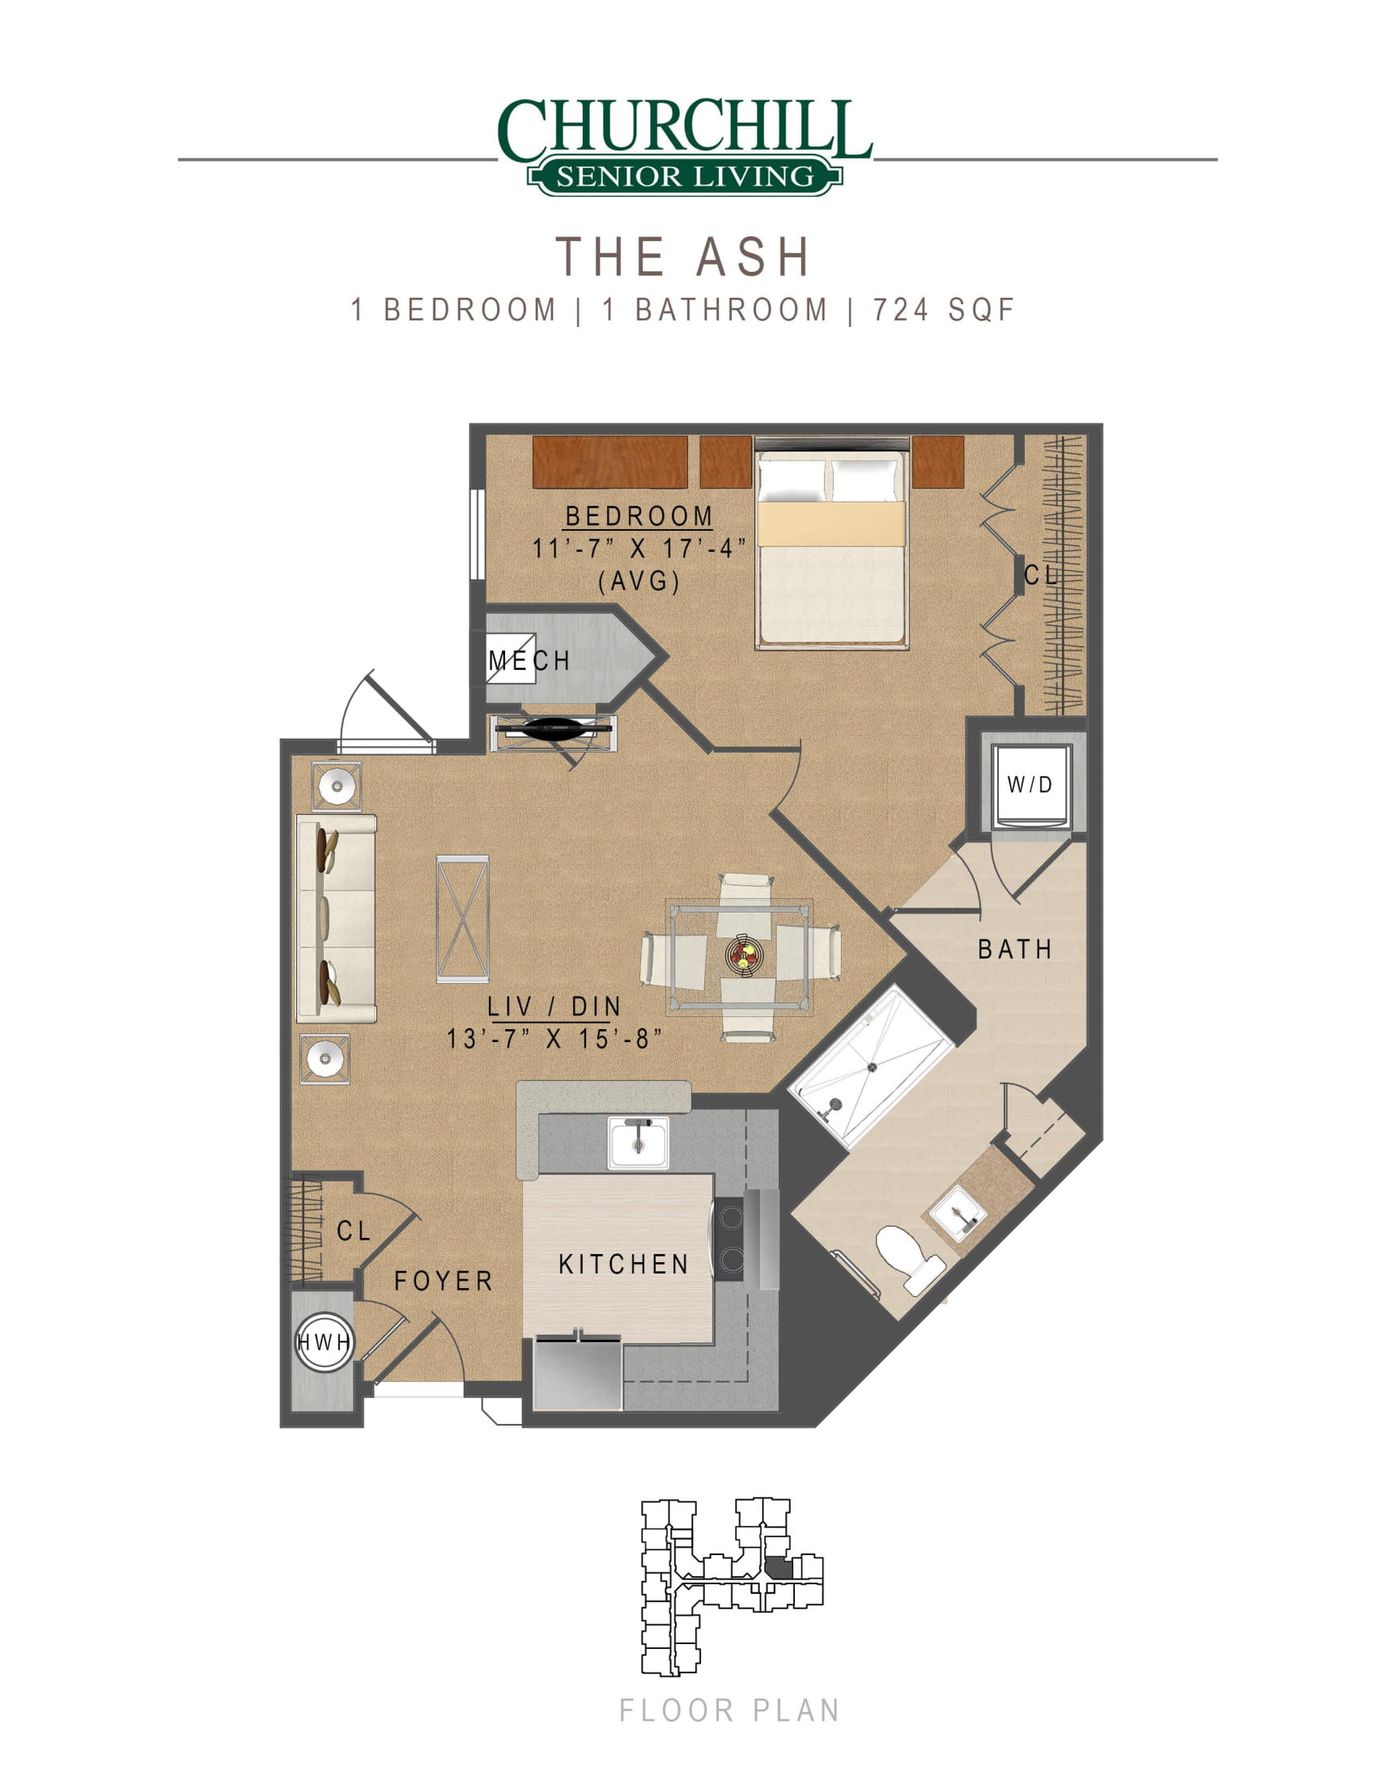
Experience a vibrant lifestyle at Churchill Senior Living, a distinct community in Germantown, MD, offering independent living. Older adults can rest assured of finding the accommodation that best matches their preferences with a variety of purposely designed one- and two-bedroom floor plans. 24-hour maintenance and convenient apartment features are provided, so residents have more time to do the things they love.
A thoughtfully curated calendar of engaging activities and stimulating programs is conducted to keep residents active and socially connected. With a fully furnished kitchen, residents can prepare meals according to their dietary needs and preferences. Pets are welcome to accompany residents to ease their loneliness. Amenities include a library, a club room, a sunroom, a game room, a wellness center, a beauty salon, a theater room, and a lounge, creating the ideal setting for residents to relax and make the most of their golden years.
Peacefully nestled in the serene green spaces of Germantown, MD, Willow Manor at Cloppers Mill is a blissful retreat that offers independent living. The community is committed to improving the quality of life of those 62+, providing specially designed and sophisticated one- and two-bedroom floor plans. Here, residents have easy access to their needs with delightful local amenities nearby.
Residents can spend their days as they please with cozy gathering spaces and fun activities that aim to keep them active and socially connected. With a fully equipped kitchen, residents can prepare meals that best suit their tastes and dietary needs. Pets are also welcome to stay, as long as they follow community policy. Safety features and various amenities, including a fitness center, a cinema room, a billiards room, an activities room, a library, and a health suite, make the community an enticing option for those looking to live independently in retirement.
Live a blissful retirement at Homecrest House-Stein & Moskowitz, a distinct community in Silver Spring, MD, offering independent living. With cozy and well-thought-out accommodations, the nhunity ensures residents are comfortable and safe. A hassle-free living is also guaranteed, with plenty of convenient apartment features and maintenance services.
A jam-packed calendar of exciting events and fun recreational programs is conducted, encouraging residents to live actively and maintain social connections. Residents also enjoy delightful and healthy meals with various dining options available to meet their dietary needs and preferences. The community is equipped with a beauty salon, a computer lab, a library, a fitness center, an arts room, scenic gardens, and serene walking paths, creating the ideal setting for residents to thrive in their golden years.
Ranking Methodology
How we rank these independent living communities
Every community above is evaluated across six weighted categories using public data including state inspection records, review platforms, BBB profiles, and operator-published materials.
Weighting overview
- 35%Resident Experience
- 25%Regulatory
- 15%Visual Media
- 10%Website
- 10%Stability
- 5%Environment
01
Resident & Family Experience 35%
The single largest share of every ranking. Aggregated review sentiment and volume from major platforms — the closest signal to real resident experience.
- Includes
- Review Sentiment
- Review Volume
02
Regulatory & Safety Record 25%
State inspection records, citations, and complaint visits. We weight per-inspection rates more heavily than raw counts.
- Includes
- State Inspections
- Citations/Inspection
- % Inspections w/ Citations
- Complaint Visits
- Accreditations
- BBB Rating
03
Visual Media & Transparency 15%
Communities that publish high-quality visuals give families a real preview. No photos or tours = a negative transparency signal.
- Includes
- Video Tours
- Virtual Walkthroughs
- Photo Quantity
- Photo Quality
04
Website & Operator Transparency 10%
Site quality and whether the operator publishes basic accountability information — staff names, contact details, ownership.
- Includes
- Website Content
- Mobile Usability
- Staff Info Available
- Owner Info Available
05
Community Stability 10%
Operational signals indicating whether a community is well-run and meeting demand.
- Includes
- Occupancy Rate
- Bed Options
06
Environment & Pricing 5%
Walkability and pricing transparency. Walk Score is weighted higher for Independent Living than for Memory Care, where most residents do not leave unaccompanied.
- Includes
- Walk Score
- Pricing Transparency
Who we are
Your Senior Care Partner, Every Step of the Way
We help families find affordable senior communities and unlock same day discounts, Medicaid, and Medicare options tailored to your needs.
Contact us Today
Frequently Asked Questions about Independent Living in Maryland
What is independent living?
Independent living communities are residential settings for active older adults — typically with private apartments or cottages, shared amenities (dining, fitness, activities), and no built-in medical care.
How many independent living communities are listed on this page?
This page features 164 independent living communities in Maryland. Use the filters and comparison tools above to compare ratings, amenities, and pricing.
How do I choose the right independent living community in Maryland?
Start by matching the level of care offered to the resident's current and anticipated needs, then compare licensing status, staff-to-resident ratios, recent inspection results, and pricing. Tour at least two or three communities in Maryland, talk to current residents and families, and confirm what is included in the base rate versus billed as add-on services.
What should I look for when visiting independent living communities in Maryland?
Pay attention to staff interactions with residents, cleanliness and odor, food quality at meal times, the activity calendar, and how questions about pricing and care plans are answered. Ask to see the most recent state inspection report, the move-out / level-of-care-change policy, and a sample monthly bill that lists every fee.
Updated on
