


Where in Maryland are you looking?
Browse communities by city.
Compare Independent Living around Maryland
| Edenwald Senior Living | IL AL MC NH SNF | Towson (Southerly Road) | 94
Facility
94
MD AVG
43
Rank
#144 / 690 | No |
83
Facility
83
MD AVG
43
Rank
#70 / 985 | 1 Bed / 2 Bed | - | A+ |
18% Male Residents — State Benchmarked 18% of residents are male, compared to the Maryland average of 31%. This facility caters to a majority female resident pool (82% female), consistent with the broader assisted living trend where women significantly outnumber men. |
82% Female Residents — State Benchmarked 82% of residents are female, compared to the Maryland average of 69%. Women comprise the large majority, consistent with national assisted living demographics where women live longer and enter care facilities at higher rates. |
100% White Residents — State Benchmarked 100% of residents are reported as White, compared to the Maryland average of 81%. A higher White share than is typical for assisted living in Maryland in this dataset — compare with peer facilities for local context. |
0% African American Residents — State Benchmarked 0% of residents are reported as African American or Black, compared to the Maryland average of 13%. A lower African American share than is typical in Maryland; local markets still vary widely. |
0% Other Ethnicity Residents — State Benchmarked 0% of residents fall into categories other than White or African American (combined), compared to the Maryland average of 6%. This column aggregates Hispanic, Asian, multiracial, and any other labeled groups that are not classified as White or African American. | - |
13% Residents Age 75–84 — State Benchmarked 13% of residents are 75–84, compared to the Maryland average of 31%. Below the state norm — the resident mix may skew either younger or older than this typical middle bracket. |
53% Residents Age 85–94 — State Benchmarked 53% of residents are 85–94, compared to the Maryland average of 44%. A high concentration of very elderly residents signals a higher-acuity facility with experience caring for advanced age-related needs. |
35% Residents Age 95+ — State Benchmarked 35% of residents are 95 or older, compared to the Maryland average of 16%. A high proportion of the oldest-old suggests strong end-of-life care experience and very-high-acuity capabilities. |
| Homewood Living Frederick | IL AL MC NH SNF | Frederick | 120
Facility
120
MD AVG
43
Rank
#76 / 690 | Yes |
14
Facility
14
MD AVG
43
Rank
#788 / 985 | 1 Bed / 2 Bed | - | - | - | - | - | - | - | - | - | - | - |
| Ingleside at King Farm | IL AL MC NH SNF | Rockville (King Farm) | 45
Facility
45
MD AVG
43
Rank
#226 / 690 | Yes |
73
Facility
73
MD AVG
43
Rank
#152 / 985 | 1 Bed / 2 Bed | - | - | - | - | - | - | - | - | - | - | - |
| Bedford Court, a CCRC | IL AL HOS MC NH RC SNF | Silver Spring (International Drive) | 76
Facility
76
MD AVG
43
Rank
#179 / 690 | Yes |
64
Facility
64
MD AVG
43
Rank
#261 / 985 | Studio / 1 Bed | 34
Facility
34
MD AVG
21
Rank
#22 / 210 | - |
15% Male Residents — State Benchmarked 15% of residents are male, compared to the Maryland average of 31%. This facility caters to a majority female resident pool (85% female), consistent with the broader assisted living trend where women significantly outnumber men. |
85% Female Residents — State Benchmarked 85% of residents are female, compared to the Maryland average of 69%. Women comprise the large majority, consistent with national assisted living demographics where women live longer and enter care facilities at higher rates. |
95% White Residents — State Benchmarked 95% of residents are reported as White, compared to the Maryland average of 81%. A higher White share than is typical for assisted living in Maryland in this dataset — compare with peer facilities for local context. |
3% African American Residents — State Benchmarked 3% of residents are reported as African American or Black, compared to the Maryland average of 13%. A lower African American share than is typical in Maryland; local markets still vary widely. |
2% Other Ethnicity Residents — State Benchmarked 2% of residents fall into categories other than White or African American (combined), compared to the Maryland average of 6%. This column aggregates Hispanic, Asian, multiracial, and any other labeled groups that are not classified as White or African American. Reported subgroups in this total: Asian (2%). |
2% Residents Age 65–74 — State Benchmarked 2% of residents are 65–74, compared to the Maryland average of 13%. Fewer younger seniors suggests the resident population skews older, likely requiring higher acuity care and more hands-on support. |
8% Residents Age 75–84 — State Benchmarked 8% of residents are 75–84, compared to the Maryland average of 31%. Below the state norm — the resident mix may skew either younger or older than this typical middle bracket. |
65% Residents Age 85–94 — State Benchmarked 65% of residents are 85–94, compared to the Maryland average of 44%. A high concentration of very elderly residents signals a higher-acuity facility with experience caring for advanced age-related needs. |
26% Residents Age 95+ — State Benchmarked 26% of residents are 95 or older, compared to the Maryland average of 16%. A high proportion of the oldest-old suggests strong end-of-life care experience and very-high-acuity capabilities. |
| Lutheran Village at Miller’s Grant | IL AL NH SNF | Ellicott City (Lutheran Village At Miller’s Grant) | 36
Facility
36
MD AVG
43
Rank
#237 / 690 | Yes |
19
Facility
19
MD AVG
43
Rank
#746 / 985 | 1 Bed / 2 Bed | 21
Facility
21
MD AVG
21
Rank
#108 / 210 | - |
17% Male Residents — State Benchmarked 17% of residents are male, compared to the Maryland average of 31%. This facility caters to a majority female resident pool (83% female), consistent with the broader assisted living trend where women significantly outnumber men. |
83% Female Residents — State Benchmarked 83% of residents are female, compared to the Maryland average of 69%. Women comprise the large majority, consistent with national assisted living demographics where women live longer and enter care facilities at higher rates. |
83% White Residents — State Benchmarked 83% of residents are reported as White, compared to the Maryland average of 81%. Close to the average for this category among assisted living facilities in Maryland with reported race/ethnicity data. |
11% African American Residents — State Benchmarked 11% of residents are reported as African American or Black, compared to the Maryland average of 13%. In line with the Maryland average for African American residents among facilities reporting this breakdown. |
6% Other Ethnicity Residents — State Benchmarked 6% of residents fall into categories other than White or African American (combined), compared to the Maryland average of 6%. This column aggregates Hispanic, Asian, multiracial, and any other labeled groups that are not classified as White or African American. Reported subgroups in this total: Asian (6%). | - |
33% Residents Age 75–84 — State Benchmarked 33% of residents are 75–84, compared to the Maryland average of 31%. This is the second most common age bracket in assisted living, representing residents with moderate care needs. |
44% Residents Age 85–94 — State Benchmarked 44% of residents are 85–94, compared to the Maryland average of 44%. This is typically the most common age bracket in assisted living — this facility is in line with the statewide norm. |
22% Residents Age 95+ — State Benchmarked 22% of residents are 95 or older, compared to the Maryland average of 16%. A high proportion of the oldest-old suggests strong end-of-life care experience and very-high-acuity capabilities. |
| Residences at Vantage Point | IL AL HC MC NH SNF | Columbia (Town Center) | 44
Facility
44
MD AVG
43
Rank
#229 / 690 | Yes |
52
Facility
52
MD AVG
43
Rank
#402 / 985 | Studio / 1 Bed / 2 Bed | 36
Facility
36
MD AVG
21
Rank
#16 / 210 | - | - | - | - | - | - | - | - | - | - |
| Maplewood Park Place | IL AL MC NH SNF | Bethesda (Pooks Hill) | 29
Facility
29
MD AVG
43
Rank
#247 / 690 | Yes |
38
Facility
38
MD AVG
43
Rank
#542 / 985 | 1 Bed / 2 Bed | 30
Facility
30
MD AVG
21
Rank
#44 / 210 | - |
18% Male Residents — State Benchmarked 18% of residents are male, compared to the Maryland average of 31%. This facility caters to a majority female resident pool (82% female), consistent with the broader assisted living trend where women significantly outnumber men. |
82% Female Residents — State Benchmarked 82% of residents are female, compared to the Maryland average of 69%. Women comprise the large majority, consistent with national assisted living demographics where women live longer and enter care facilities at higher rates. |
100% White Residents — State Benchmarked 100% of residents are reported as White, compared to the Maryland average of 81%. A higher White share than is typical for assisted living in Maryland in this dataset — compare with peer facilities for local context. |
0% African American Residents — State Benchmarked 0% of residents are reported as African American or Black, compared to the Maryland average of 13%. A lower African American share than is typical in Maryland; local markets still vary widely. |
0% Other Ethnicity Residents — State Benchmarked 0% of residents fall into categories other than White or African American (combined), compared to the Maryland average of 6%. This column aggregates Hispanic, Asian, multiracial, and any other labeled groups that are not classified as White or African American. | - |
6% Residents Age 75–84 — State Benchmarked 6% of residents are 75–84, compared to the Maryland average of 31%. Below the state norm — the resident mix may skew either younger or older than this typical middle bracket. |
24% Residents Age 85–94 — State Benchmarked 24% of residents are 85–94, compared to the Maryland average of 44%. The population here skews younger than the statewide norm, which may indicate a more active, lower-acuity community. |
71% Residents Age 95+ — State Benchmarked 71% of residents are 95 or older, compared to the Maryland average of 16%. A high proportion of the oldest-old suggests strong end-of-life care experience and very-high-acuity capabilities. |
| Friends House Retirement Community | IL AL NH SNF | Sandy Spring | 24
Facility
24
MD AVG
43
Rank
#249 / 690 | No |
6
Facility
6
MD AVG
43
Rank
#891 / 985 | - | 20
Facility
20
MD AVG
21
Rank
#112 / 210 | - |
6% Male Residents — State Benchmarked 6% of residents are male, compared to the Maryland average of 31%. This facility caters to a majority female resident pool (94% female), consistent with the broader assisted living trend where women significantly outnumber men. |
94% Female Residents — State Benchmarked 94% of residents are female, compared to the Maryland average of 69%. Women comprise the large majority, consistent with national assisted living demographics where women live longer and enter care facilities at higher rates. |
94% White Residents — State Benchmarked 94% of residents are reported as White, compared to the Maryland average of 81%. A higher White share than is typical for assisted living in Maryland in this dataset — compare with peer facilities for local context. |
0% African American Residents — State Benchmarked 0% of residents are reported as African American or Black, compared to the Maryland average of 13%. A lower African American share than is typical in Maryland; local markets still vary widely. |
6% Other Ethnicity Residents — State Benchmarked 6% of residents fall into categories other than White or African American (combined), compared to the Maryland average of 6%. This column aggregates Hispanic, Asian, multiracial, and any other labeled groups that are not classified as White or African American. Reported subgroups in this total: Asian (6%). |
6% Residents Age 65–74 — State Benchmarked 6% of residents are 65–74, compared to the Maryland average of 13%. Fewer younger seniors suggests the resident population skews older, likely requiring higher acuity care and more hands-on support. |
18% Residents Age 75–84 — State Benchmarked 18% of residents are 75–84, compared to the Maryland average of 31%. Below the state norm — the resident mix may skew either younger or older than this typical middle bracket. |
53% Residents Age 85–94 — State Benchmarked 53% of residents are 85–94, compared to the Maryland average of 44%. A high concentration of very elderly residents signals a higher-acuity facility with experience caring for advanced age-related needs. |
24% Residents Age 95+ — State Benchmarked 24% of residents are 95 or older, compared to the Maryland average of 16%. A high proportion of the oldest-old suggests strong end-of-life care experience and very-high-acuity capabilities. |
| Revitz House | IL AL HC MC NH SNF | Rockville | 558
Facility
558
MD AVG
43
Rank
#1 / 690 | Yes |
81
Facility
81
MD AVG
43
Rank
#86 / 985 | 1 Bed | - | - | - | - | - | - | - | - | - | - | - |
| Broadmead | IL AL MC NH RC SNF | Cockeysville | 40
Facility
40
MD AVG
43
Rank
#233 / 690 | No |
0
Facility
0
MD AVG
43
Rank
#959 / 985 | - | 47
Facility
47
MD AVG
21
Rank
#3 / 210 | A+ | - | - | - | - | - | - | - | - | - |
| Blakehurst (Chestnut Green) | IL AL MC NH SNF | Towson | 35
Facility
35
MD AVG
43
Rank
#239 / 690 | No |
10
Facility
10
MD AVG
43
Rank
#837 / 985 | - | 33
Facility
33
MD AVG
21
Rank
#25 / 210 | - | - | - | - | - | - | - | - | - | - |
| Asbury Methodist Village | IL AL MC NH SNF | Gaithersburg (Russell Avenue) | 164
Facility
164
MD AVG
43
Rank
#26 / 690 | Yes |
41
Facility
41
MD AVG
43
Rank
#508 / 985 | - | 27
Facility
27
MD AVG
21
Rank
#62 / 210 | - |
21% Male Residents — State Benchmarked 21% of residents are male, compared to the Maryland average of 31%. This facility caters to a majority female resident pool (79% female), consistent with the broader assisted living trend where women significantly outnumber men. |
79% Female Residents — State Benchmarked 79% of residents are female, compared to the Maryland average of 69%. Women comprise the large majority, consistent with national assisted living demographics where women live longer and enter care facilities at higher rates. |
92% White Residents — State Benchmarked 92% of residents are reported as White, compared to the Maryland average of 81%. A higher White share than is typical for assisted living in Maryland in this dataset — compare with peer facilities for local context. |
1% African American Residents — State Benchmarked 1% of residents are reported as African American or Black, compared to the Maryland average of 13%. A lower African American share than is typical in Maryland; local markets still vary widely. |
7% Other Ethnicity Residents — State Benchmarked 7% of residents fall into categories other than White or African American (combined), compared to the Maryland average of 6%. This column aggregates Hispanic, Asian, multiracial, and any other labeled groups that are not classified as White or African American. Reported subgroups in this total: Asian (7%). |
1% Residents Age 65–74 — State Benchmarked 1% of residents are 65–74, compared to the Maryland average of 13%. Fewer younger seniors suggests the resident population skews older, likely requiring higher acuity care and more hands-on support. |
21% Residents Age 75–84 — State Benchmarked 21% of residents are 75–84, compared to the Maryland average of 31%. Below the state norm — the resident mix may skew either younger or older than this typical middle bracket. |
48% Residents Age 85–94 — State Benchmarked 48% of residents are 85–94, compared to the Maryland average of 44%. This is typically the most common age bracket in assisted living — this facility is in line with the statewide norm. |
30% Residents Age 95+ — State Benchmarked 30% of residents are 95 or older, compared to the Maryland average of 16%. A high proportion of the oldest-old suggests strong end-of-life care experience and very-high-acuity capabilities. |
| Ginger Cove | IL AL HC MC NH SNF | Annapolis (River Crescent Drive) | 96
Facility
96
MD AVG
43
Rank
#136 / 690 | No |
51
Facility
51
MD AVG
43
Rank
#413 / 985 | 1 Bed / 2 Bed | 42
Facility
42
MD AVG
21
Rank
#8 / 210 | A+ |
40% Male Residents — State Benchmarked 40% of residents are male, compared to the Maryland average of 31%. A relatively balanced gender mix for assisted living, where facilities typically skew heavily female. |
60% Female Residents — State Benchmarked 60% of residents are female, compared to the Maryland average of 69%. Closer to an even gender split than most assisted living facilities, which typically have 65–75% female residents. |
100% White Residents — State Benchmarked 100% of residents are reported as White, compared to the Maryland average of 81%. A higher White share than is typical for assisted living in Maryland in this dataset — compare with peer facilities for local context. |
0% African American Residents — State Benchmarked 0% of residents are reported as African American or Black, compared to the Maryland average of 13%. A lower African American share than is typical in Maryland; local markets still vary widely. |
0% Other Ethnicity Residents — State Benchmarked 0% of residents fall into categories other than White or African American (combined), compared to the Maryland average of 6%. This column aggregates Hispanic, Asian, multiracial, and any other labeled groups that are not classified as White or African American. | - |
13% Residents Age 75–84 — State Benchmarked 13% of residents are 75–84, compared to the Maryland average of 31%. Below the state norm — the resident mix may skew either younger or older than this typical middle bracket. |
64% Residents Age 85–94 — State Benchmarked 64% of residents are 85–94, compared to the Maryland average of 44%. A high concentration of very elderly residents signals a higher-acuity facility with experience caring for advanced age-related needs. |
22% Residents Age 95+ — State Benchmarked 22% of residents are 95 or older, compared to the Maryland average of 16%. A high proportion of the oldest-old suggests strong end-of-life care experience and very-high-acuity capabilities. |
| Charlestown Community | IL NH | Baltimore | 238
Facility
238
MD AVG
43
Rank
#5 / 690 | No |
36
Facility
36
MD AVG
43
Rank
#563 / 985 | - | 35
Facility
35
MD AVG
21
Rank
#18 / 210 | - | - | - | - | - | - | - | - | - | - |
| Pickersgill Retirement Community | IL AL NH SNF | Baltimore (Chestnut Hill) | 138
Facility
138
MD AVG
43
Rank
#56 / 690 | No |
45
Facility
45
MD AVG
43
Rank
#475 / 985 | - | - | A+ |
24% Male Residents — State Benchmarked 24% of residents are male, compared to the Maryland average of 31%. This facility caters to a majority female resident pool (76% female), consistent with the broader assisted living trend where women significantly outnumber men. |
76% Female Residents — State Benchmarked 76% of residents are female, compared to the Maryland average of 69%. Women comprise the large majority, consistent with national assisted living demographics where women live longer and enter care facilities at higher rates. |
95% White Residents — State Benchmarked 95% of residents are reported as White, compared to the Maryland average of 81%. A higher White share than is typical for assisted living in Maryland in this dataset — compare with peer facilities for local context. |
1% African American Residents — State Benchmarked 1% of residents are reported as African American or Black, compared to the Maryland average of 13%. A lower African American share than is typical in Maryland; local markets still vary widely. |
4% Other Ethnicity Residents — State Benchmarked 4% of residents fall into categories other than White or African American (combined), compared to the Maryland average of 6%. This column aggregates Hispanic, Asian, multiracial, and any other labeled groups that are not classified as White or African American. Reported subgroups in this total: Asian (4%). |
3% Residents Age 65–74 — State Benchmarked 3% of residents are 65–74, compared to the Maryland average of 13%. Fewer younger seniors suggests the resident population skews older, likely requiring higher acuity care and more hands-on support. |
27% Residents Age 75–84 — State Benchmarked 27% of residents are 75–84, compared to the Maryland average of 31%. This is the second most common age bracket in assisted living, representing residents with moderate care needs. |
55% Residents Age 85–94 — State Benchmarked 55% of residents are 85–94, compared to the Maryland average of 44%. A high concentration of very elderly residents signals a higher-acuity facility with experience caring for advanced age-related needs. |
15% Residents Age 95+ — State Benchmarked 15% of residents are 95 or older, compared to the Maryland average of 16%. In line with the statewide profile for the oldest resident bracket. |
Rows per page:

View all Nearby Homes
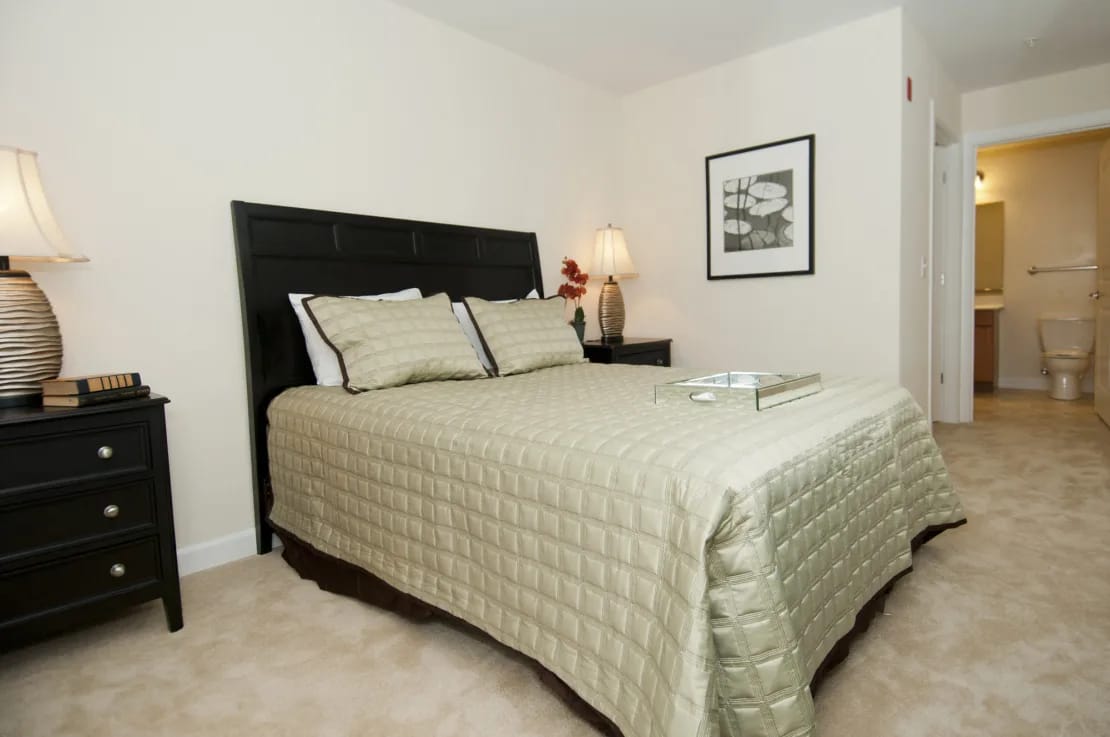
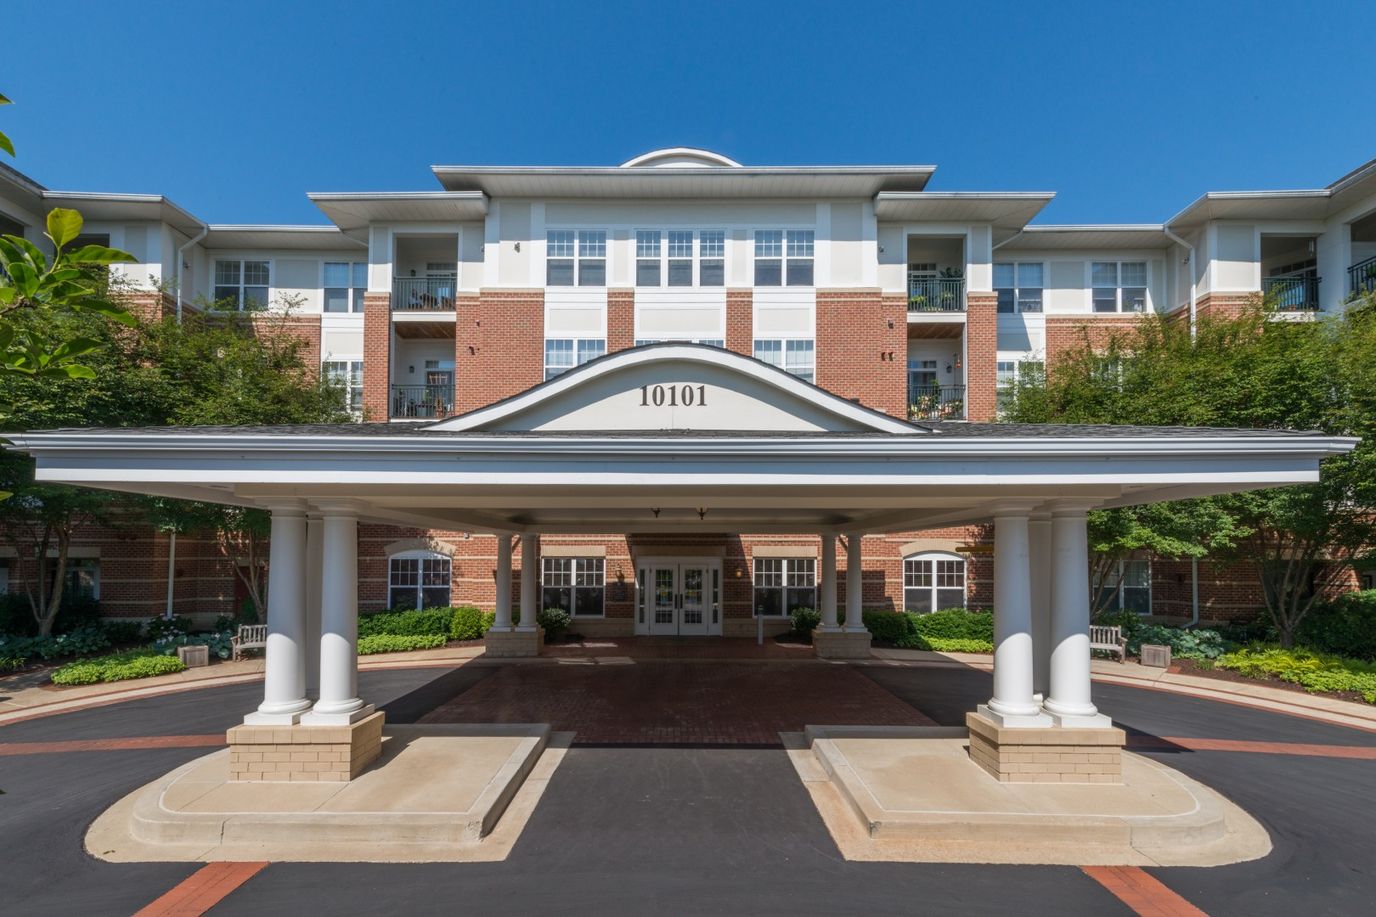
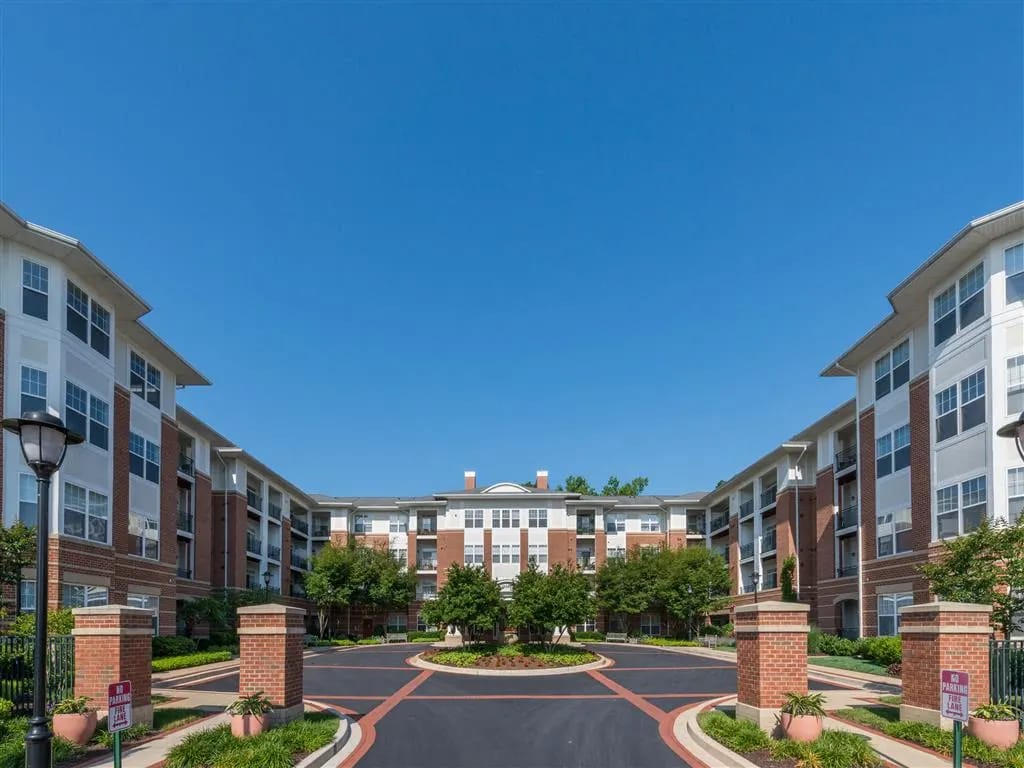
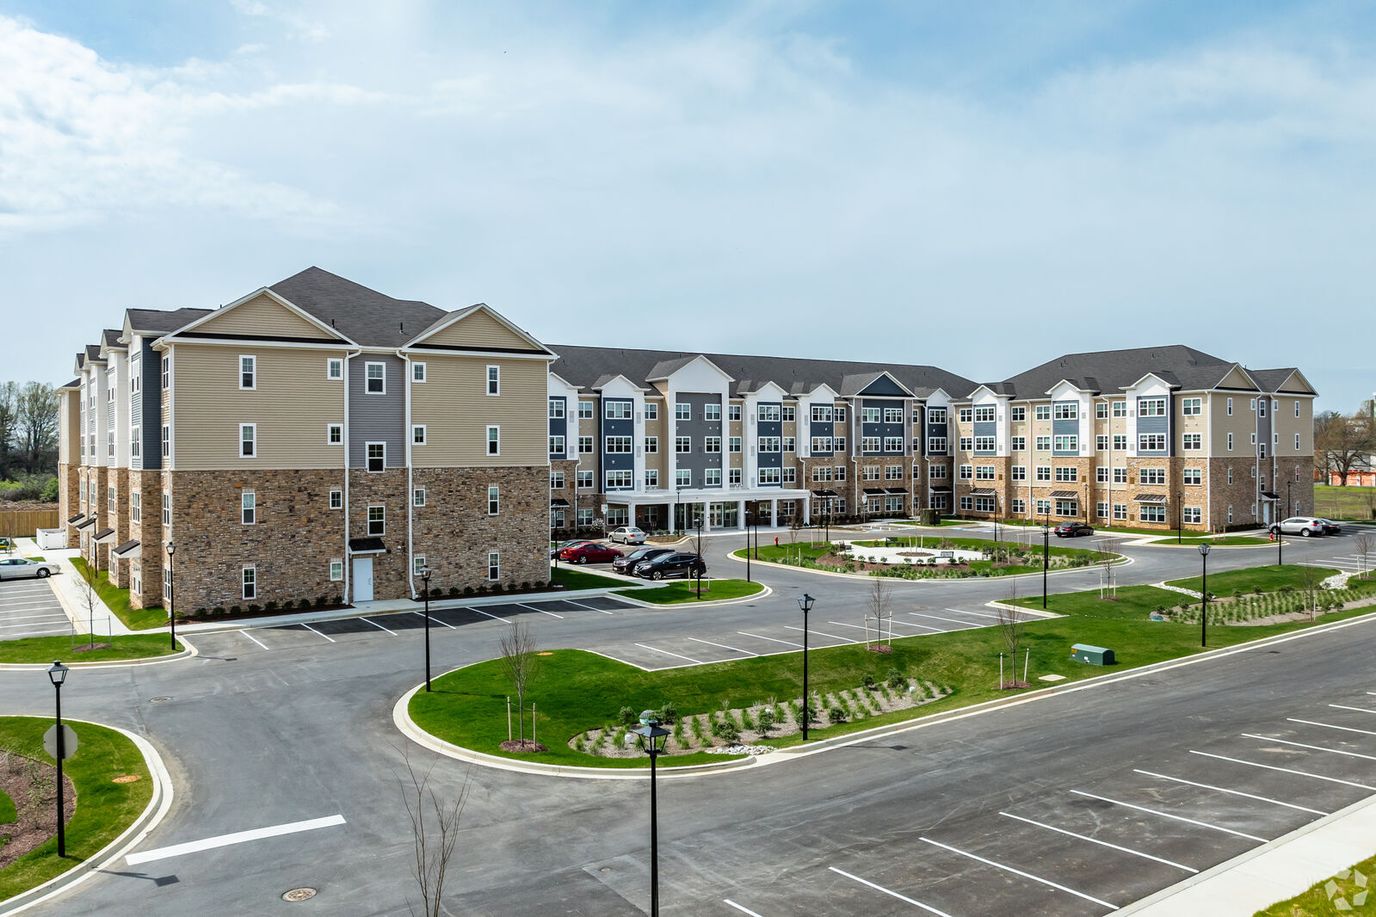
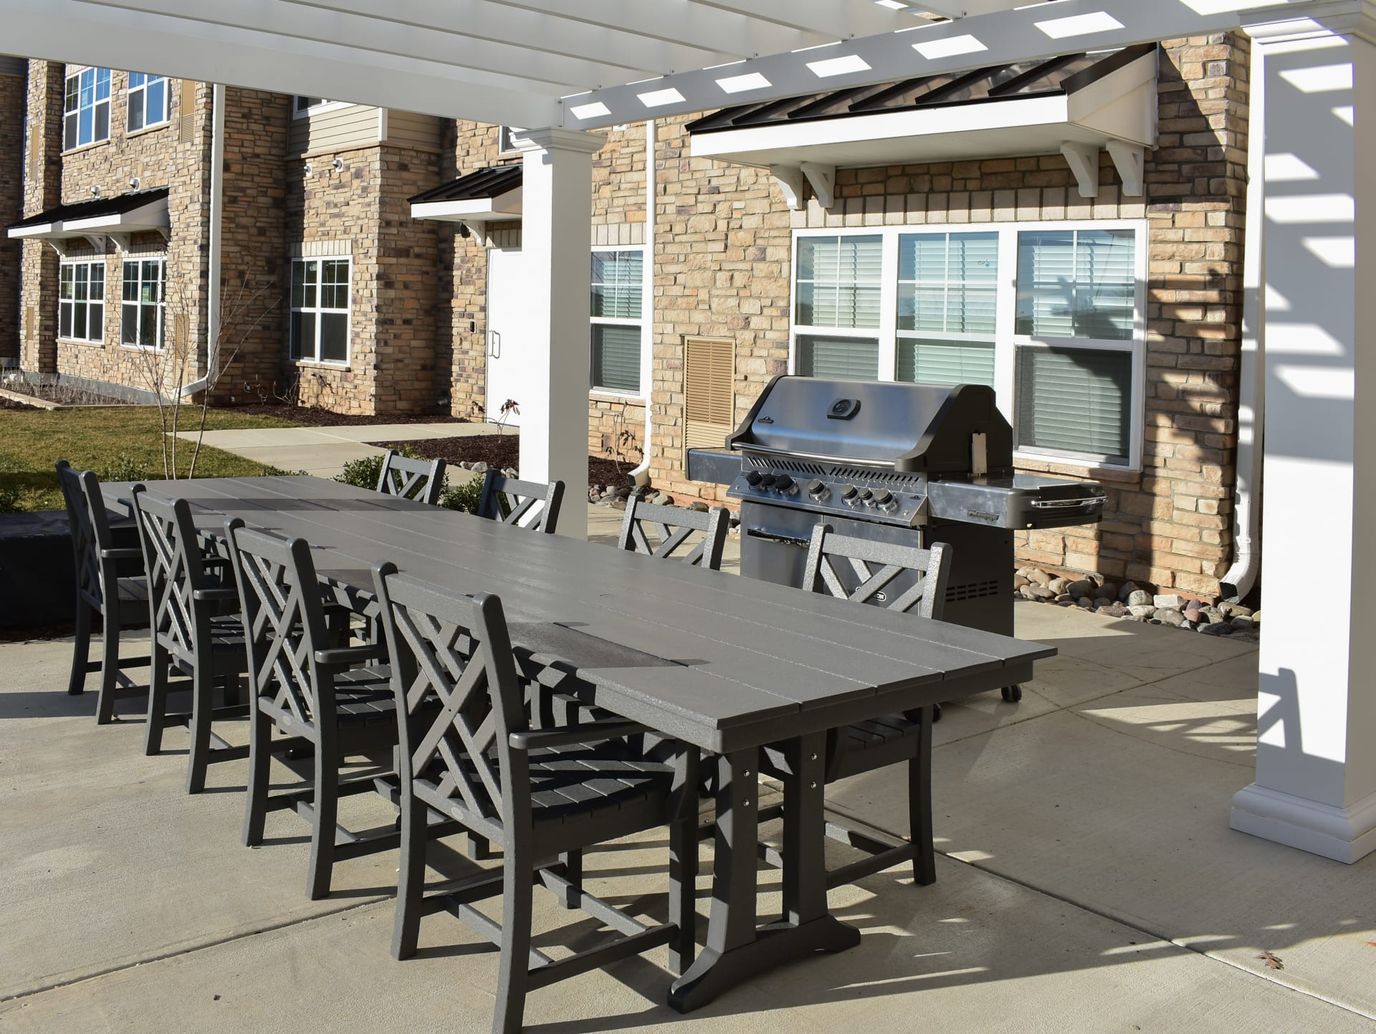
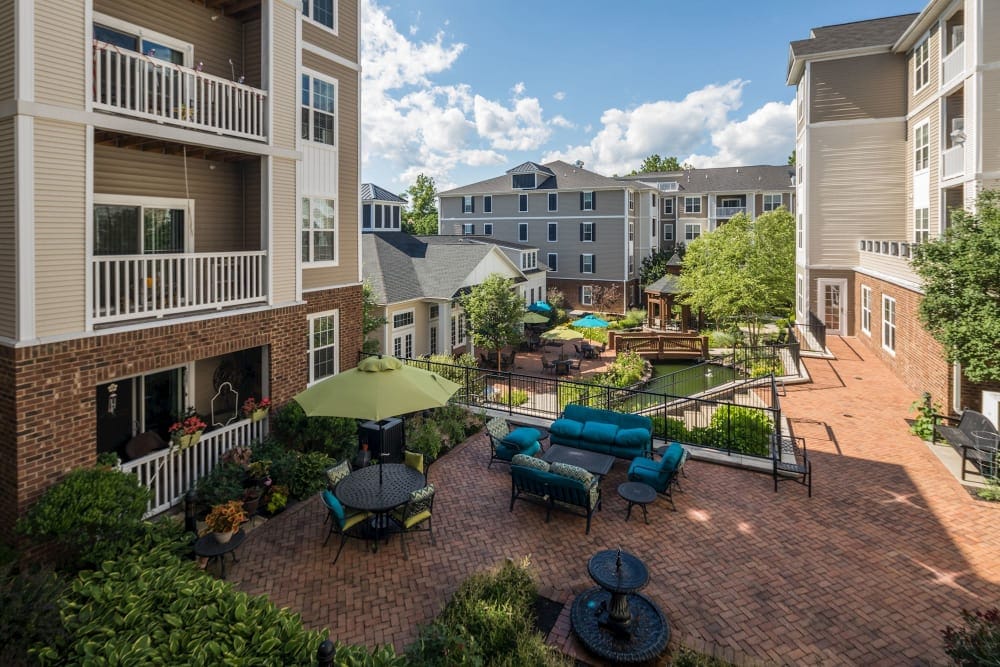
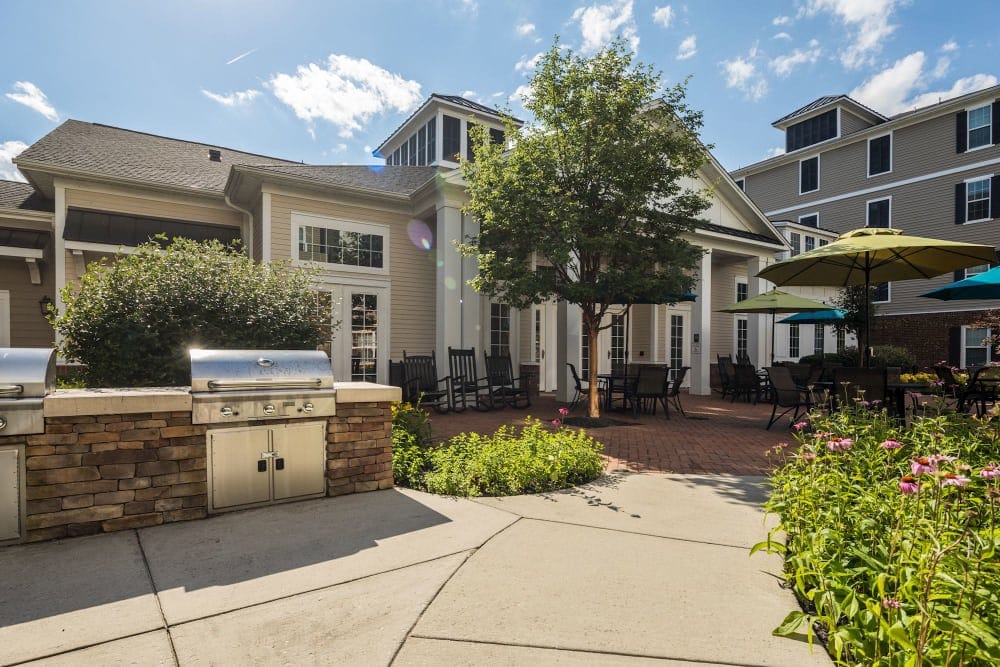
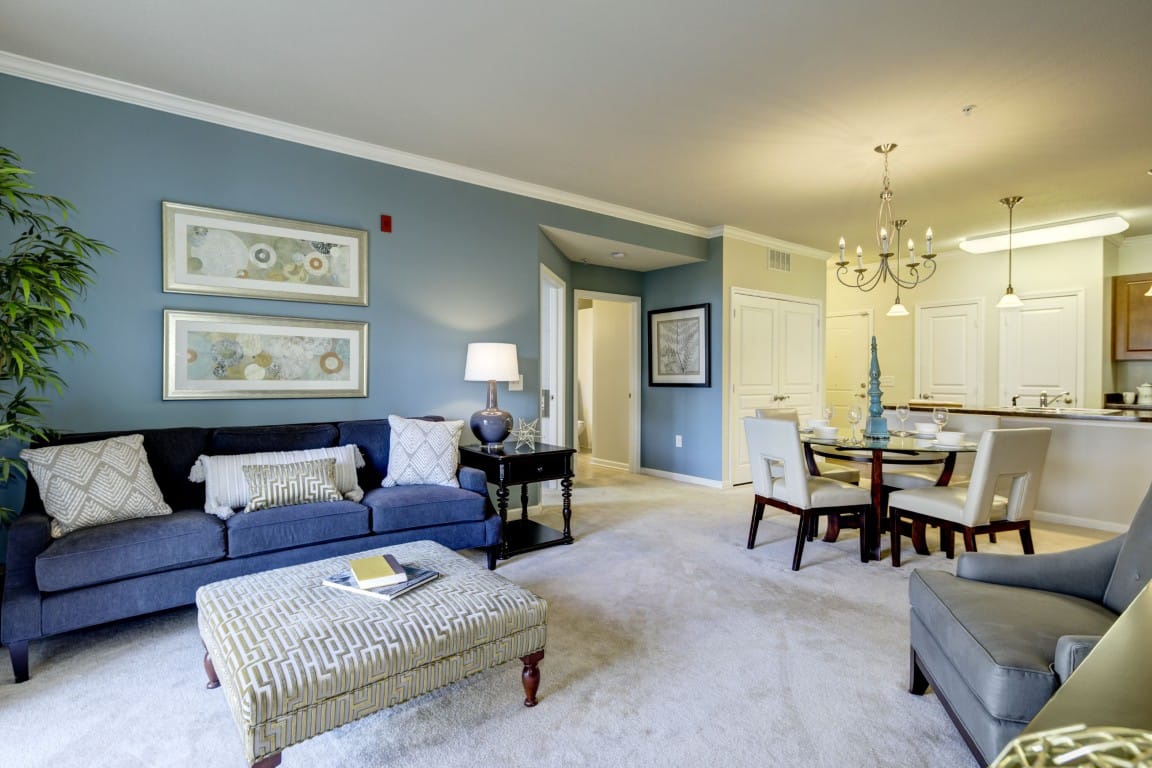
Enjoy your best years at Center Pointe, an astounding community in Waldorf, MD, offering independent living. Featuring beautifully furnished and cozy one- and two-bedroom floor plans, the community ensures residents’ comfort and safety. Residents have a hassle-free lifestyle with round-the-clock emergency service and plenty of convenient apartment features.
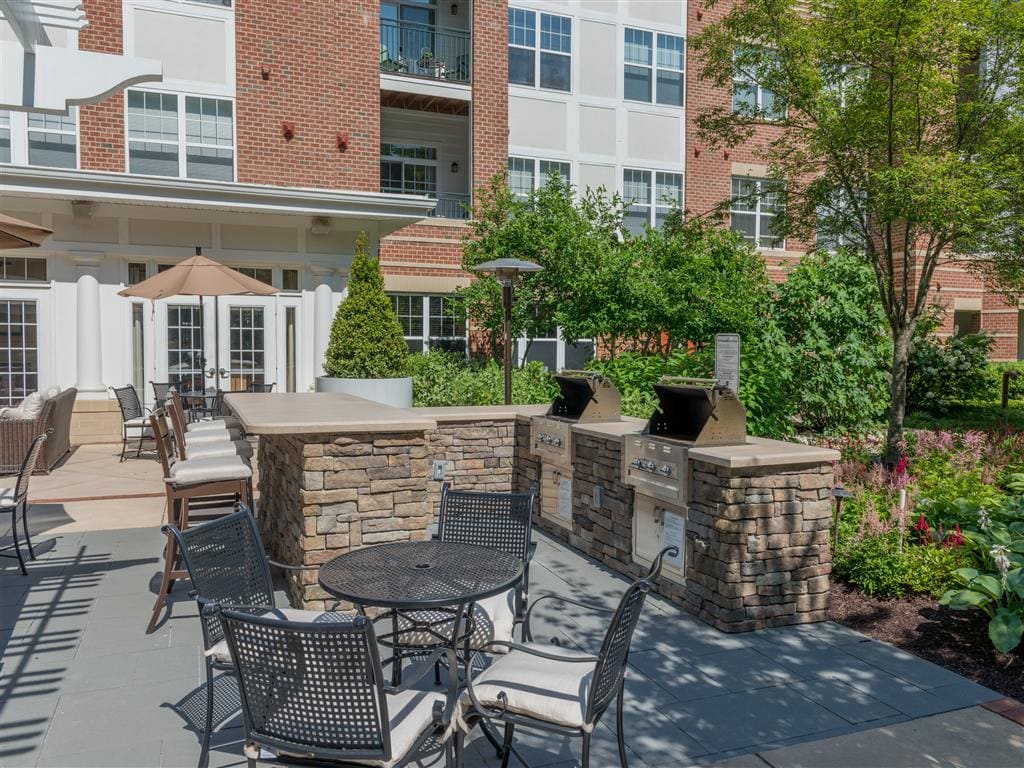
A thoughtfully curated calendar of engaging activities and exciting events is conducted, encouraging residents to live actively and maintain social connections. With a grill and picnic area in the courtyard, residents enjoy mealtimes with friends that satisfy their dietary needs and preferences. Pets are also welcome to accompany residents to ease their loneliness. The community’s warm and friendly environment makes it an enticing retirement option.
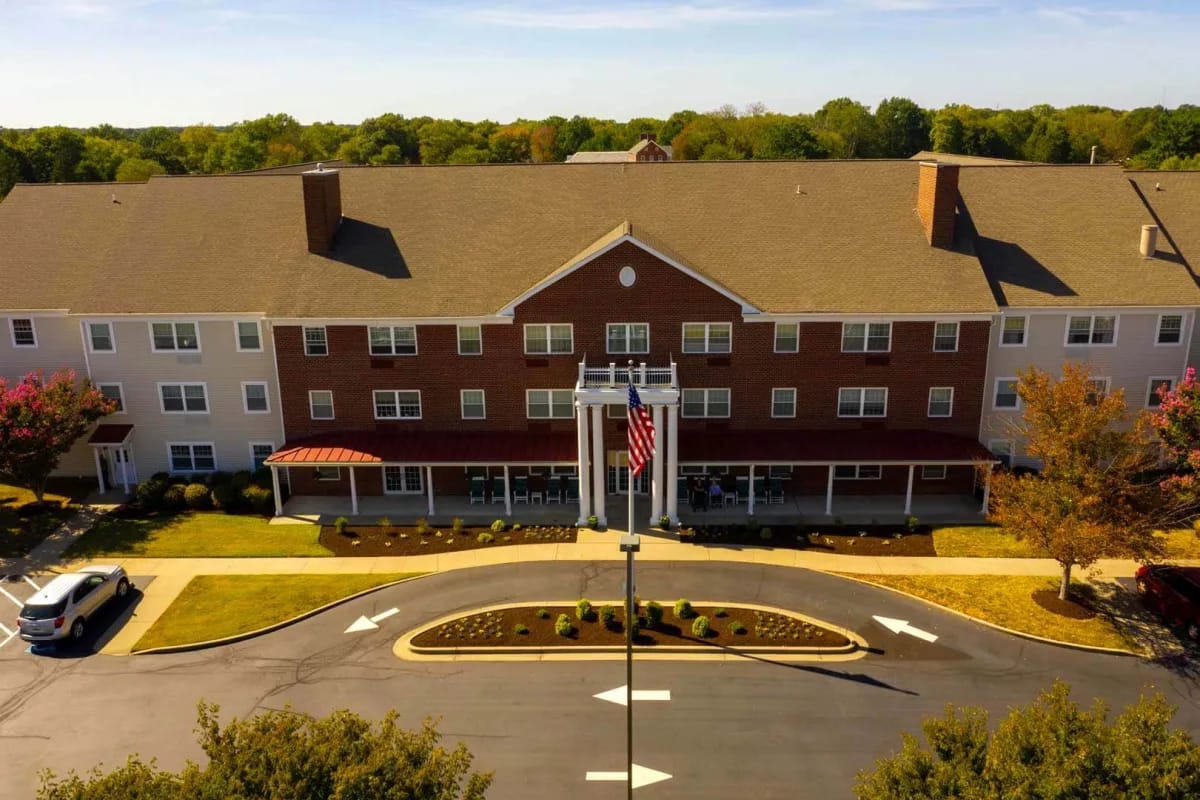
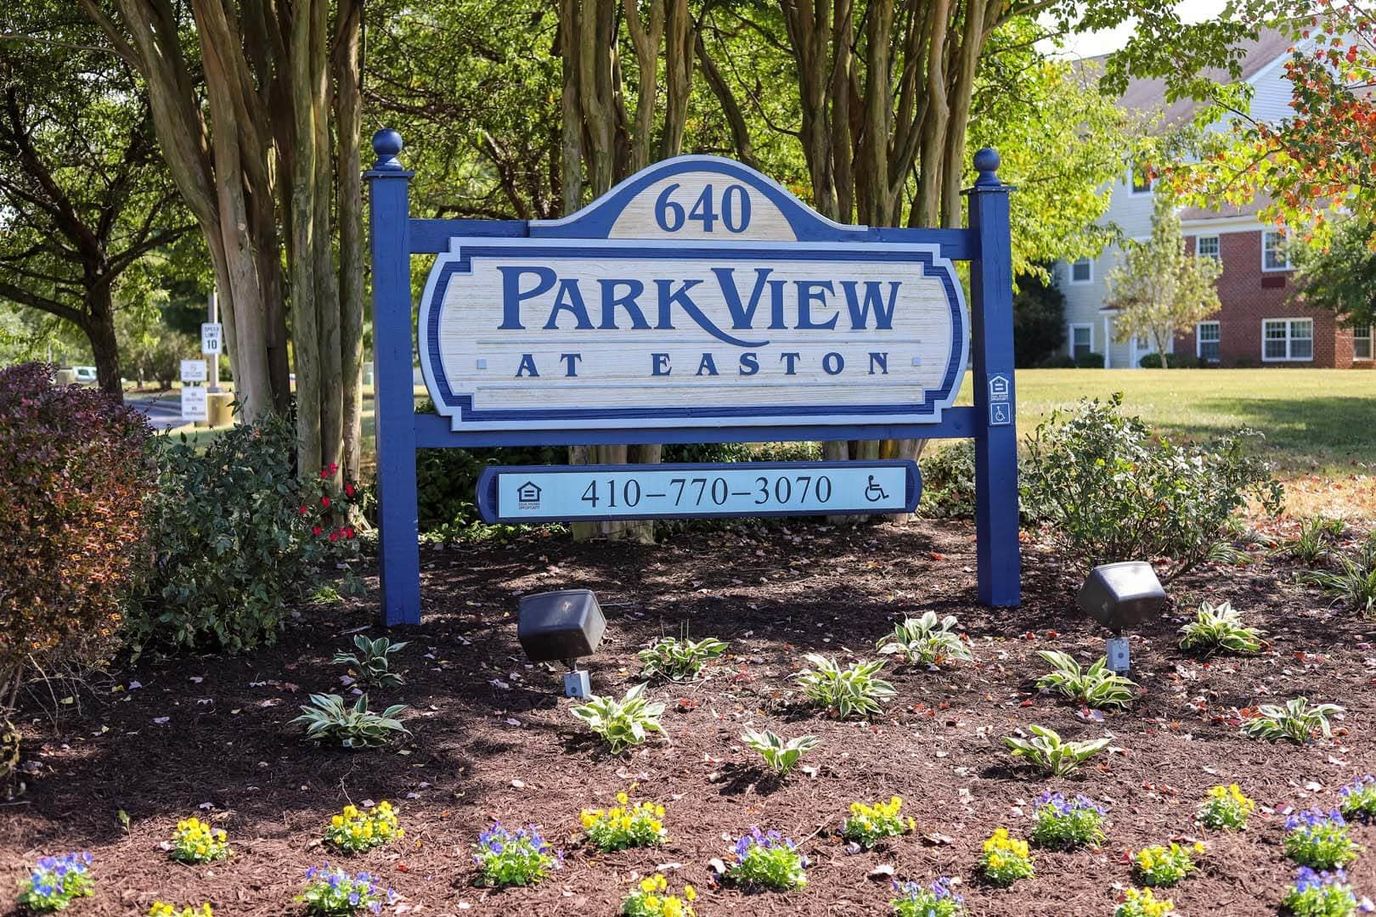
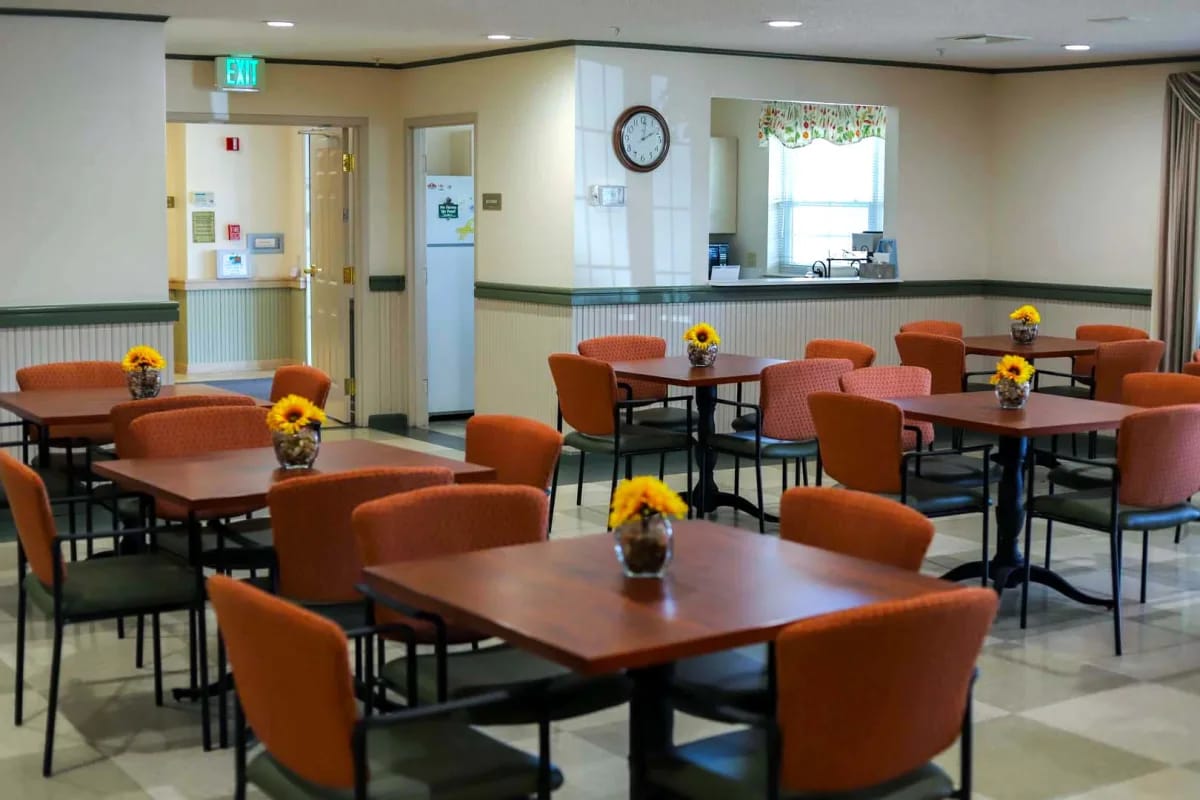
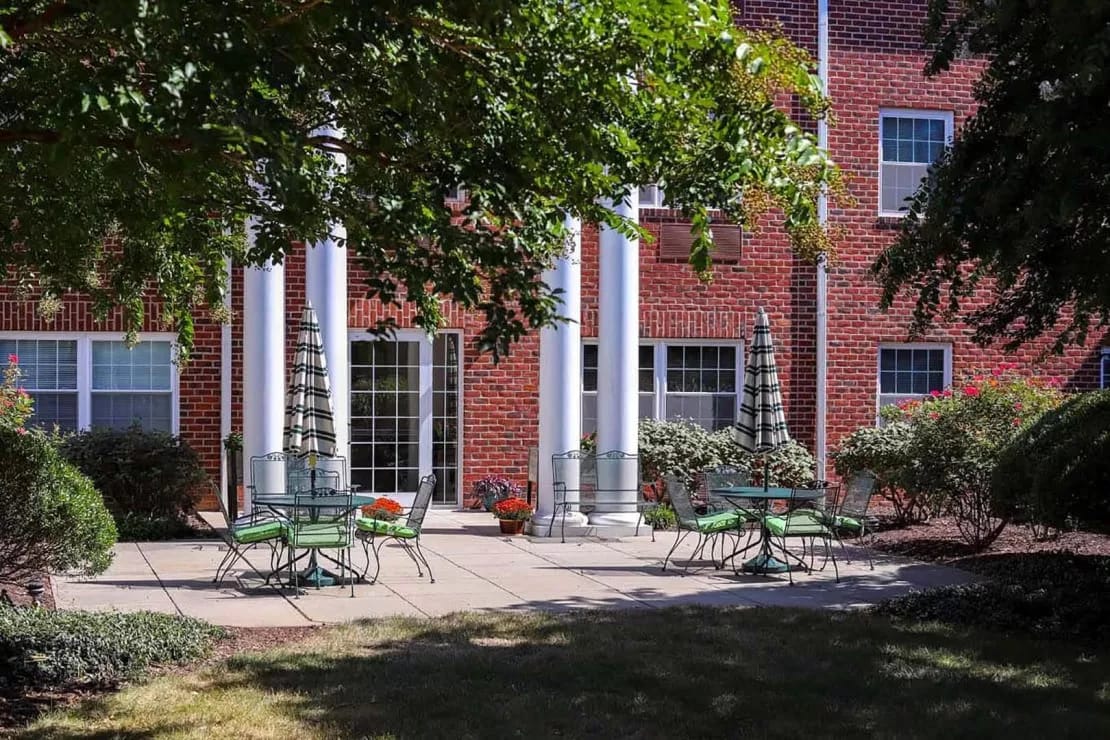
Park View at Easton is an active 62+ senior retirement community that wishes to age in a luxurious community. The vibrant atmosphere inspires and encourages a dignified senior living experience by providing personalized care to each unique individual. Park View strives to offer seniors the independence and choice to empower them to thrive in an environment with endless opportunit
Residents experience a true sense of safety and comfort, surrounded by highly trained staff with state-of-the-art features. Expect elegance and luxury in their well-lit, spacious common areas, beautifully furnished apartments, fully-equipped library, an on-site hair salon, and a Senior Care Center.
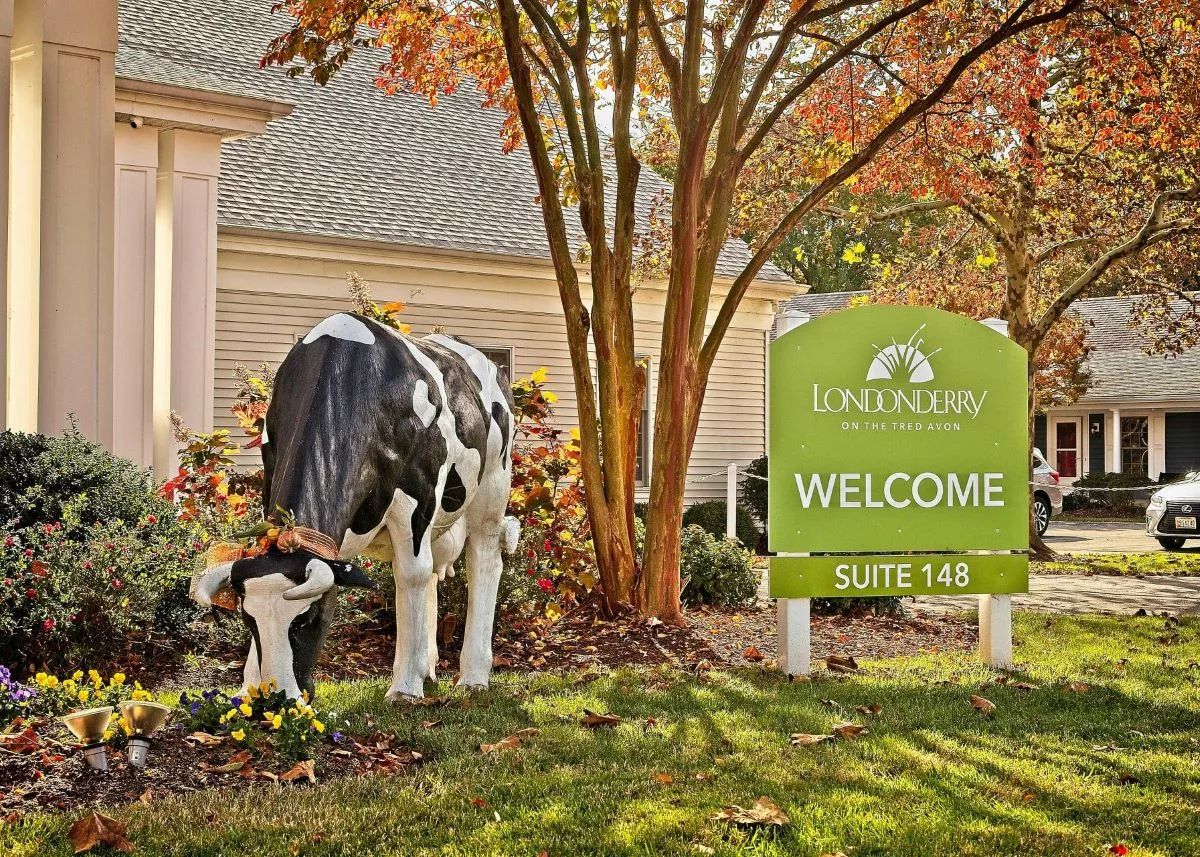
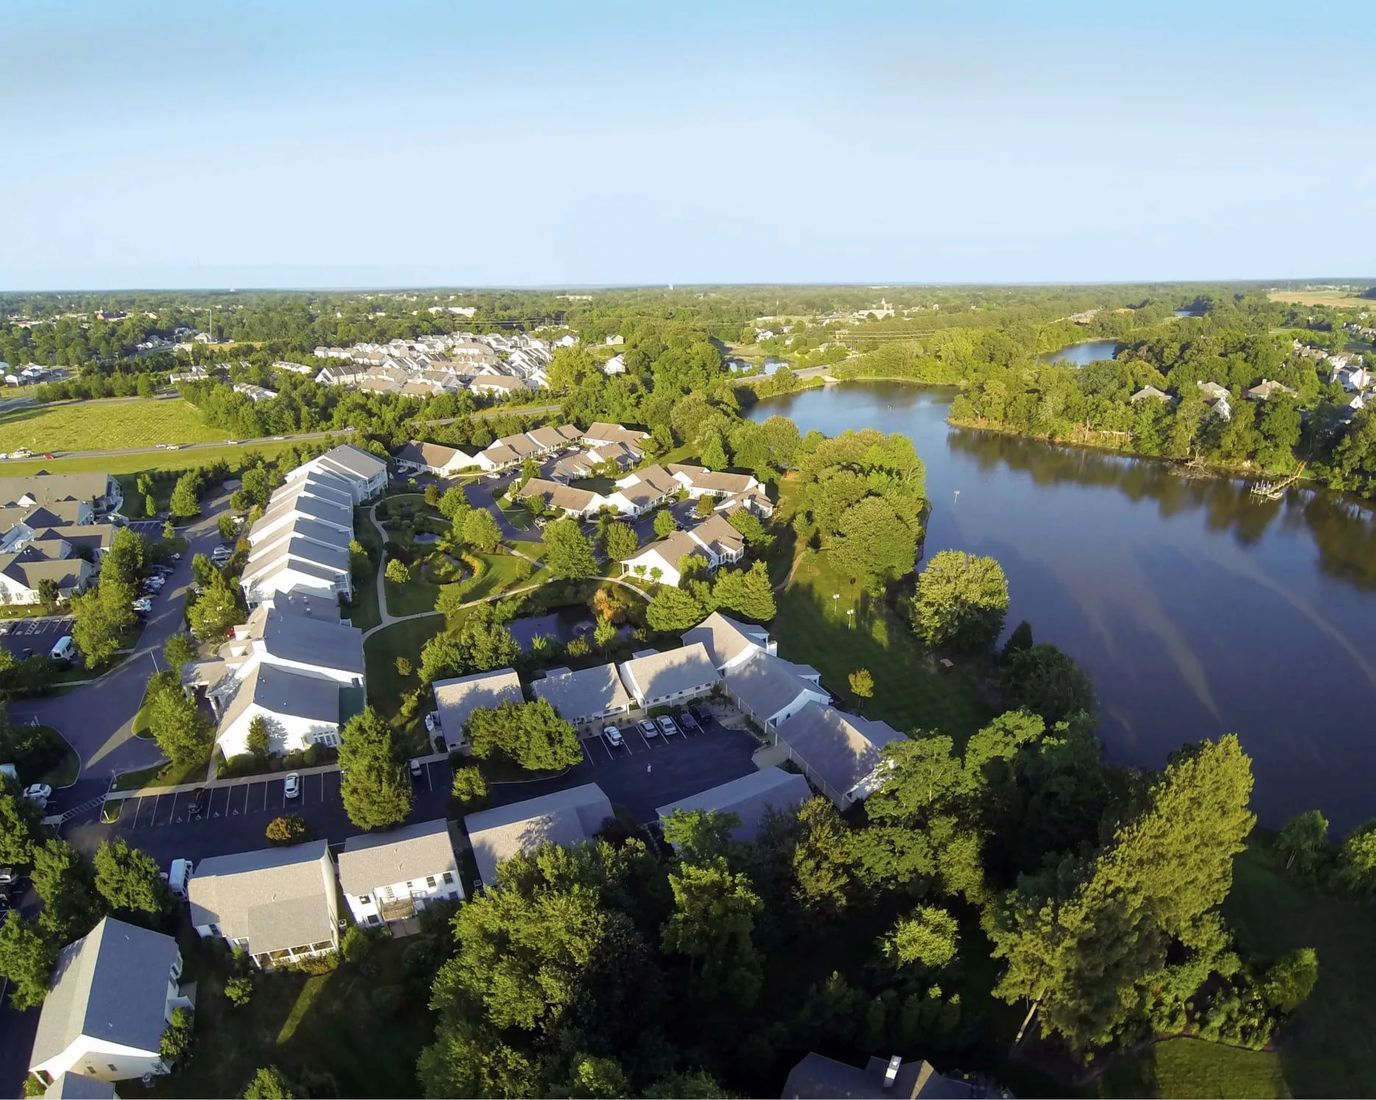
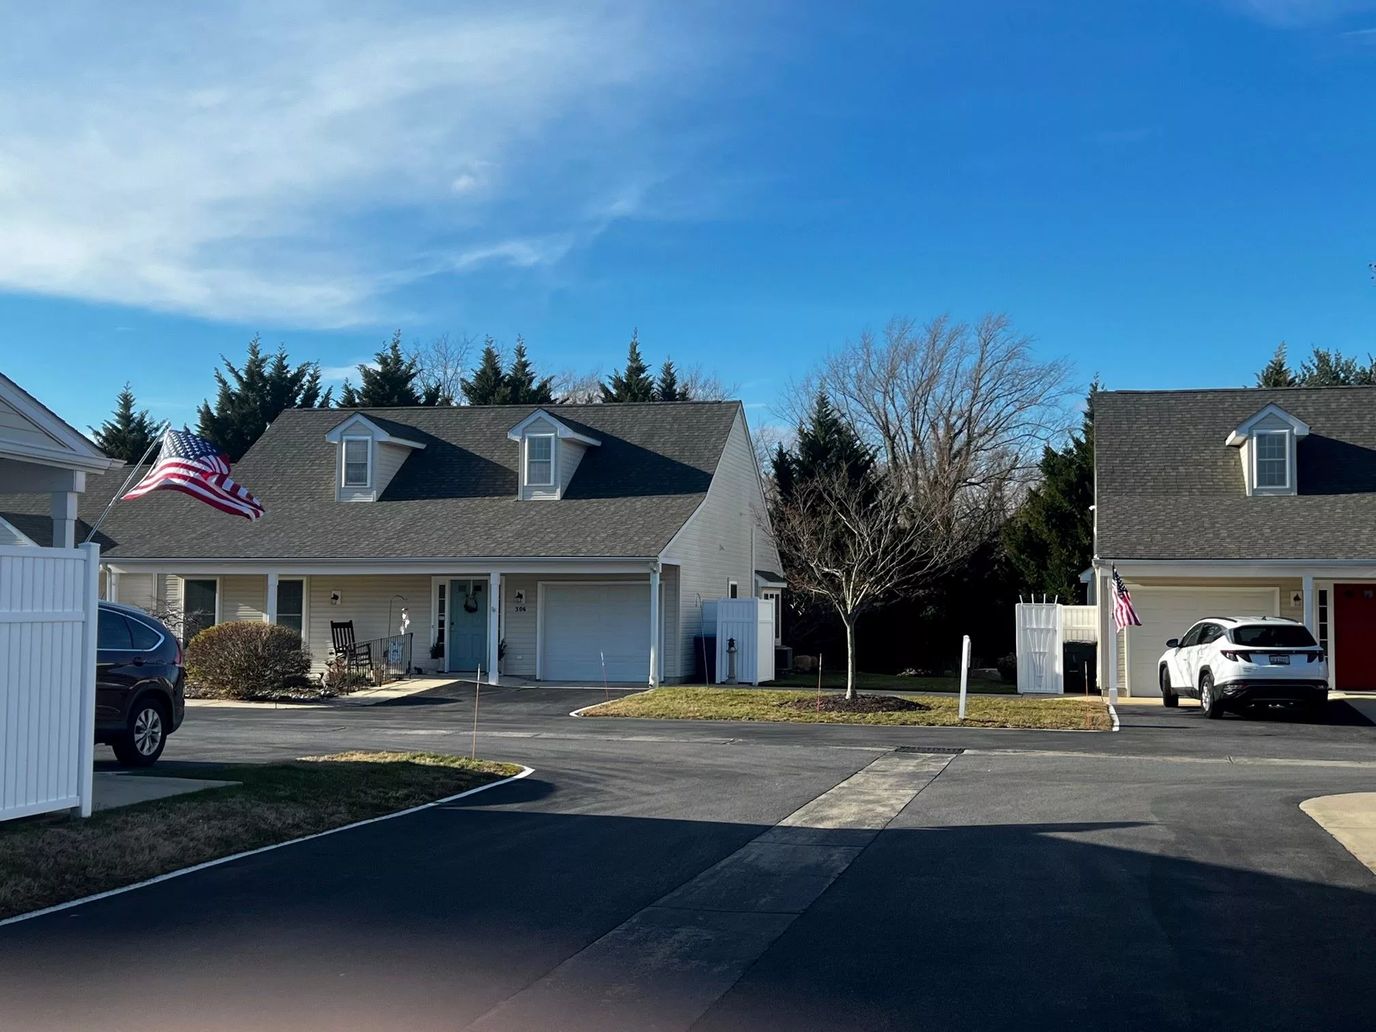
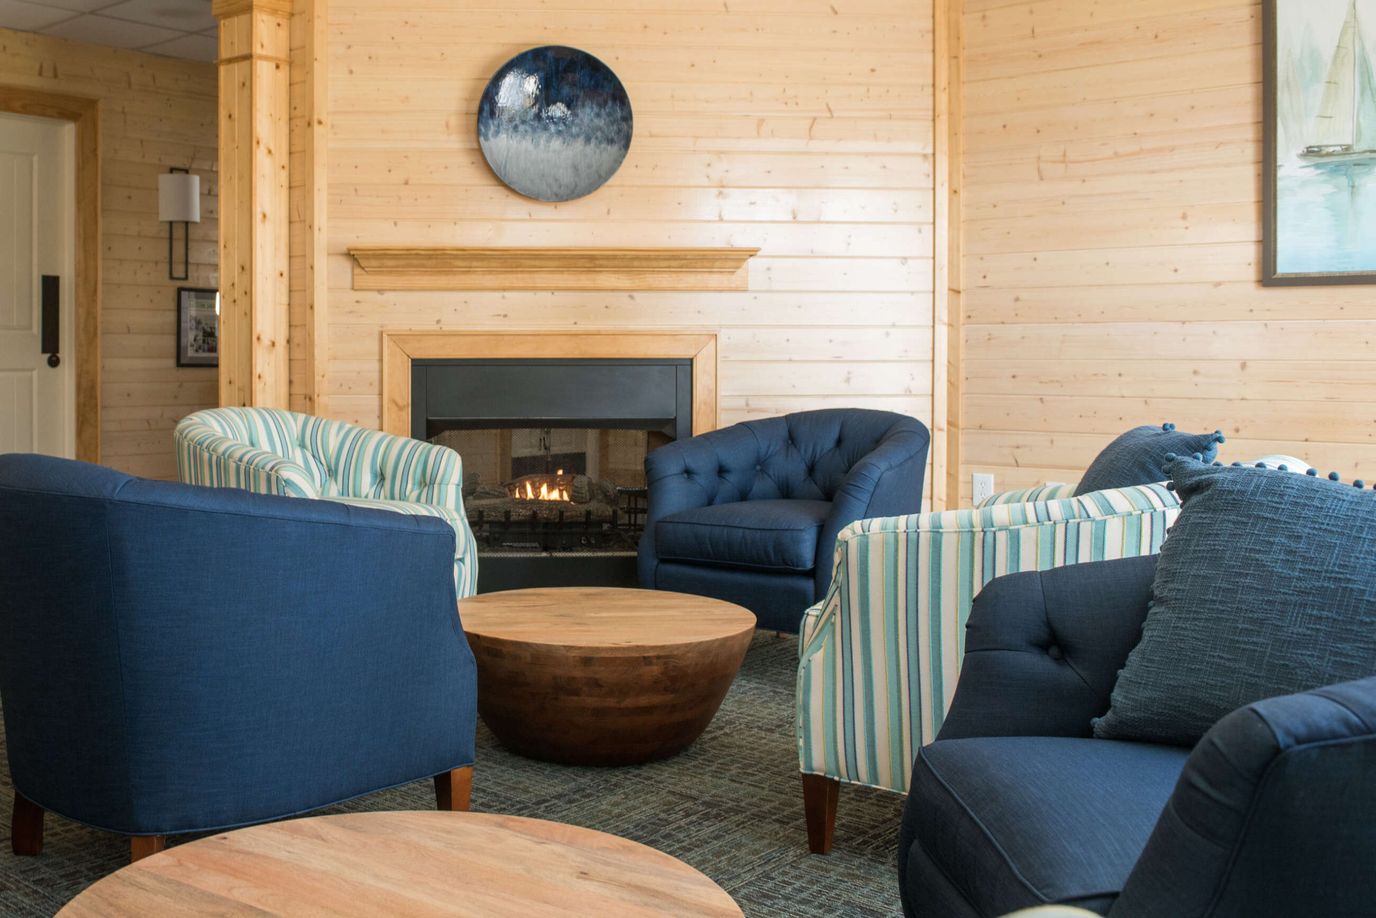
Overview of Londonderry on the Tred Avon

Londonderry on the Tred Avon is an upscale, active 62+ senior living community that provides cottages and apartment housing options. Residents maintain an engaging and active lifestyle throughout. The community’s specially trained staff is committed to helping seniors achieve complete independence while maintaining a purposeful life. Management ensures that residents are given compassionate care and commitment to provide a home-like environment.
For over 30 years, Londonderry has been considered the hub for active senior living. Community accommodations include life-enriching programs and engaging activities that encourage residents to maintain independence. These include The Tred Avon Tavern, a restaurant dining experience, a coffee bar, a library, and an activities center– to name a few.
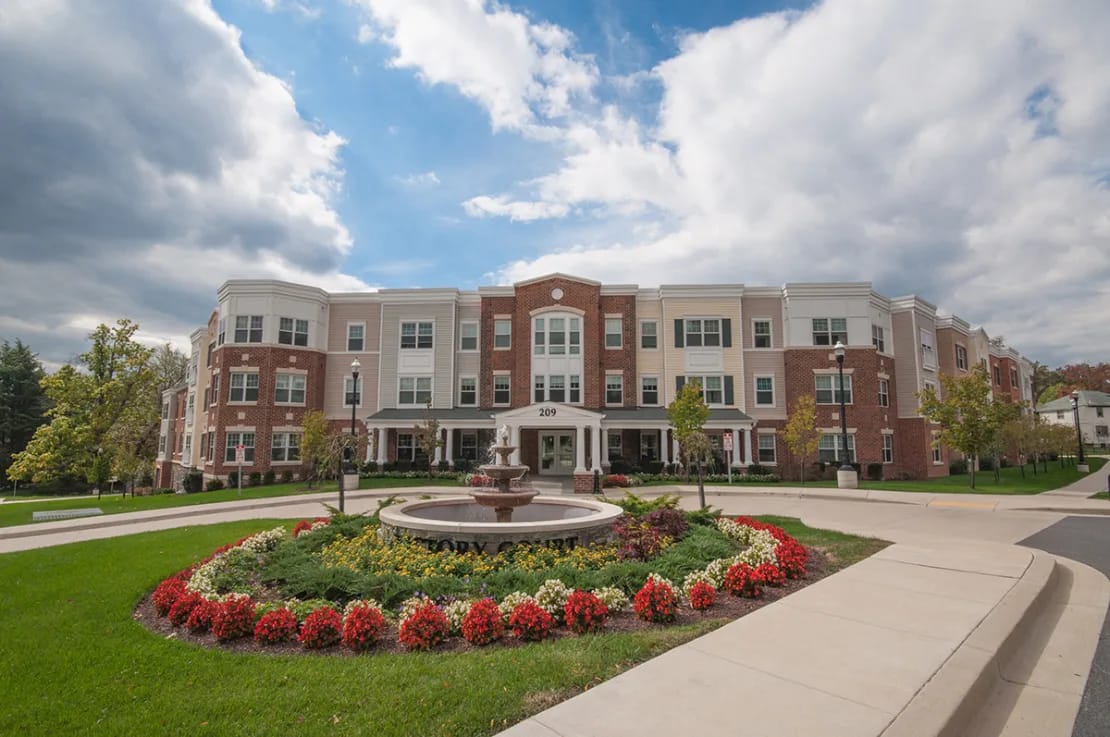
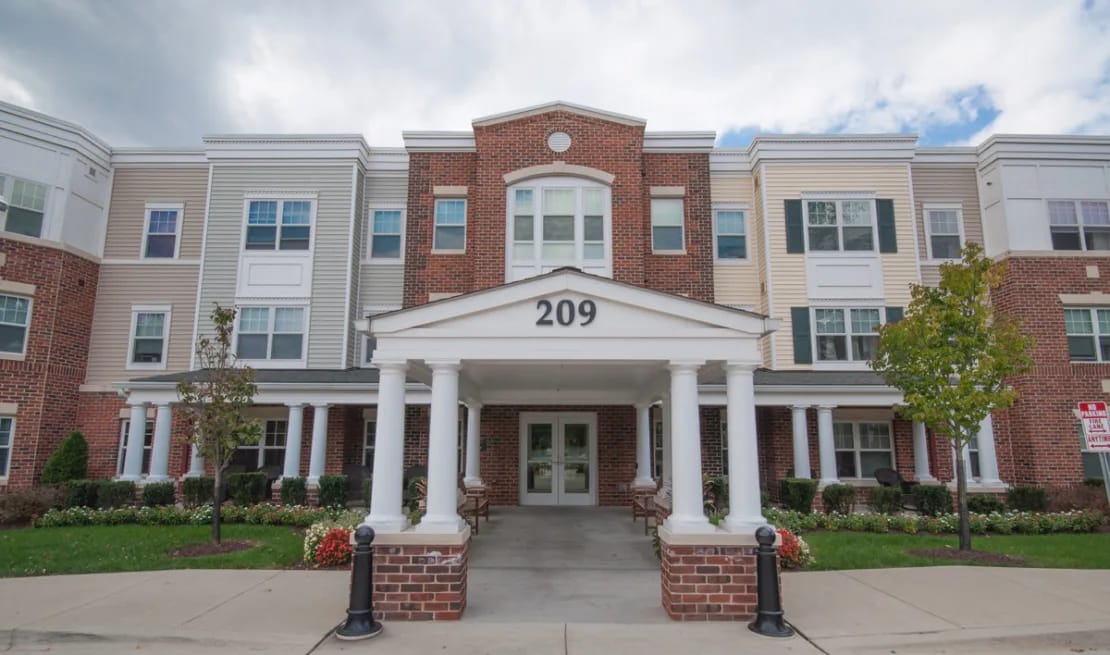
Discover Victory Court, an exclusive haven for seniors aged 62 and above. Nestled in the heart of Rockville, Maryland, between Monroe Street and Maryland Avenue, this remarkable apartment community harmoniously blends modern comforts and considerate features, ensuring a seamless and fulfilling daily life. Residents get attentive service, engage in creative pursuits in the arts and crafts room, enjoy friendly competition in the billiards room, and relax on the outdoor patio. Residents also get access to the library, the exercise room, and so much more.
With the Rockville Metro stop and Ride-On bus routes just moments away, Victory Court’s strategic location ensures accessibility and convenience. Surrounding amenities include dining, shopping, and entertainment options, with the Rockville Town Square, churches, grocery stores, and restaurants all within a convenient four-mile radius. Embark on a journey into a realm of modern luxury living interwoven with timeless sophistication at Victory Court.
Overview of Evergreens at Columbia Town Center

Make the most of your best years at Evergreens at Columbia Town Center, a distinct 55+ community in Columbia, MD, offering independent living. The community features beautifully furnished and cozy one- and two-bedroom floor plans, ensuring residents are comfortable and safe. Alongside convenient apartment features, maintenance and management are also provided, so residents can feel at ease during their stay.
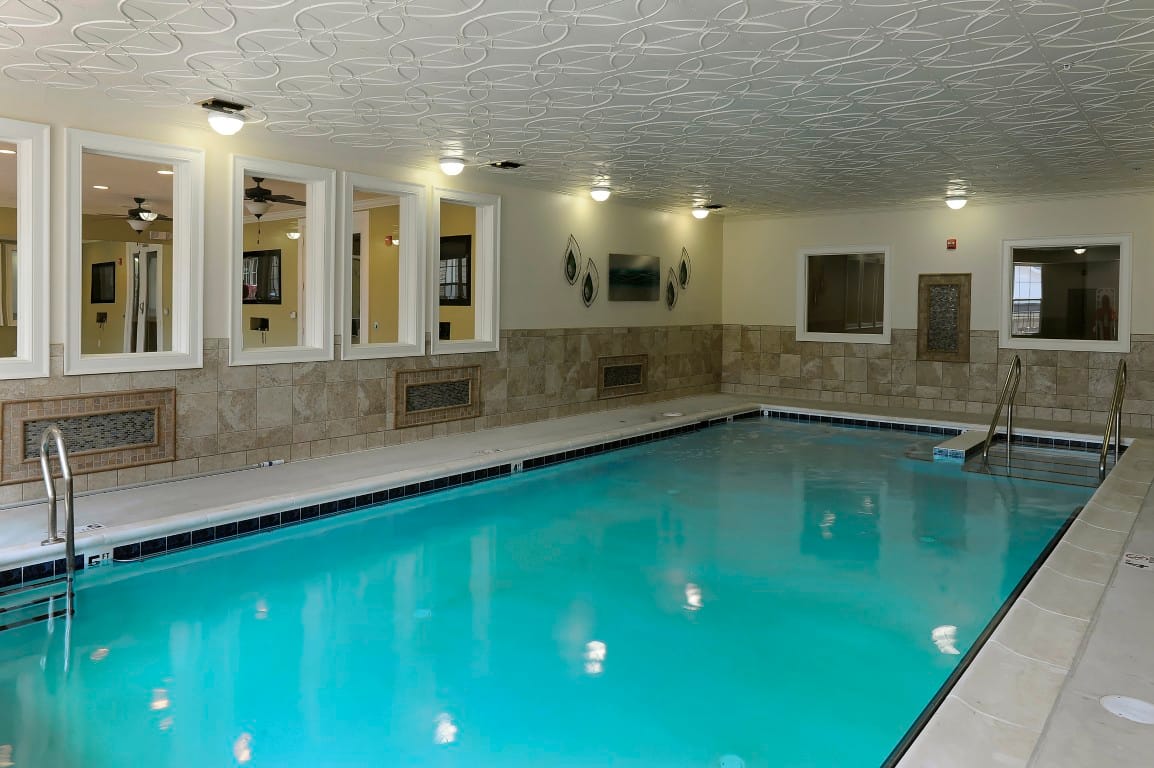
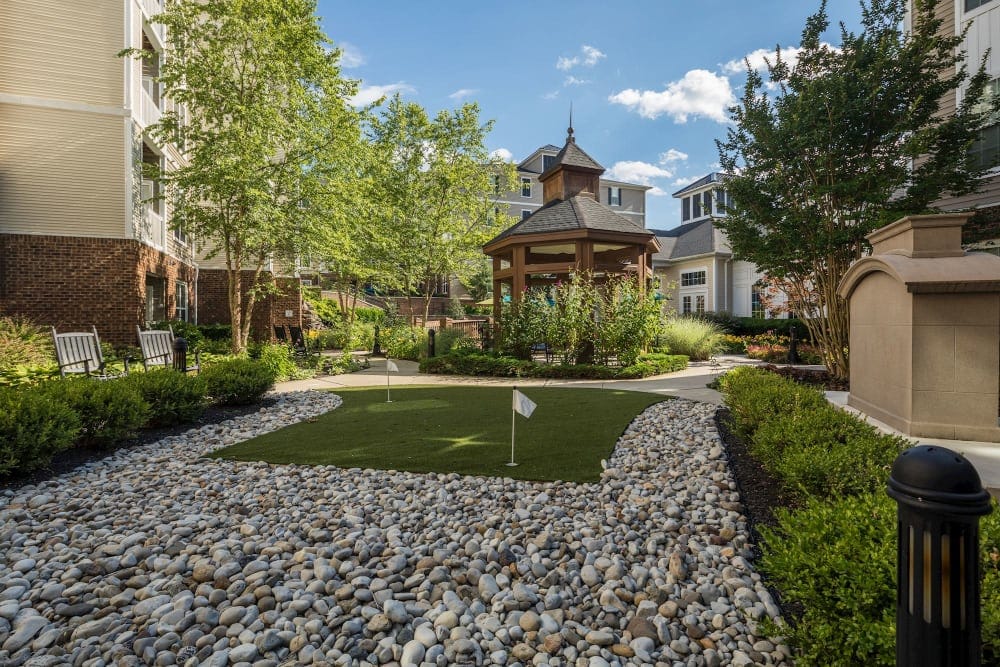
Fun recreational activities and enriching programs are conducted to keep residents active and socially connected. A fully equipped kitchen is also available, allowing residents to prepare meals according to their dietary needs and preferences. Residents are welcome to bring their pets to ease their loneliness. Amenities include a heated pool, a whirlpool, a putting green, a greenhouse, and exercise paths.
Ideally situated near Nymeo Field at Harry Grove Stadium in Frederick, MD, The Cascades of Frederick is a welcoming community that offers independent living. The community has beautifully furnished and spacious one- and two-bedroom floor plans, dedicated to residents’ comfort and safety. With plenty of convenient apartment features and maintenance services, residents enjoy a hassle-free living.
Cozy communal spaces and fun activities accompany residents, ensuring they won’t run out of things to do for leisure and wellness. Residents enjoy mealtimes with delightful dining options, with multiple dining venues, like the coffee bar and BBQ stations. The community is equipped with state-of-the-art amenities, creating the ideal setting for residents to thrive in their golden years.
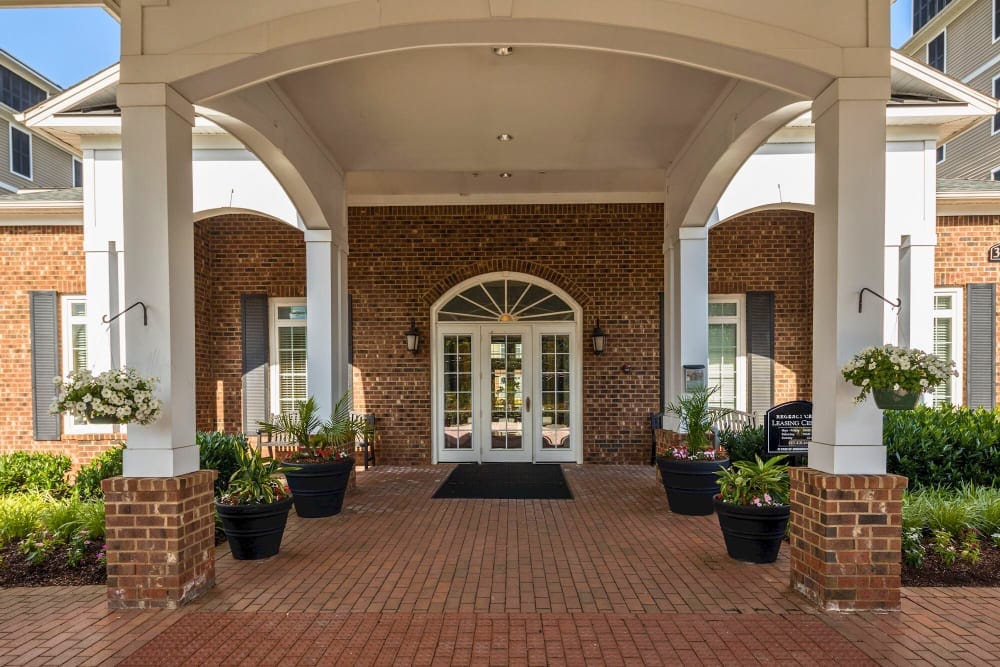
Overview of Regency Crest
Make the most of your retirement at Regency Crest, a distinguished community in Ellicott City, MD, offering independent living. The community is dedicated to the comfort of those 55+, providing a variety of specially designed one- to three-bedroom floor plans. Residents maintain their independence without hassles, with exceptional services that help with their chores and maintenance.
Fun recreational activities and engaging programs are conducted, encouraging residents to interact with their surroundings and live actively. Delightful restaurants and shops nearby also provide residents with plenty of dining options that cater to their dietary needs and preferences. With its warm and welcoming environment, residents will surely thrive in their golden years.
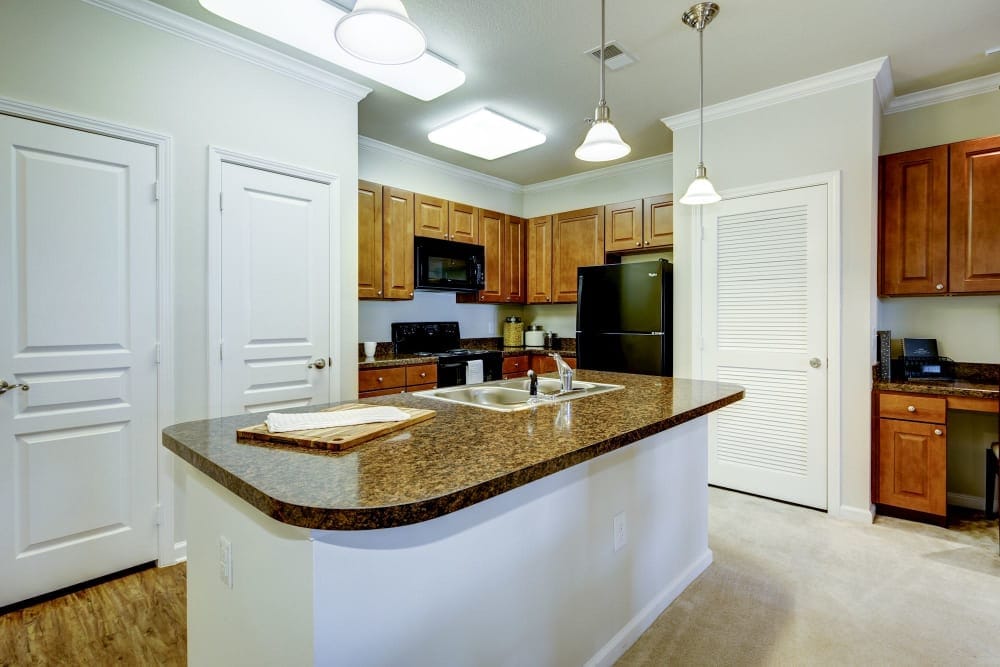
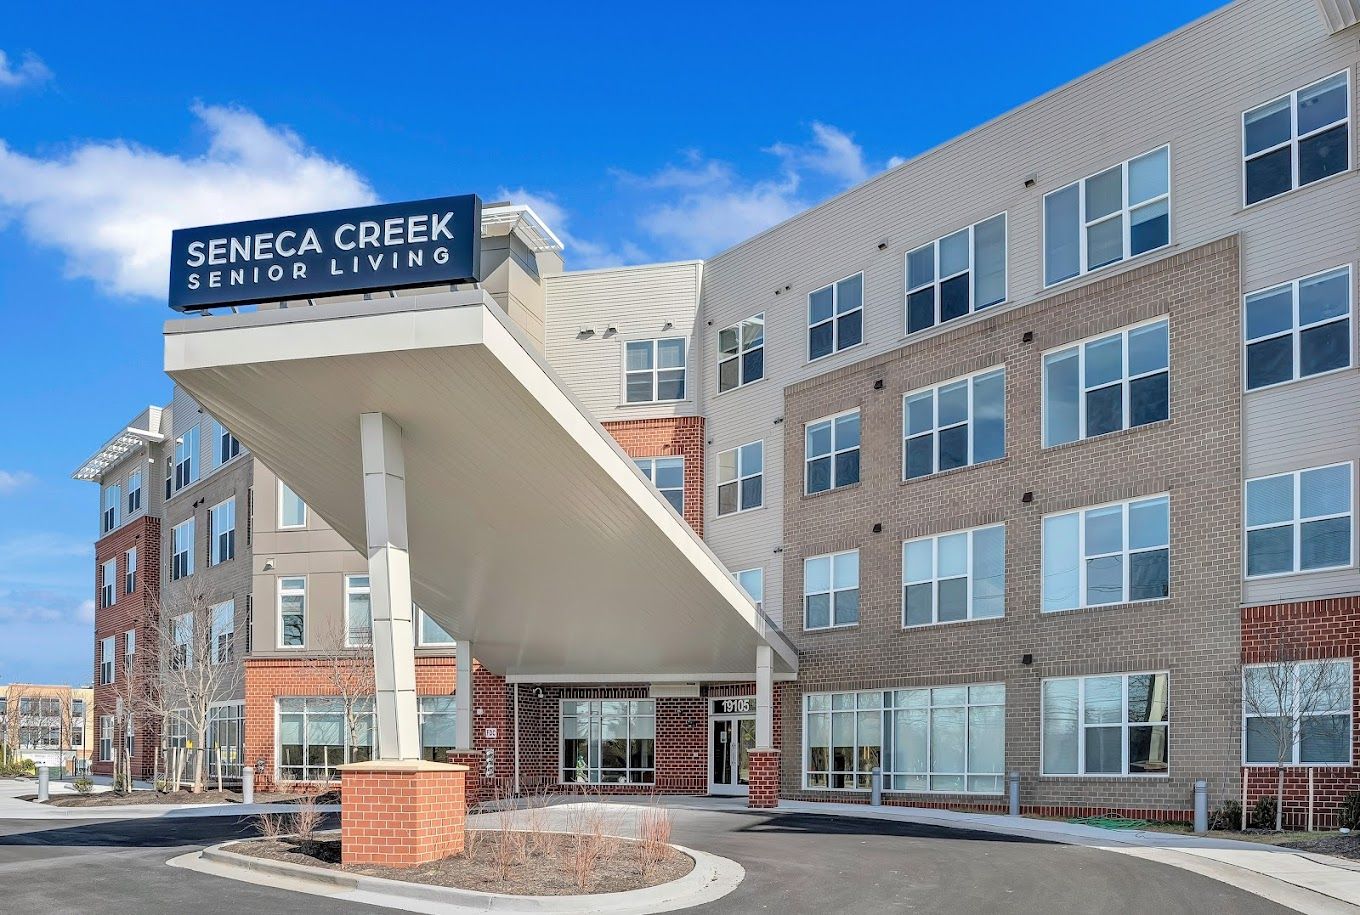
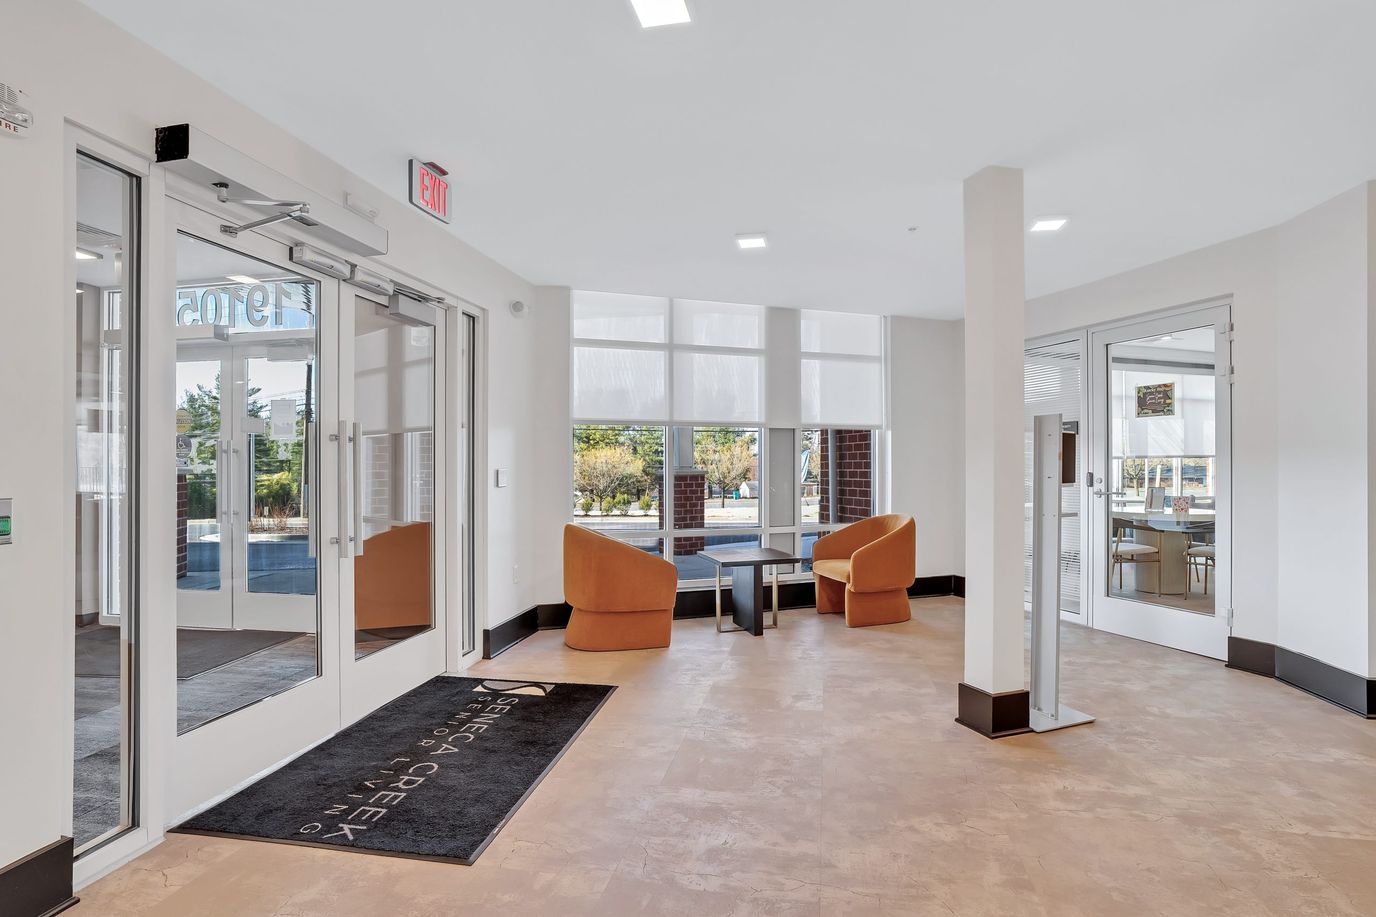
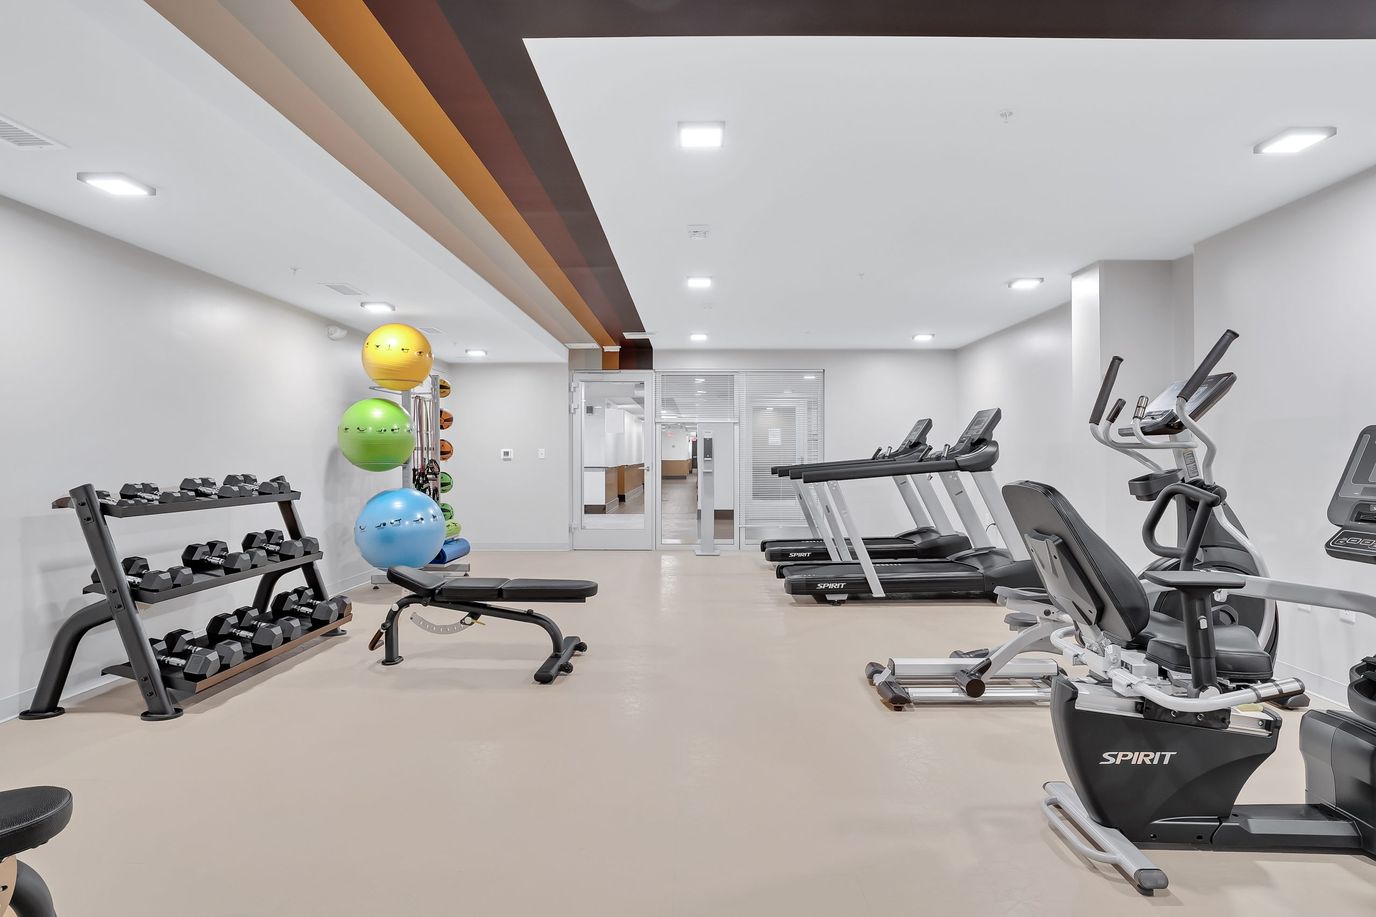
Beautifully set near Great Seneca Park 355 in Gaithersburg, MD, Seneca Creek Senior Living is a blissful retreat that offers independent living. Those 62+ can rest assured of finding the accommodation that best matches their preferences with beautifully designed and spacious one- and two-bedroom floor plans. Residents enjoy a hassle-free lifestyle with top-notch apartment features.
Unique local amenities, dining, and shopping are easily accessible, providing residents with unending leisure and wellness opportunities. With an open kitchen in each unit, residents can prepare meals according to their dietary needs and preferences. Pets are also welcome to accompany residents to ease their loneliness. The community is ideal for those aiming to downsize in retirement.
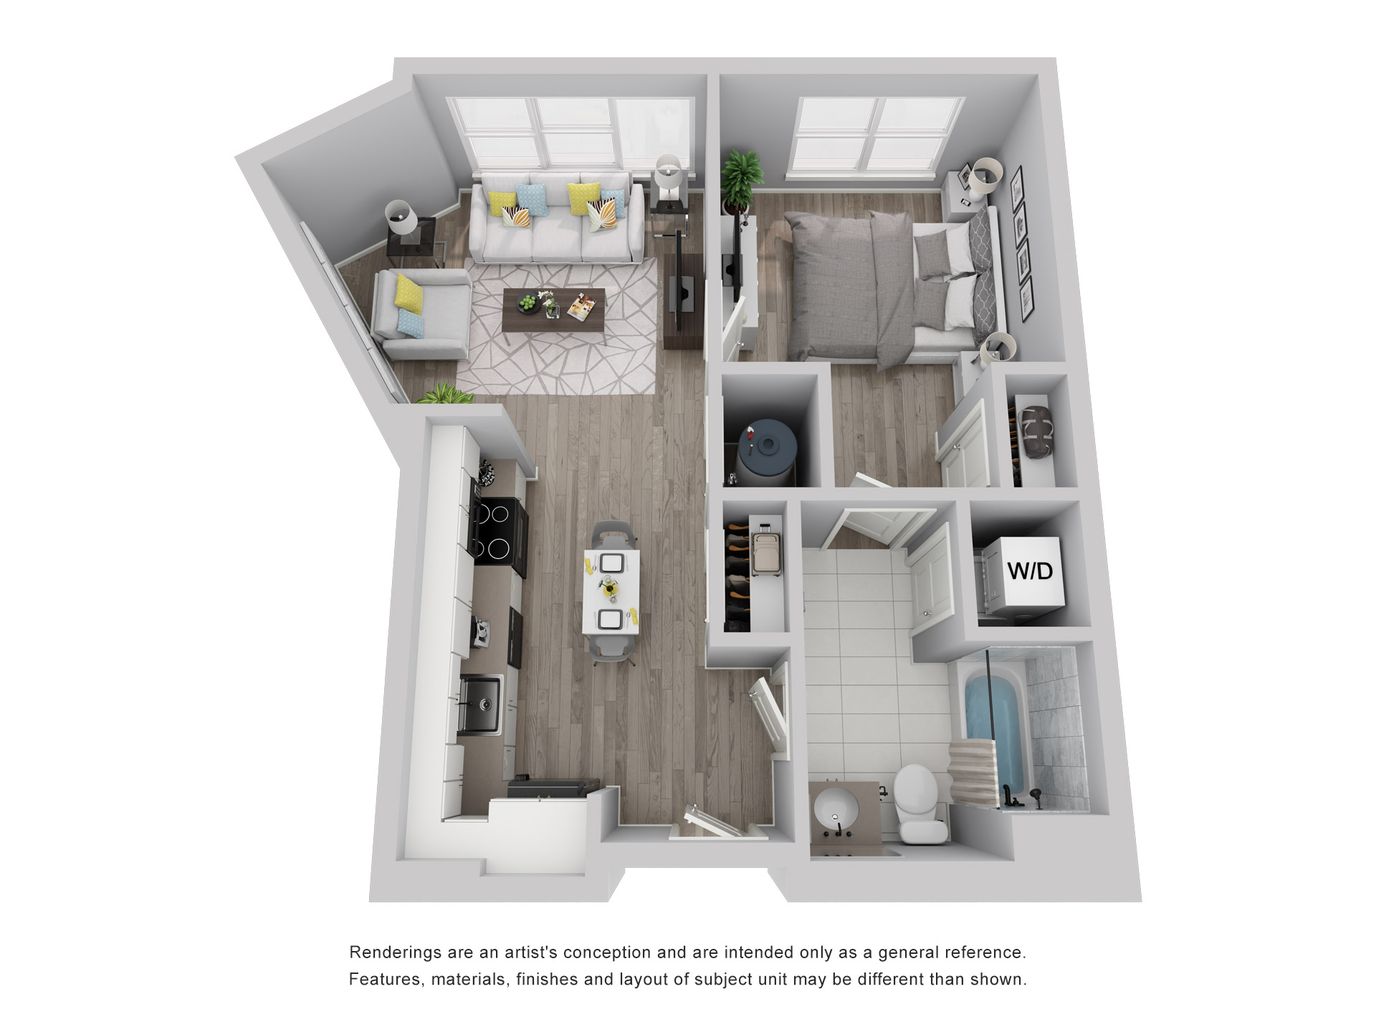
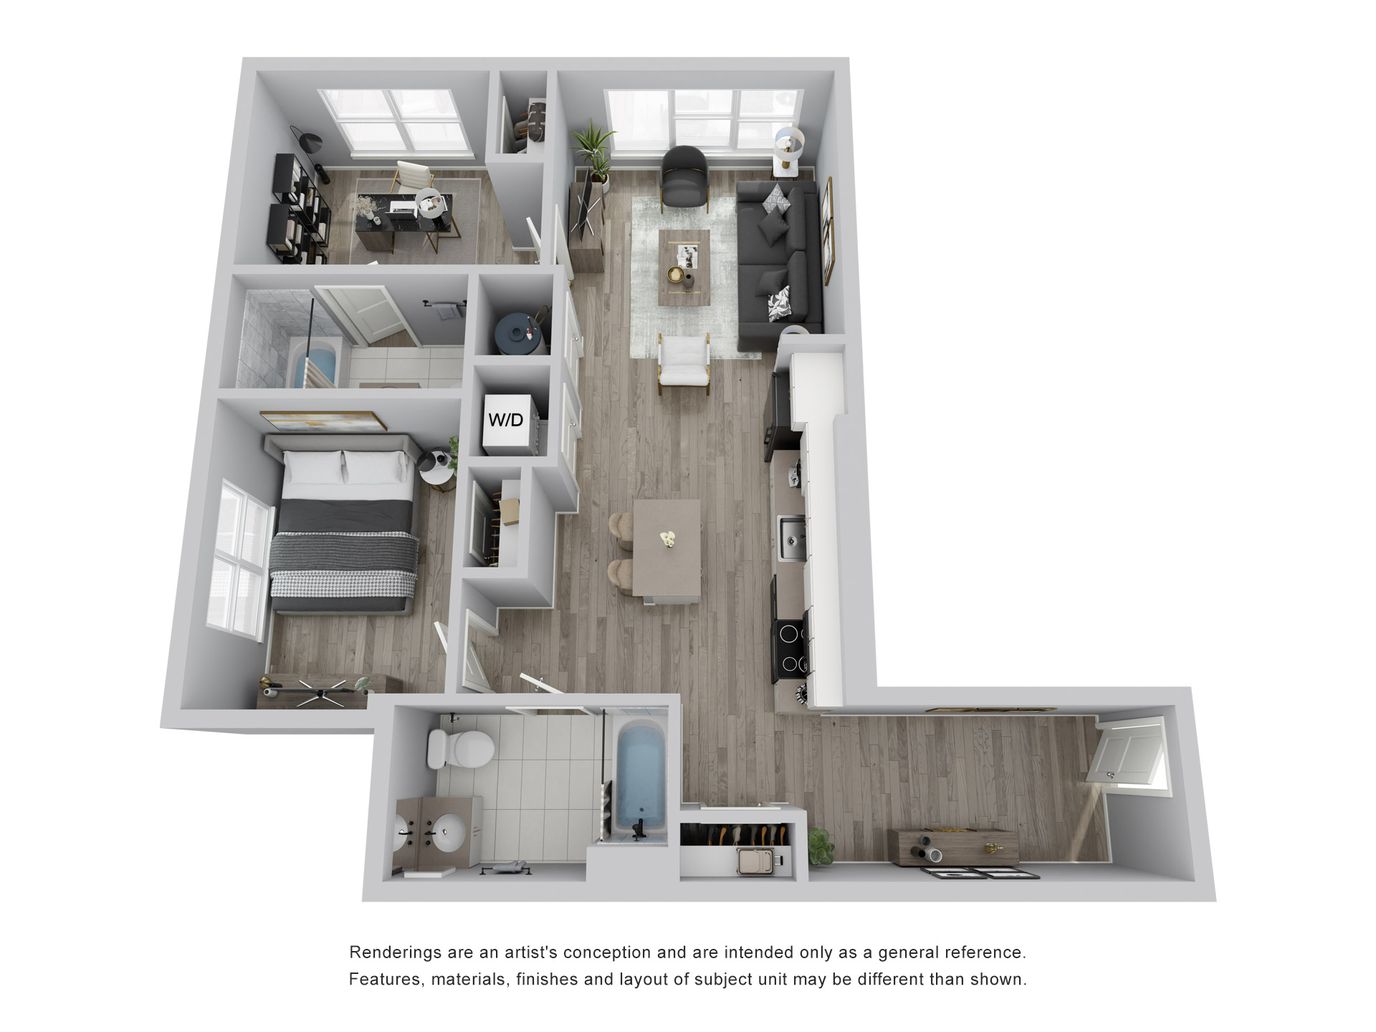
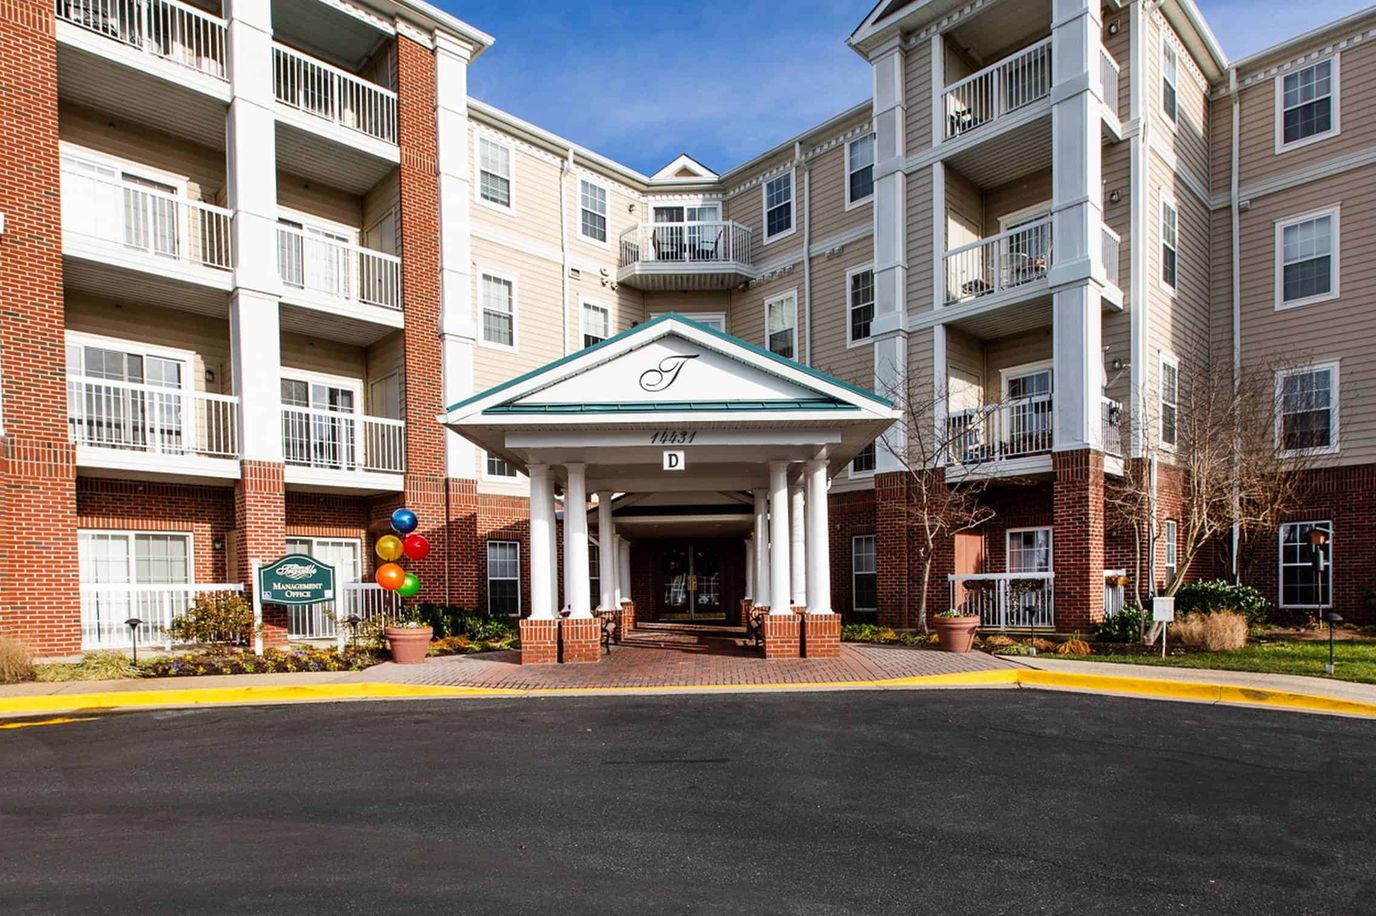
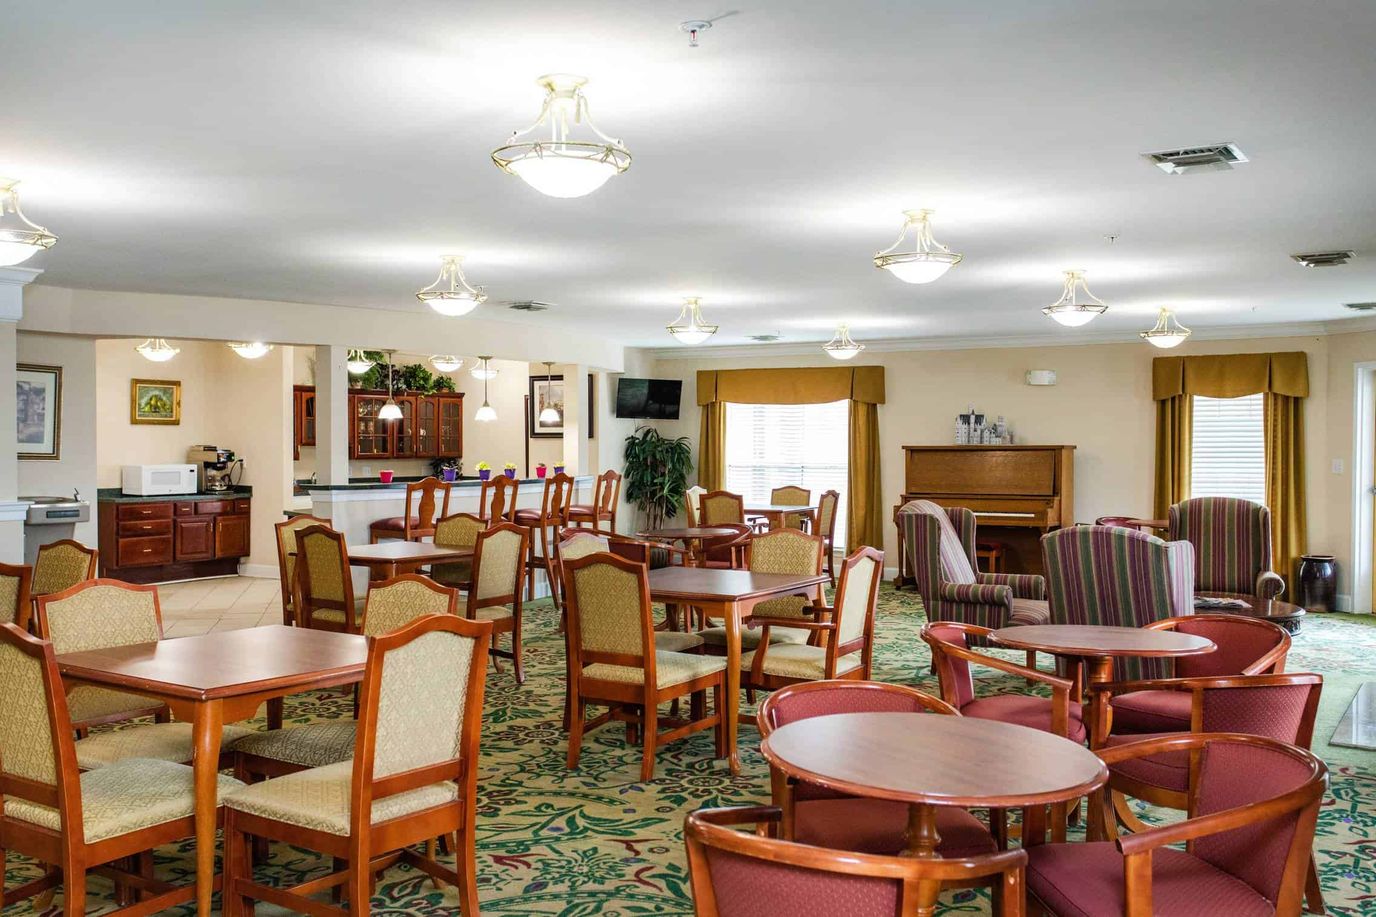
Welcome to Gardens of Traville, an assisted living community thoughtfully designed to cater exclusively to seniors. Gardens of Traville presents a unique collection of one and two bedroom apartment homes, generously spread across a serene expanse in Rockville, Maryland. Nestled in a peaceful locale, this assisted living community extends its benefits to adults aged 62 and above, seamlessly harmonizing the privileges of premier independent living with the liberating flexibility of a rental community.
The senior living apartments within Gardens of Traville unveil a host of thoughtful features, including fully-equipped kitchens, upgraded bathrooms, and responsive emergency systems. As residents step outside their abodes, they are greeted by a carefully curated array of amenities, encompassing a hair salon, computer center, wellness facilities, and more. Every facet of Gardens of Traville has been designed with the well-being and comfort of residents in mind, allowing them to experience the true essence of senior living. Discover a residence where convenience and tranquility coalesce to create an environment you can truly call home.
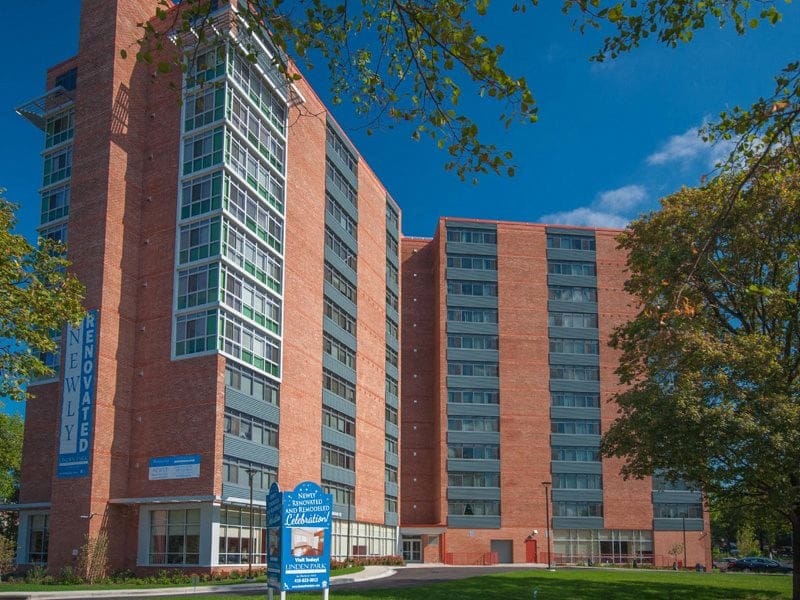
Overview of Linden Park Apartments
Linden Park Apartments sits in Bolton Hill, Baltimore’s cultural district, about 2.0 miles from downtown. It’s a high-rise, and it’s built specifically for adults 62 and up who want their own space without needing daily help or medical care built in. The Walk Score here is 87, so it’s very walkable and most errands don’t require a car.
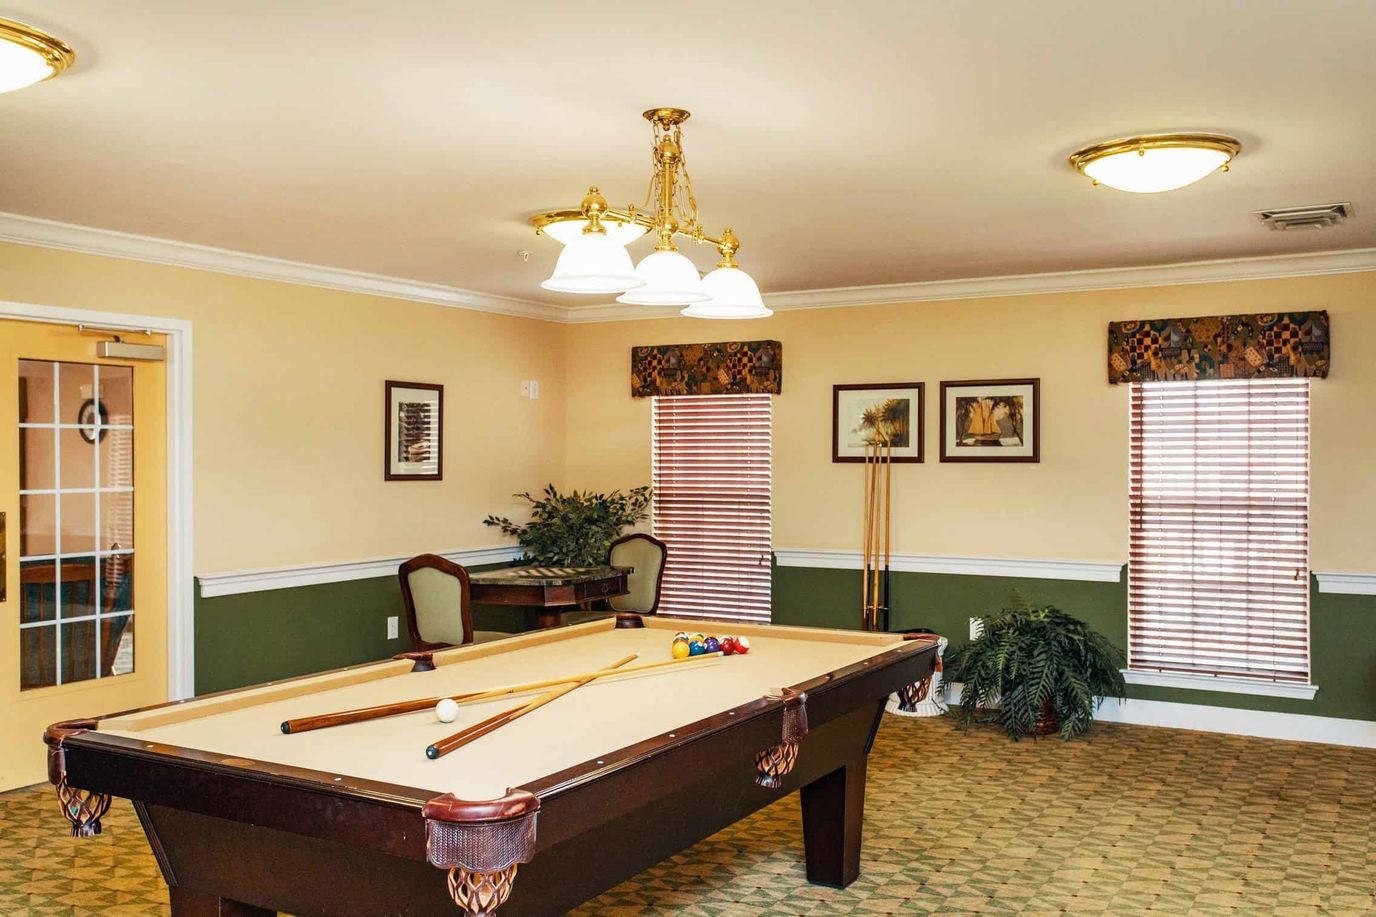
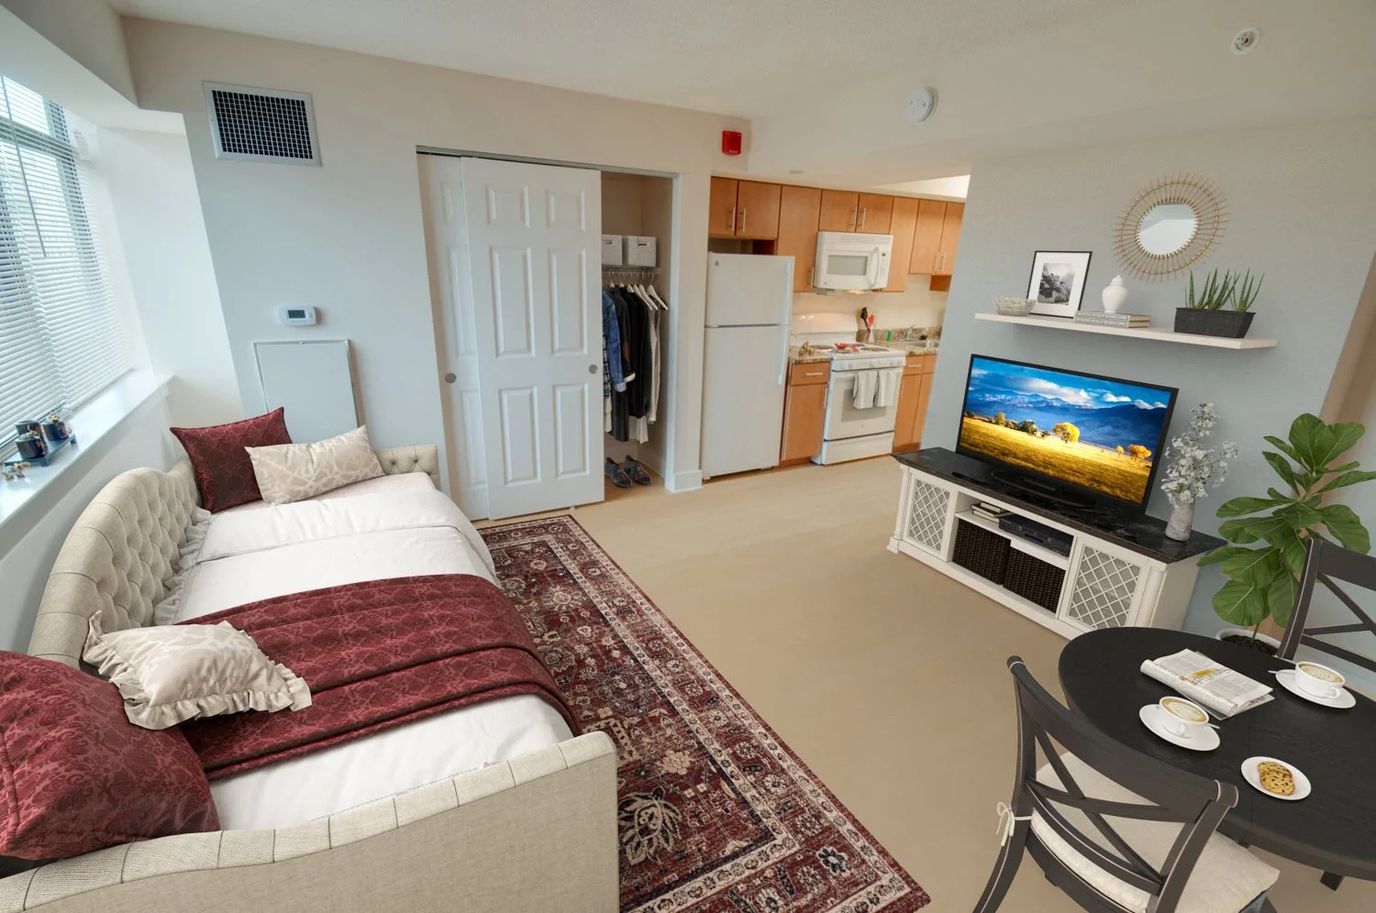
Apartments come in three sizes: studios around 400 square feet, one-bedrooms at 525, two-bedrooms at 801, several with city views thrown in. Downstairs and around the building, there’s a fitness center, a computer lounge, and a billiards room, so there’s somewhere to go that isn’t just your own unit. Transportation services exist too, for anyone who wants to get around the city without driving themselves everywhere.
Something breaks at 2am? There’s 24-hour emergency maintenance for that, plus on-site management during regular hours. It’s the kind of infrastructure that matters more than people expect until they actually need it. Pets are welcome here too, which rules out one common reason people hesitate before downsizing.
Here’s the thing about independent living specifically: no medical care, no nursing staff, none of that. This is for people who are still fully capable of running their own lives and just want less of the maintenance and more of the community built in. Linden Park Apartments reads like exactly that kind of setup: apartment living with amenities and support infrastructure layered underneath it, in a genuinely walkable pocket of the city.
Ranking Methodology
How we rank these independent living communities
Every community above is evaluated across six weighted categories using public data including state inspection records, review platforms, BBB profiles, and operator-published materials.
Weighting overview
- 35%Resident Experience
- 25%Regulatory
- 15%Visual Media
- 10%Website
- 10%Stability
- 5%Environment
01
Resident & Family Experience 35%
The single largest share of every ranking. Aggregated review sentiment and volume from major platforms — the closest signal to real resident experience.
- Includes
- Review Sentiment
- Review Volume
02
Regulatory & Safety Record 25%
State inspection records, citations, and complaint visits. We weight per-inspection rates more heavily than raw counts.
- Includes
- State Inspections
- Citations/Inspection
- % Inspections w/ Citations
- Complaint Visits
- Accreditations
- BBB Rating
03
Visual Media & Transparency 15%
Communities that publish high-quality visuals give families a real preview. No photos or tours = a negative transparency signal.
- Includes
- Video Tours
- Virtual Walkthroughs
- Photo Quantity
- Photo Quality
04
Website & Operator Transparency 10%
Site quality and whether the operator publishes basic accountability information — staff names, contact details, ownership.
- Includes
- Website Content
- Mobile Usability
- Staff Info Available
- Owner Info Available
05
Community Stability 10%
Operational signals indicating whether a community is well-run and meeting demand.
- Includes
- Occupancy Rate
- Bed Options
06
Environment & Pricing 5%
Walkability and pricing transparency. Walk Score is weighted higher for Independent Living than for Memory Care, where most residents do not leave unaccompanied.
- Includes
- Walk Score
- Pricing Transparency
Who we are
Your Senior Care Partner, Every Step of the Way
We help families find affordable senior communities and unlock same day discounts, Medicaid, and Medicare options tailored to your needs.
Contact us Today
Frequently Asked Questions about Independent Living in Maryland
What is independent living?
Independent living communities are residential settings for active older adults — typically with private apartments or cottages, shared amenities (dining, fitness, activities), and no built-in medical care.
How many independent living communities are listed on this page?
This page features 164 independent living communities in Maryland. Use the filters and comparison tools above to compare ratings, amenities, and pricing.
How do I choose the right independent living community in Maryland?
Start by matching the level of care offered to the resident's current and anticipated needs, then compare licensing status, staff-to-resident ratios, recent inspection results, and pricing. Tour at least two or three communities in Maryland, talk to current residents and families, and confirm what is included in the base rate versus billed as add-on services.
What should I look for when visiting independent living communities in Maryland?
Pay attention to staff interactions with residents, cleanliness and odor, food quality at meal times, the activity calendar, and how questions about pricing and care plans are answered. Ask to see the most recent state inspection report, the move-out / level-of-care-change policy, and a sample monthly bill that lists every fee.
Updated on
