


Where in Maryland are you looking?
Browse communities by city.
Compare Independent Living around Maryland
| Edenwald Senior Living | IL AL MC NH SNF | Towson (Southerly Road) | 94
Facility
94
MD AVG
43
Rank
#144 / 690 | No |
83
Facility
83
MD AVG
43
Rank
#70 / 985 | 1 Bed / 2 Bed | - | A+ |
18% Male Residents — State Benchmarked 18% of residents are male, compared to the Maryland average of 31%. This facility caters to a majority female resident pool (82% female), consistent with the broader assisted living trend where women significantly outnumber men. |
82% Female Residents — State Benchmarked 82% of residents are female, compared to the Maryland average of 69%. Women comprise the large majority, consistent with national assisted living demographics where women live longer and enter care facilities at higher rates. |
100% White Residents — State Benchmarked 100% of residents are reported as White, compared to the Maryland average of 81%. A higher White share than is typical for assisted living in Maryland in this dataset — compare with peer facilities for local context. |
0% African American Residents — State Benchmarked 0% of residents are reported as African American or Black, compared to the Maryland average of 13%. A lower African American share than is typical in Maryland; local markets still vary widely. |
0% Other Ethnicity Residents — State Benchmarked 0% of residents fall into categories other than White or African American (combined), compared to the Maryland average of 6%. This column aggregates Hispanic, Asian, multiracial, and any other labeled groups that are not classified as White or African American. | - |
13% Residents Age 75–84 — State Benchmarked 13% of residents are 75–84, compared to the Maryland average of 31%. Below the state norm — the resident mix may skew either younger or older than this typical middle bracket. |
53% Residents Age 85–94 — State Benchmarked 53% of residents are 85–94, compared to the Maryland average of 44%. A high concentration of very elderly residents signals a higher-acuity facility with experience caring for advanced age-related needs. |
35% Residents Age 95+ — State Benchmarked 35% of residents are 95 or older, compared to the Maryland average of 16%. A high proportion of the oldest-old suggests strong end-of-life care experience and very-high-acuity capabilities. |
| Homewood Living Frederick | IL AL MC NH SNF | Frederick | 120
Facility
120
MD AVG
43
Rank
#76 / 690 | Yes |
14
Facility
14
MD AVG
43
Rank
#788 / 985 | 1 Bed / 2 Bed | - | - | - | - | - | - | - | - | - | - | - |
| Ingleside at King Farm | IL AL MC NH SNF | Rockville (King Farm) | 45
Facility
45
MD AVG
43
Rank
#226 / 690 | Yes |
73
Facility
73
MD AVG
43
Rank
#152 / 985 | 1 Bed / 2 Bed | - | - | - | - | - | - | - | - | - | - | - |
| Bedford Court, a CCRC | IL AL HOS MC NH RC SNF | Silver Spring (International Drive) | 76
Facility
76
MD AVG
43
Rank
#179 / 690 | Yes |
64
Facility
64
MD AVG
43
Rank
#261 / 985 | Studio / 1 Bed | 34
Facility
34
MD AVG
21
Rank
#22 / 210 | - |
15% Male Residents — State Benchmarked 15% of residents are male, compared to the Maryland average of 31%. This facility caters to a majority female resident pool (85% female), consistent with the broader assisted living trend where women significantly outnumber men. |
85% Female Residents — State Benchmarked 85% of residents are female, compared to the Maryland average of 69%. Women comprise the large majority, consistent with national assisted living demographics where women live longer and enter care facilities at higher rates. |
95% White Residents — State Benchmarked 95% of residents are reported as White, compared to the Maryland average of 81%. A higher White share than is typical for assisted living in Maryland in this dataset — compare with peer facilities for local context. |
3% African American Residents — State Benchmarked 3% of residents are reported as African American or Black, compared to the Maryland average of 13%. A lower African American share than is typical in Maryland; local markets still vary widely. |
2% Other Ethnicity Residents — State Benchmarked 2% of residents fall into categories other than White or African American (combined), compared to the Maryland average of 6%. This column aggregates Hispanic, Asian, multiracial, and any other labeled groups that are not classified as White or African American. Reported subgroups in this total: Asian (2%). |
2% Residents Age 65–74 — State Benchmarked 2% of residents are 65–74, compared to the Maryland average of 13%. Fewer younger seniors suggests the resident population skews older, likely requiring higher acuity care and more hands-on support. |
8% Residents Age 75–84 — State Benchmarked 8% of residents are 75–84, compared to the Maryland average of 31%. Below the state norm — the resident mix may skew either younger or older than this typical middle bracket. |
65% Residents Age 85–94 — State Benchmarked 65% of residents are 85–94, compared to the Maryland average of 44%. A high concentration of very elderly residents signals a higher-acuity facility with experience caring for advanced age-related needs. |
26% Residents Age 95+ — State Benchmarked 26% of residents are 95 or older, compared to the Maryland average of 16%. A high proportion of the oldest-old suggests strong end-of-life care experience and very-high-acuity capabilities. |
| Lutheran Village at Miller’s Grant | IL AL NH SNF | Ellicott City (Lutheran Village At Miller’s Grant) | 36
Facility
36
MD AVG
43
Rank
#237 / 690 | Yes |
19
Facility
19
MD AVG
43
Rank
#746 / 985 | 1 Bed / 2 Bed | 21
Facility
21
MD AVG
21
Rank
#108 / 210 | - |
17% Male Residents — State Benchmarked 17% of residents are male, compared to the Maryland average of 31%. This facility caters to a majority female resident pool (83% female), consistent with the broader assisted living trend where women significantly outnumber men. |
83% Female Residents — State Benchmarked 83% of residents are female, compared to the Maryland average of 69%. Women comprise the large majority, consistent with national assisted living demographics where women live longer and enter care facilities at higher rates. |
83% White Residents — State Benchmarked 83% of residents are reported as White, compared to the Maryland average of 81%. Close to the average for this category among assisted living facilities in Maryland with reported race/ethnicity data. |
11% African American Residents — State Benchmarked 11% of residents are reported as African American or Black, compared to the Maryland average of 13%. In line with the Maryland average for African American residents among facilities reporting this breakdown. |
6% Other Ethnicity Residents — State Benchmarked 6% of residents fall into categories other than White or African American (combined), compared to the Maryland average of 6%. This column aggregates Hispanic, Asian, multiracial, and any other labeled groups that are not classified as White or African American. Reported subgroups in this total: Asian (6%). | - |
33% Residents Age 75–84 — State Benchmarked 33% of residents are 75–84, compared to the Maryland average of 31%. This is the second most common age bracket in assisted living, representing residents with moderate care needs. |
44% Residents Age 85–94 — State Benchmarked 44% of residents are 85–94, compared to the Maryland average of 44%. This is typically the most common age bracket in assisted living — this facility is in line with the statewide norm. |
22% Residents Age 95+ — State Benchmarked 22% of residents are 95 or older, compared to the Maryland average of 16%. A high proportion of the oldest-old suggests strong end-of-life care experience and very-high-acuity capabilities. |
| Residences at Vantage Point | IL AL HC MC NH SNF | Columbia (Town Center) | 44
Facility
44
MD AVG
43
Rank
#229 / 690 | Yes |
52
Facility
52
MD AVG
43
Rank
#402 / 985 | Studio / 1 Bed / 2 Bed | 36
Facility
36
MD AVG
21
Rank
#16 / 210 | - | - | - | - | - | - | - | - | - | - |
| Maplewood Park Place | IL AL MC NH SNF | Bethesda (Pooks Hill) | 29
Facility
29
MD AVG
43
Rank
#247 / 690 | Yes |
38
Facility
38
MD AVG
43
Rank
#542 / 985 | 1 Bed / 2 Bed | 30
Facility
30
MD AVG
21
Rank
#44 / 210 | - |
18% Male Residents — State Benchmarked 18% of residents are male, compared to the Maryland average of 31%. This facility caters to a majority female resident pool (82% female), consistent with the broader assisted living trend where women significantly outnumber men. |
82% Female Residents — State Benchmarked 82% of residents are female, compared to the Maryland average of 69%. Women comprise the large majority, consistent with national assisted living demographics where women live longer and enter care facilities at higher rates. |
100% White Residents — State Benchmarked 100% of residents are reported as White, compared to the Maryland average of 81%. A higher White share than is typical for assisted living in Maryland in this dataset — compare with peer facilities for local context. |
0% African American Residents — State Benchmarked 0% of residents are reported as African American or Black, compared to the Maryland average of 13%. A lower African American share than is typical in Maryland; local markets still vary widely. |
0% Other Ethnicity Residents — State Benchmarked 0% of residents fall into categories other than White or African American (combined), compared to the Maryland average of 6%. This column aggregates Hispanic, Asian, multiracial, and any other labeled groups that are not classified as White or African American. | - |
6% Residents Age 75–84 — State Benchmarked 6% of residents are 75–84, compared to the Maryland average of 31%. Below the state norm — the resident mix may skew either younger or older than this typical middle bracket. |
24% Residents Age 85–94 — State Benchmarked 24% of residents are 85–94, compared to the Maryland average of 44%. The population here skews younger than the statewide norm, which may indicate a more active, lower-acuity community. |
71% Residents Age 95+ — State Benchmarked 71% of residents are 95 or older, compared to the Maryland average of 16%. A high proportion of the oldest-old suggests strong end-of-life care experience and very-high-acuity capabilities. |
| Friends House Retirement Community | IL AL NH SNF | Sandy Spring | 24
Facility
24
MD AVG
43
Rank
#249 / 690 | No |
6
Facility
6
MD AVG
43
Rank
#891 / 985 | - | 20
Facility
20
MD AVG
21
Rank
#112 / 210 | - |
6% Male Residents — State Benchmarked 6% of residents are male, compared to the Maryland average of 31%. This facility caters to a majority female resident pool (94% female), consistent with the broader assisted living trend where women significantly outnumber men. |
94% Female Residents — State Benchmarked 94% of residents are female, compared to the Maryland average of 69%. Women comprise the large majority, consistent with national assisted living demographics where women live longer and enter care facilities at higher rates. |
94% White Residents — State Benchmarked 94% of residents are reported as White, compared to the Maryland average of 81%. A higher White share than is typical for assisted living in Maryland in this dataset — compare with peer facilities for local context. |
0% African American Residents — State Benchmarked 0% of residents are reported as African American or Black, compared to the Maryland average of 13%. A lower African American share than is typical in Maryland; local markets still vary widely. |
6% Other Ethnicity Residents — State Benchmarked 6% of residents fall into categories other than White or African American (combined), compared to the Maryland average of 6%. This column aggregates Hispanic, Asian, multiracial, and any other labeled groups that are not classified as White or African American. Reported subgroups in this total: Asian (6%). |
6% Residents Age 65–74 — State Benchmarked 6% of residents are 65–74, compared to the Maryland average of 13%. Fewer younger seniors suggests the resident population skews older, likely requiring higher acuity care and more hands-on support. |
18% Residents Age 75–84 — State Benchmarked 18% of residents are 75–84, compared to the Maryland average of 31%. Below the state norm — the resident mix may skew either younger or older than this typical middle bracket. |
53% Residents Age 85–94 — State Benchmarked 53% of residents are 85–94, compared to the Maryland average of 44%. A high concentration of very elderly residents signals a higher-acuity facility with experience caring for advanced age-related needs. |
24% Residents Age 95+ — State Benchmarked 24% of residents are 95 or older, compared to the Maryland average of 16%. A high proportion of the oldest-old suggests strong end-of-life care experience and very-high-acuity capabilities. |
| Revitz House | IL AL HC MC NH SNF | Rockville | 558
Facility
558
MD AVG
43
Rank
#1 / 690 | Yes |
81
Facility
81
MD AVG
43
Rank
#86 / 985 | 1 Bed | - | - | - | - | - | - | - | - | - | - | - |
| Broadmead | IL AL MC NH RC SNF | Cockeysville | 40
Facility
40
MD AVG
43
Rank
#233 / 690 | No |
0
Facility
0
MD AVG
43
Rank
#959 / 985 | - | 47
Facility
47
MD AVG
21
Rank
#3 / 210 | A+ | - | - | - | - | - | - | - | - | - |
| Blakehurst (Chestnut Green) | IL AL MC NH SNF | Towson | 35
Facility
35
MD AVG
43
Rank
#239 / 690 | No |
10
Facility
10
MD AVG
43
Rank
#837 / 985 | - | 33
Facility
33
MD AVG
21
Rank
#25 / 210 | - | - | - | - | - | - | - | - | - | - |
| Asbury Methodist Village | IL AL MC NH SNF | Gaithersburg (Russell Avenue) | 164
Facility
164
MD AVG
43
Rank
#26 / 690 | Yes |
41
Facility
41
MD AVG
43
Rank
#508 / 985 | - | 27
Facility
27
MD AVG
21
Rank
#62 / 210 | - |
21% Male Residents — State Benchmarked 21% of residents are male, compared to the Maryland average of 31%. This facility caters to a majority female resident pool (79% female), consistent with the broader assisted living trend where women significantly outnumber men. |
79% Female Residents — State Benchmarked 79% of residents are female, compared to the Maryland average of 69%. Women comprise the large majority, consistent with national assisted living demographics where women live longer and enter care facilities at higher rates. |
92% White Residents — State Benchmarked 92% of residents are reported as White, compared to the Maryland average of 81%. A higher White share than is typical for assisted living in Maryland in this dataset — compare with peer facilities for local context. |
1% African American Residents — State Benchmarked 1% of residents are reported as African American or Black, compared to the Maryland average of 13%. A lower African American share than is typical in Maryland; local markets still vary widely. |
7% Other Ethnicity Residents — State Benchmarked 7% of residents fall into categories other than White or African American (combined), compared to the Maryland average of 6%. This column aggregates Hispanic, Asian, multiracial, and any other labeled groups that are not classified as White or African American. Reported subgroups in this total: Asian (7%). |
1% Residents Age 65–74 — State Benchmarked 1% of residents are 65–74, compared to the Maryland average of 13%. Fewer younger seniors suggests the resident population skews older, likely requiring higher acuity care and more hands-on support. |
21% Residents Age 75–84 — State Benchmarked 21% of residents are 75–84, compared to the Maryland average of 31%. Below the state norm — the resident mix may skew either younger or older than this typical middle bracket. |
48% Residents Age 85–94 — State Benchmarked 48% of residents are 85–94, compared to the Maryland average of 44%. This is typically the most common age bracket in assisted living — this facility is in line with the statewide norm. |
30% Residents Age 95+ — State Benchmarked 30% of residents are 95 or older, compared to the Maryland average of 16%. A high proportion of the oldest-old suggests strong end-of-life care experience and very-high-acuity capabilities. |
| Ginger Cove | IL AL HC MC NH SNF | Annapolis (River Crescent Drive) | 96
Facility
96
MD AVG
43
Rank
#136 / 690 | No |
51
Facility
51
MD AVG
43
Rank
#413 / 985 | 1 Bed / 2 Bed | 42
Facility
42
MD AVG
21
Rank
#8 / 210 | A+ |
40% Male Residents — State Benchmarked 40% of residents are male, compared to the Maryland average of 31%. A relatively balanced gender mix for assisted living, where facilities typically skew heavily female. |
60% Female Residents — State Benchmarked 60% of residents are female, compared to the Maryland average of 69%. Closer to an even gender split than most assisted living facilities, which typically have 65–75% female residents. |
100% White Residents — State Benchmarked 100% of residents are reported as White, compared to the Maryland average of 81%. A higher White share than is typical for assisted living in Maryland in this dataset — compare with peer facilities for local context. |
0% African American Residents — State Benchmarked 0% of residents are reported as African American or Black, compared to the Maryland average of 13%. A lower African American share than is typical in Maryland; local markets still vary widely. |
0% Other Ethnicity Residents — State Benchmarked 0% of residents fall into categories other than White or African American (combined), compared to the Maryland average of 6%. This column aggregates Hispanic, Asian, multiracial, and any other labeled groups that are not classified as White or African American. | - |
13% Residents Age 75–84 — State Benchmarked 13% of residents are 75–84, compared to the Maryland average of 31%. Below the state norm — the resident mix may skew either younger or older than this typical middle bracket. |
64% Residents Age 85–94 — State Benchmarked 64% of residents are 85–94, compared to the Maryland average of 44%. A high concentration of very elderly residents signals a higher-acuity facility with experience caring for advanced age-related needs. |
22% Residents Age 95+ — State Benchmarked 22% of residents are 95 or older, compared to the Maryland average of 16%. A high proportion of the oldest-old suggests strong end-of-life care experience and very-high-acuity capabilities. |
| Charlestown Community | IL NH | Baltimore | 238
Facility
238
MD AVG
43
Rank
#5 / 690 | No |
36
Facility
36
MD AVG
43
Rank
#563 / 985 | - | 35
Facility
35
MD AVG
21
Rank
#18 / 210 | - | - | - | - | - | - | - | - | - | - |
| Pickersgill Retirement Community | IL AL NH SNF | Baltimore (Chestnut Hill) | 138
Facility
138
MD AVG
43
Rank
#56 / 690 | No |
45
Facility
45
MD AVG
43
Rank
#475 / 985 | - | - | A+ |
24% Male Residents — State Benchmarked 24% of residents are male, compared to the Maryland average of 31%. This facility caters to a majority female resident pool (76% female), consistent with the broader assisted living trend where women significantly outnumber men. |
76% Female Residents — State Benchmarked 76% of residents are female, compared to the Maryland average of 69%. Women comprise the large majority, consistent with national assisted living demographics where women live longer and enter care facilities at higher rates. |
95% White Residents — State Benchmarked 95% of residents are reported as White, compared to the Maryland average of 81%. A higher White share than is typical for assisted living in Maryland in this dataset — compare with peer facilities for local context. |
1% African American Residents — State Benchmarked 1% of residents are reported as African American or Black, compared to the Maryland average of 13%. A lower African American share than is typical in Maryland; local markets still vary widely. |
4% Other Ethnicity Residents — State Benchmarked 4% of residents fall into categories other than White or African American (combined), compared to the Maryland average of 6%. This column aggregates Hispanic, Asian, multiracial, and any other labeled groups that are not classified as White or African American. Reported subgroups in this total: Asian (4%). |
3% Residents Age 65–74 — State Benchmarked 3% of residents are 65–74, compared to the Maryland average of 13%. Fewer younger seniors suggests the resident population skews older, likely requiring higher acuity care and more hands-on support. |
27% Residents Age 75–84 — State Benchmarked 27% of residents are 75–84, compared to the Maryland average of 31%. This is the second most common age bracket in assisted living, representing residents with moderate care needs. |
55% Residents Age 85–94 — State Benchmarked 55% of residents are 85–94, compared to the Maryland average of 44%. A high concentration of very elderly residents signals a higher-acuity facility with experience caring for advanced age-related needs. |
15% Residents Age 95+ — State Benchmarked 15% of residents are 95 or older, compared to the Maryland average of 16%. In line with the statewide profile for the oldest resident bracket. |
Rows per page:

View all Nearby Homes
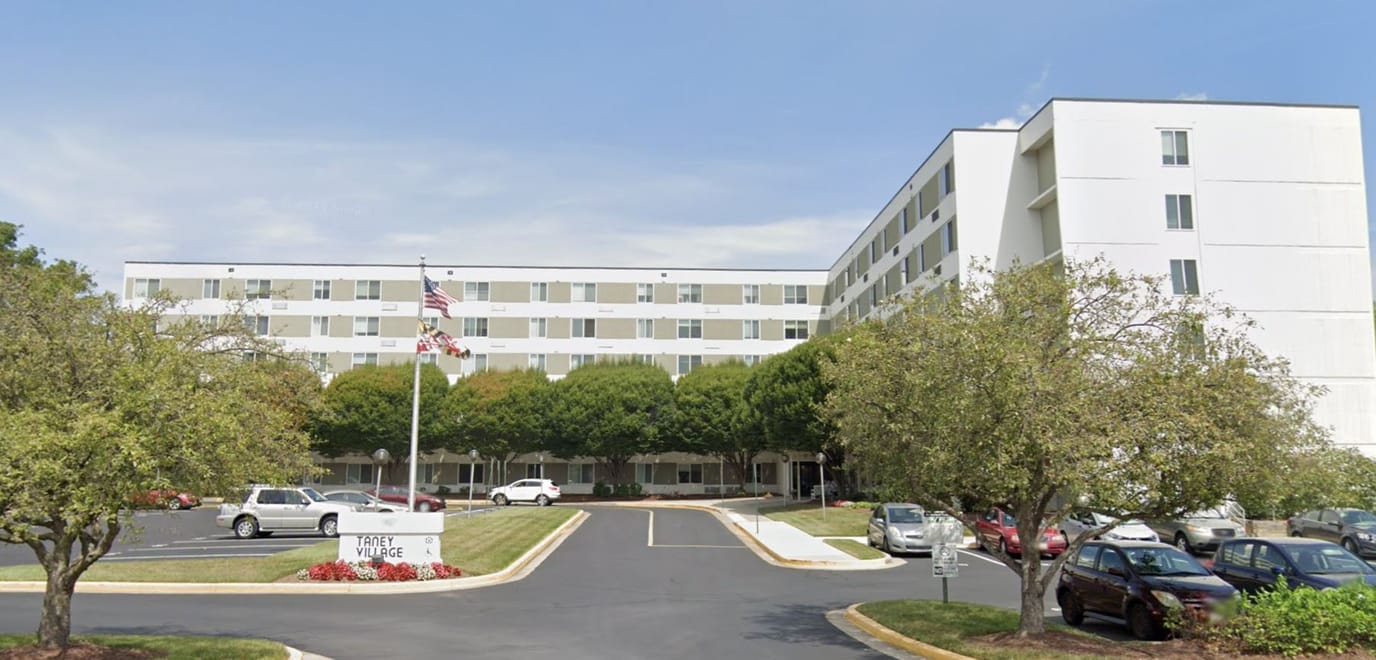
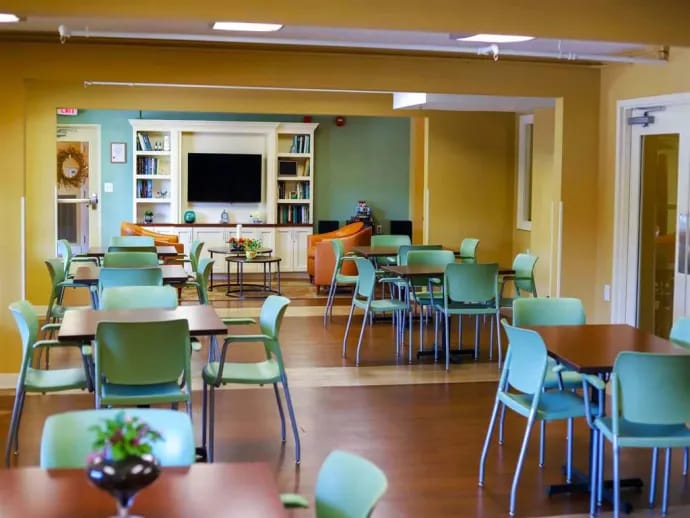
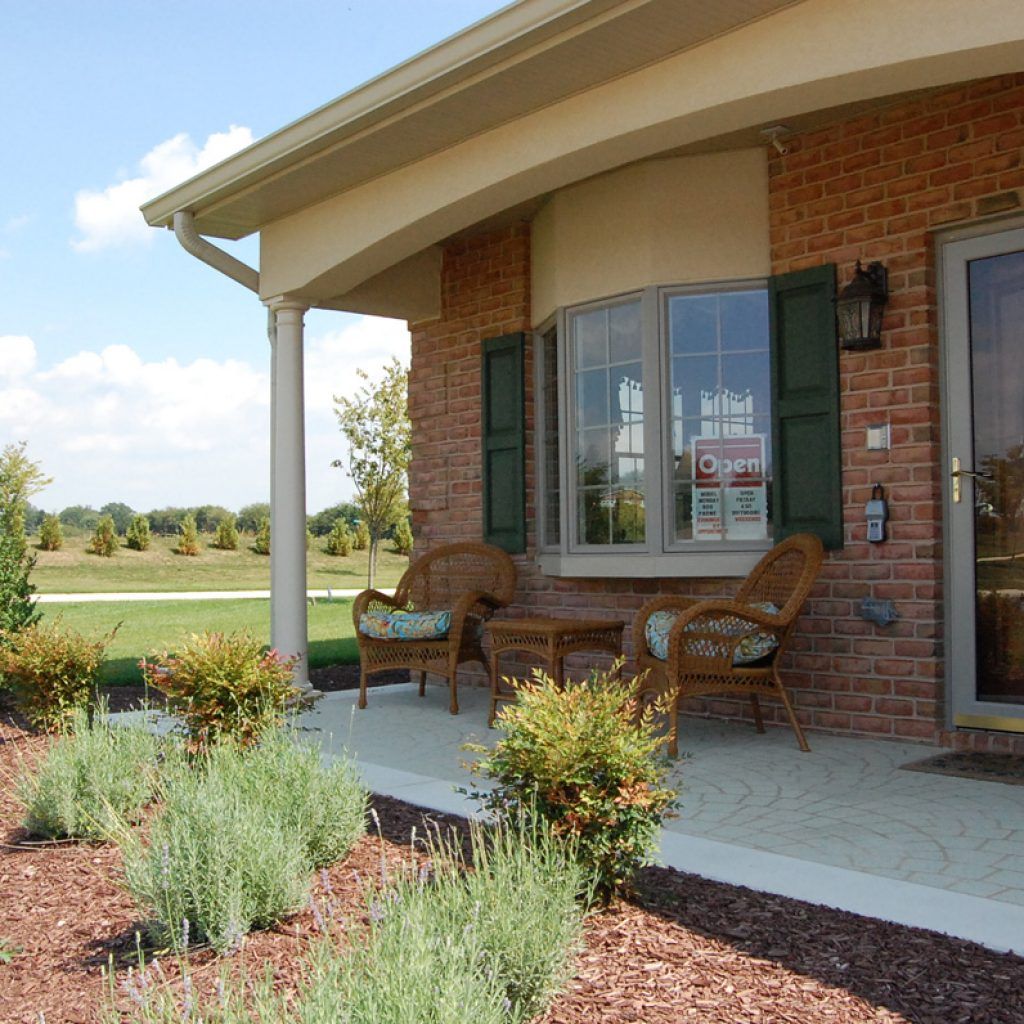
A retirement home catered to 62+ seniors, Taney Village strives to make a positive impact in the lives of each resident; they are ready to attend to any needs an individual may have. The staff encourages residents to take part in enriching and engaging activities that cultivate their personal growth during their golden years. The vibrant community offers a home-like atmosphere that can provide all the essential benefits for its residents, as they make it a point to enhance the lifestyle of every resident and elevate their daily living.
Taney Village residents can enjoy seamless access to living spaces like a lounge room, fitness center, dining area, and outdoor common areas. Other services include essential housekeeping, laundry, and transportation, medication management, and recreational activities.
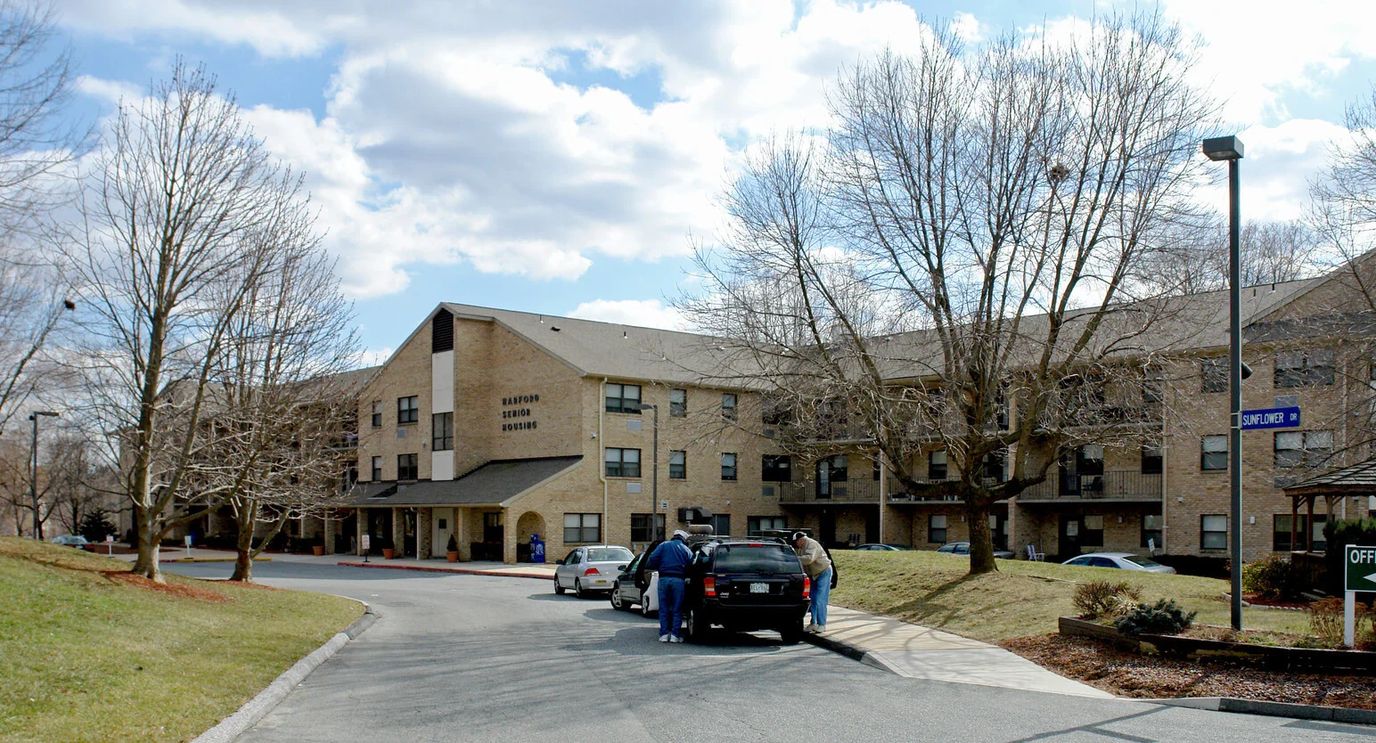
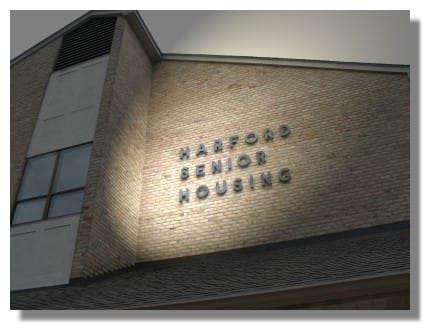
Conveniently located near UM Upper Chesapeake Medical Center Bel Air in Bel Air, MD, Harford Senior Housing is an exceptional community that offers independent living. The community features cozy and thoughtfully furnished studio and one-bedroom floor plans, ensuring residents’ comfort and safety. Maintenance is also taken care of, providing residents with more time to do the things they love.
Residents can spend their days as they please, with plenty of communal spaces that promote an active lifestyle and social interactions. With delightful restaurants and shops nearby, residents can prepare meals based on their dietary needs and preferences. Amenities include a library, a community room, a picnic area, a beauty salon, gardens, and a serene walking path.
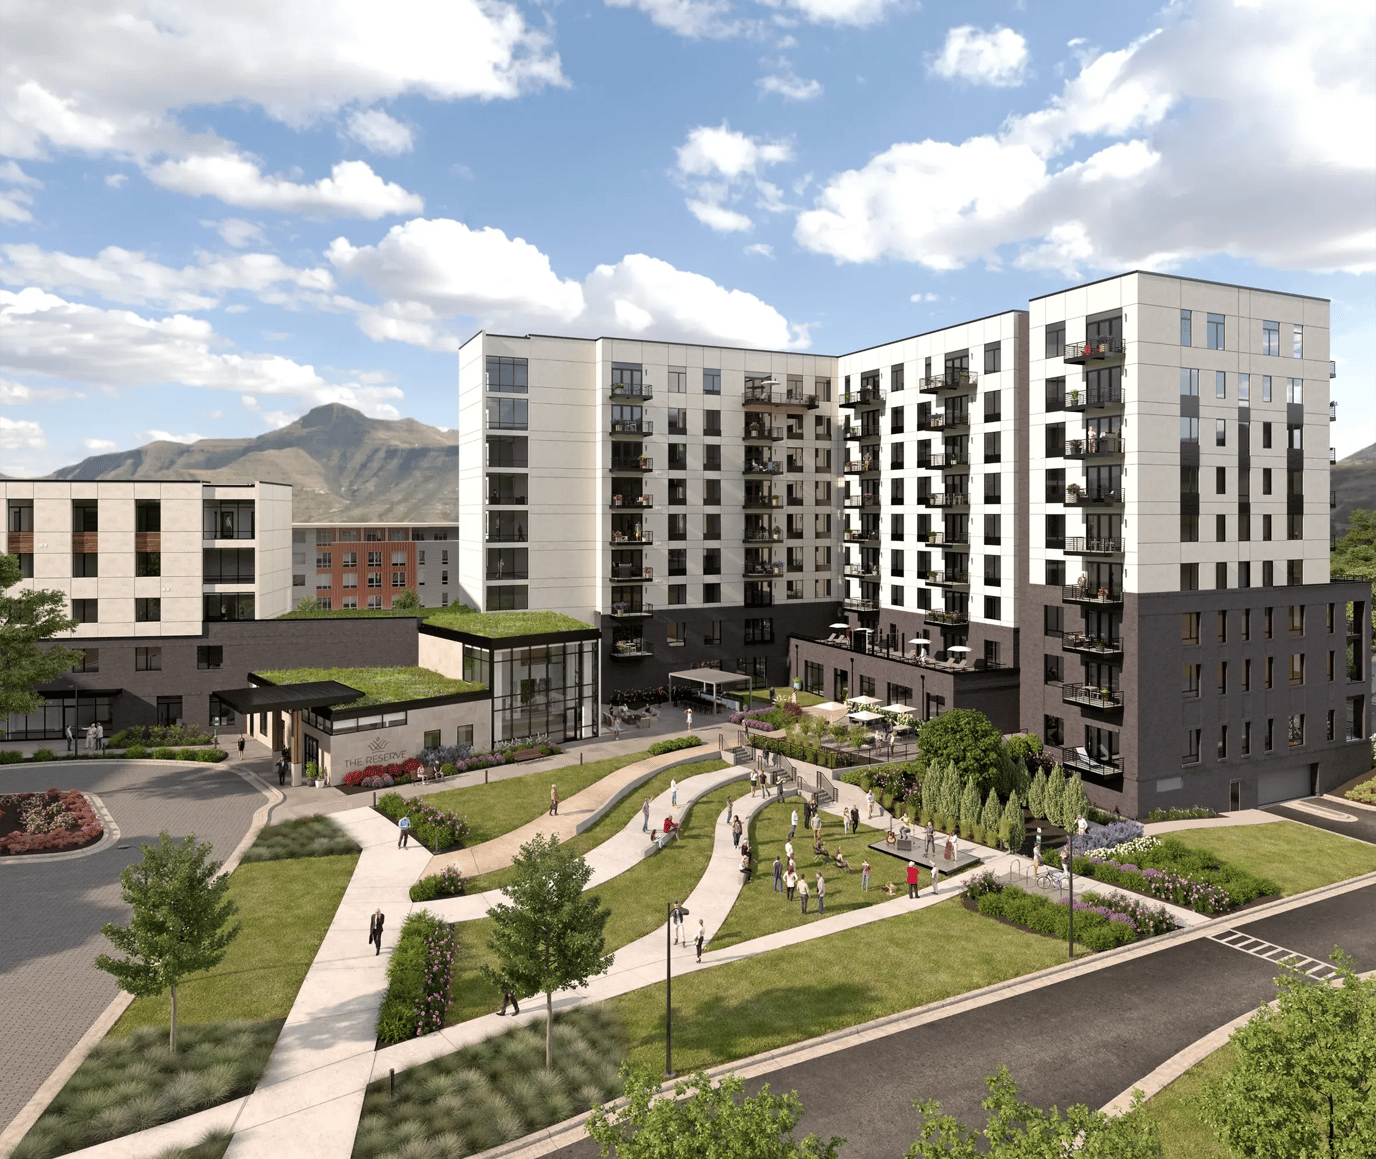
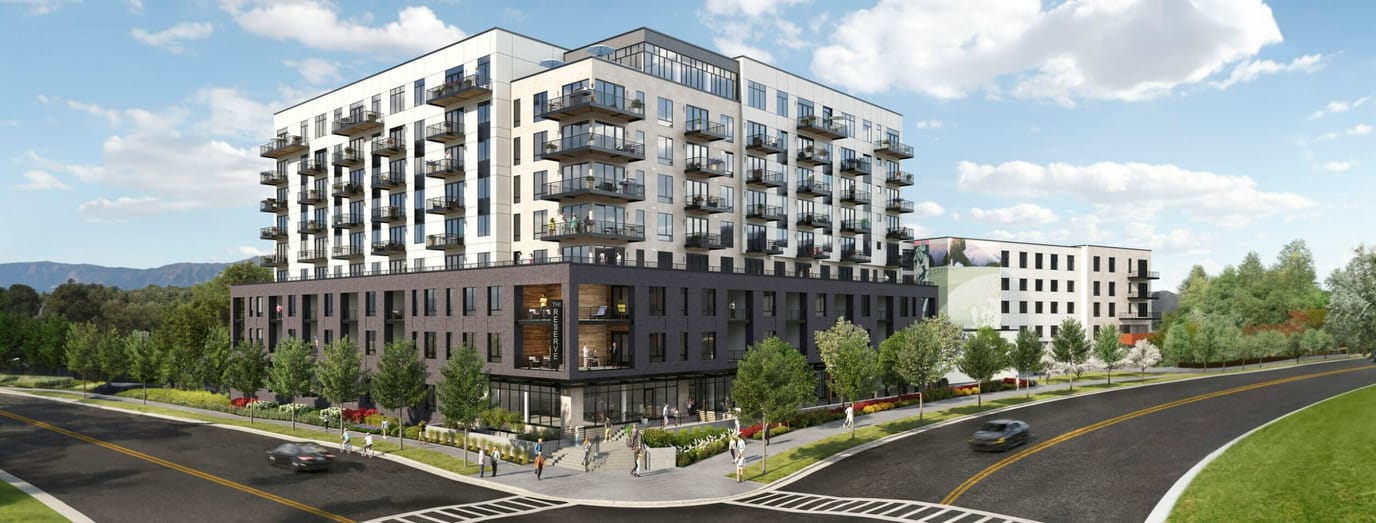
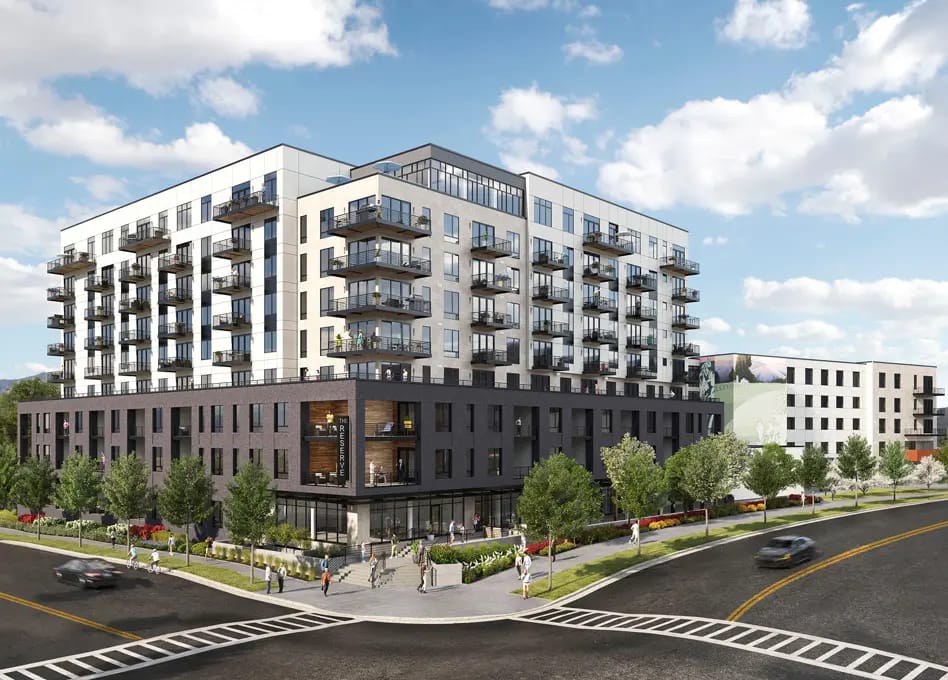
Welcome to The Reserve at Strathmore Square, a premier senior living community currently in development in the heart of Bethesda, Maryland. Designed to cater to a range of lifestyle needs, including Independent Living, Assisted Living, and Memory Care, our community will offer a serene and vibrant environment for all residents.
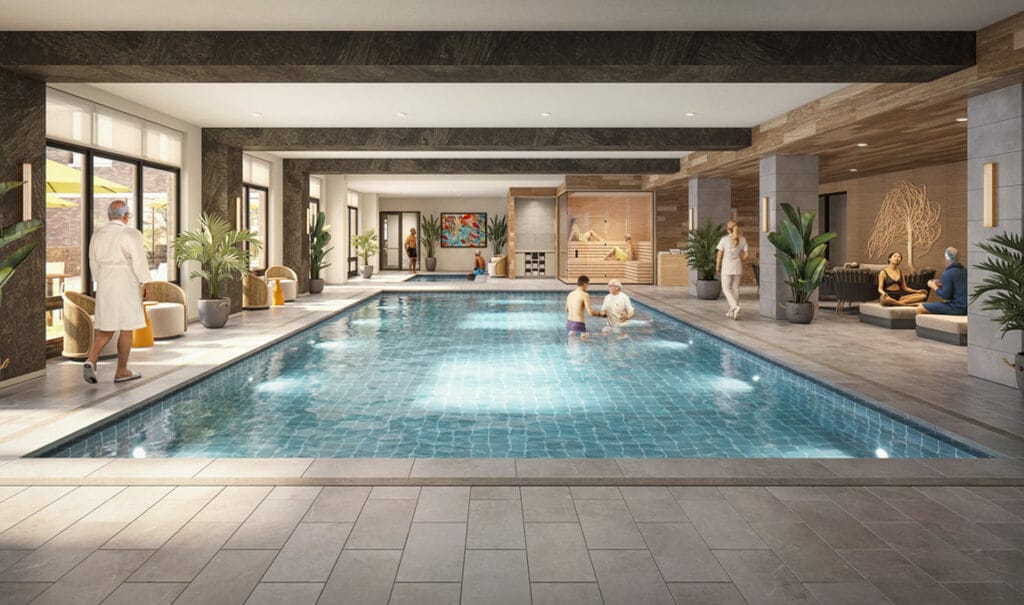
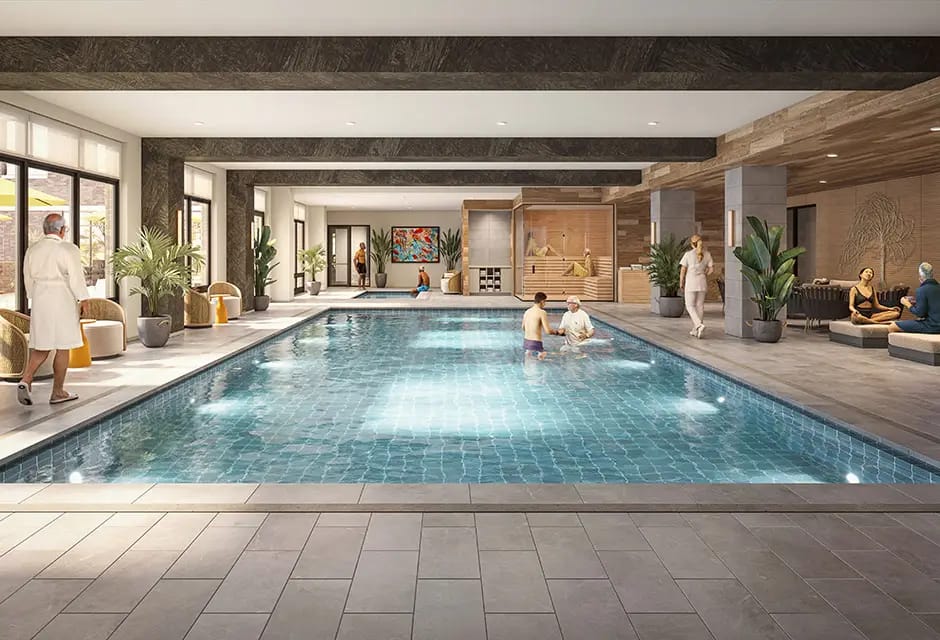
At The Reserve at Strathmore Square, we pride ourselves on delivering exceptional care and an enriching lifestyle. Residents will enjoy elegant dining with certified-organic gourmet meals prepared by our culinary team. Comprehensive fitness and wellness programs tailored to meet individual needs will be available, along with a dynamic calendar of social, cultural, and educational activities designed to engage and inspire. Personalized concierge services will make daily living convenient and enjoyable, while lush landscaping and serene outdoor spaces provide the perfect setting for relaxation and recreation. Our spacious, well-appointed apartments will be designed for comfort and style, and professional, compassionate staff will be available around the clock to ensure peace of mind. Other amenities include an indoor, saltwater pool and electric vehicle transportation services.
Our prime location offers easy access to a wealth of nearby attractions. Just minutes away, residents will find the renowned Strathmore Music Center, where they can enjoy world-class performances and cultural events. Additionally, the vibrant shopping and dining destinations of Bethesda are within close reach, providing endless opportunities for exploration and enjoyment.
Stay tuned for more information as we develop The Reserve at Strathmore Square. Experience the perfect blend of luxury, care, and community, and discover a place where you can live life to the fullest, surrounded by comfort, elegance, and a supportive community.
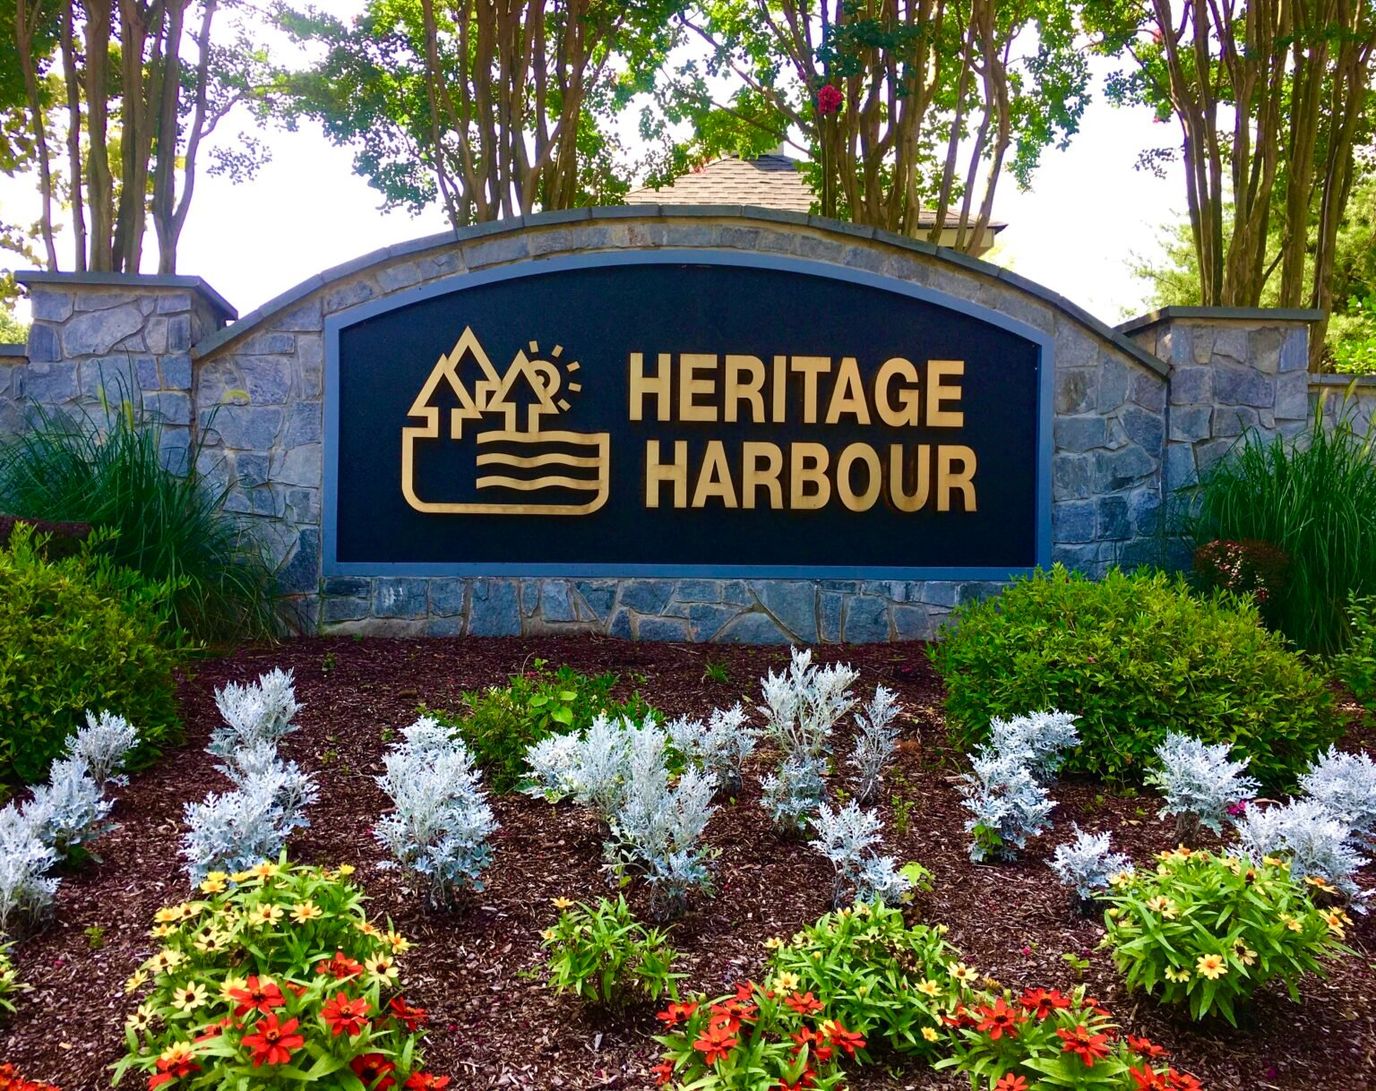
In the heart of Annapolis, Maryland, Heritage Harbour is a well-established assisted living community, offering an array of home options suitable for various senior lifestyles. This vibrant community caters to active retirees, providing an extensive range of resale single-family homes, duplexes, townhomes, and condos, ensuring a perfect fit for senior residents from all backgrounds. Heritage Harbour’s allure is further enhanced by its appealing location, boasting a four-season climate and convenient proximity to the nation’s capital.
The expansive community clubhouse serves as a hub of activity, offering a plethora of amenities for social engagement and relaxation. Residents also benefit from the community van, facilitating day trips and shopping excursions, while a diverse array of special interest groups cater to various preferences, fostering a vibrant and enriching living experience. Spanning 1,683 residences, this pet-friendly community exudes a welcoming atmosphere and features a 9-hole executive golf course, inviting residents to enjoy leisurely rounds amidst picturesque surroundings.
Experience the serene charm of Emerald Pointe, a vibrant senior living community crafted for mature professionals, retirees, and active adults seeking a peaceful yet engaging lifestyle. Situated in a convenient and scenic part of Hagerstown, MD, the community offers a selection of custom-built homes with four unique floor plans all designed to provide comfort and a sense of personal space. With craftsmanship by Paul Crampton Contractors, a trusted name since 1967, residents can trust in the quality, comfort, and enduring value of their new homes.
Emerald Pointe prides itself on providing a vibrant community experience with a focus on maintenance-free living. Residents can enjoy a welcoming atmosphere surrounded by like-minded neighbors, along with a variety of community features, including scenic walking paths and recreational spaces for relaxation and socializing. Here, homeowners can embrace a lifestyle filled with warmth, ease, and a sense of belonging in Hagerstown’s most sought-after active adult community.
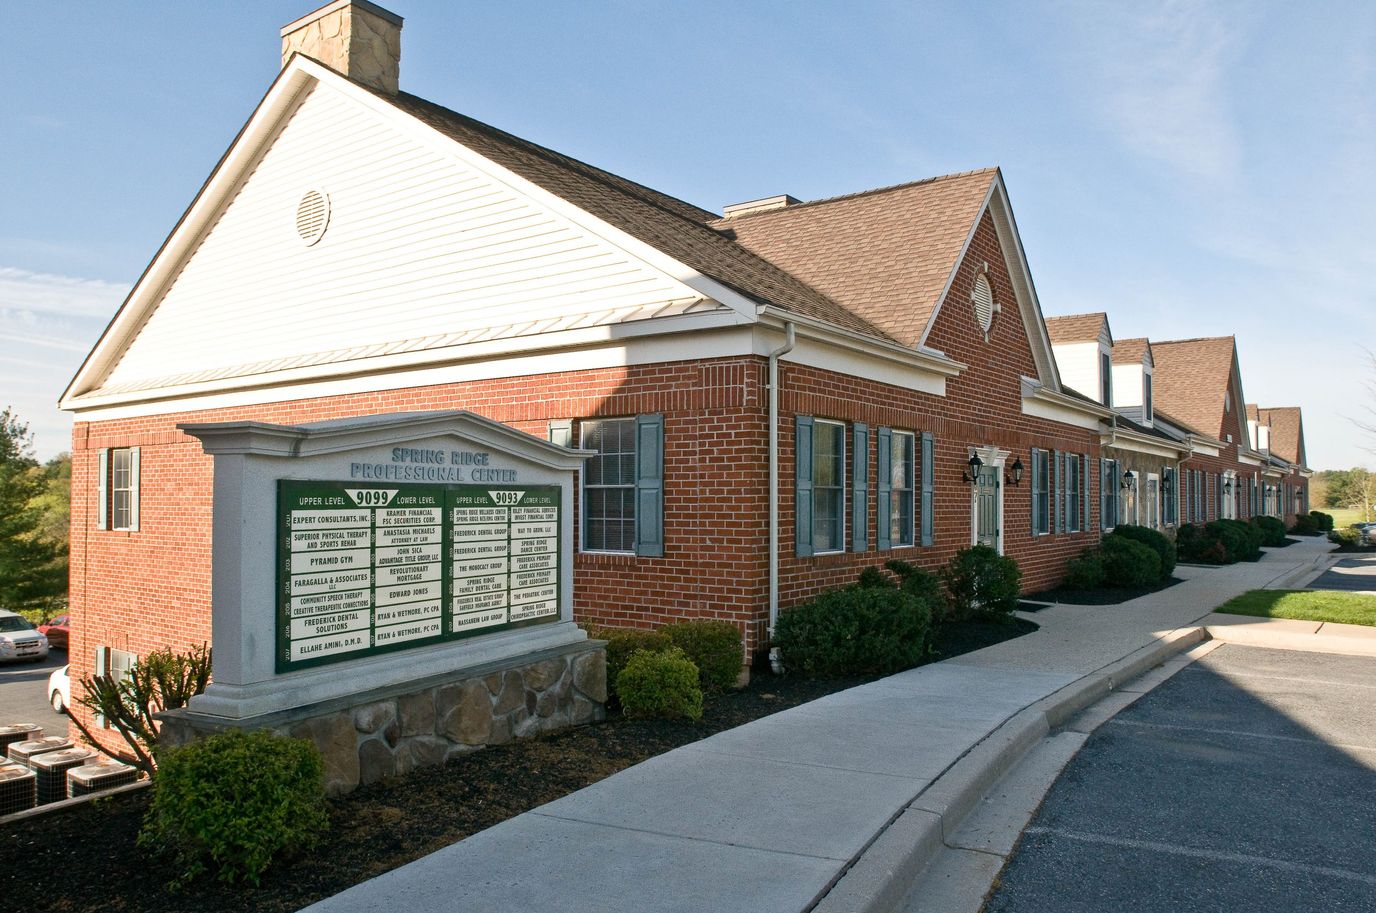
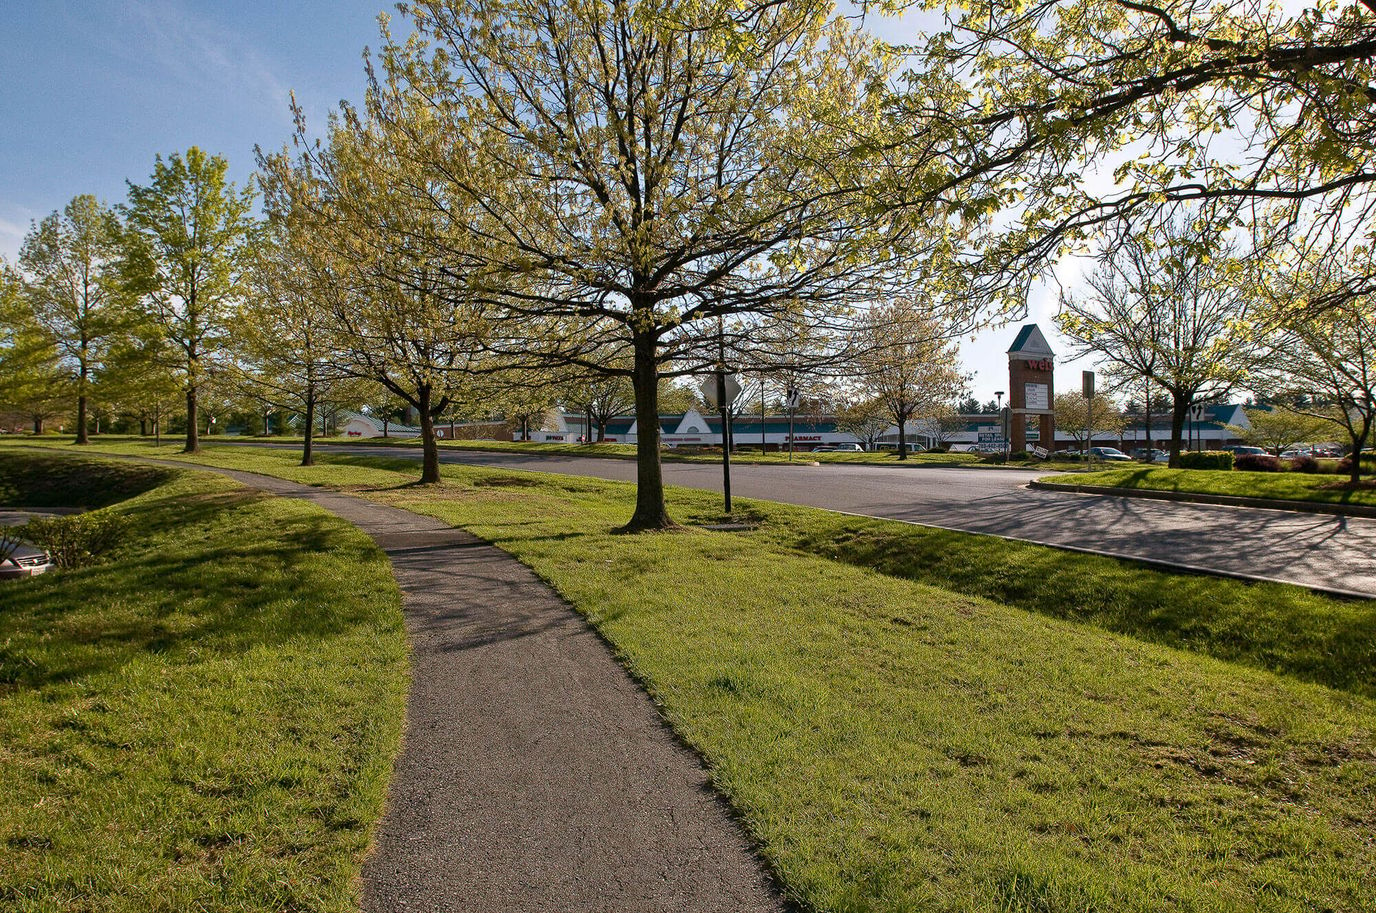
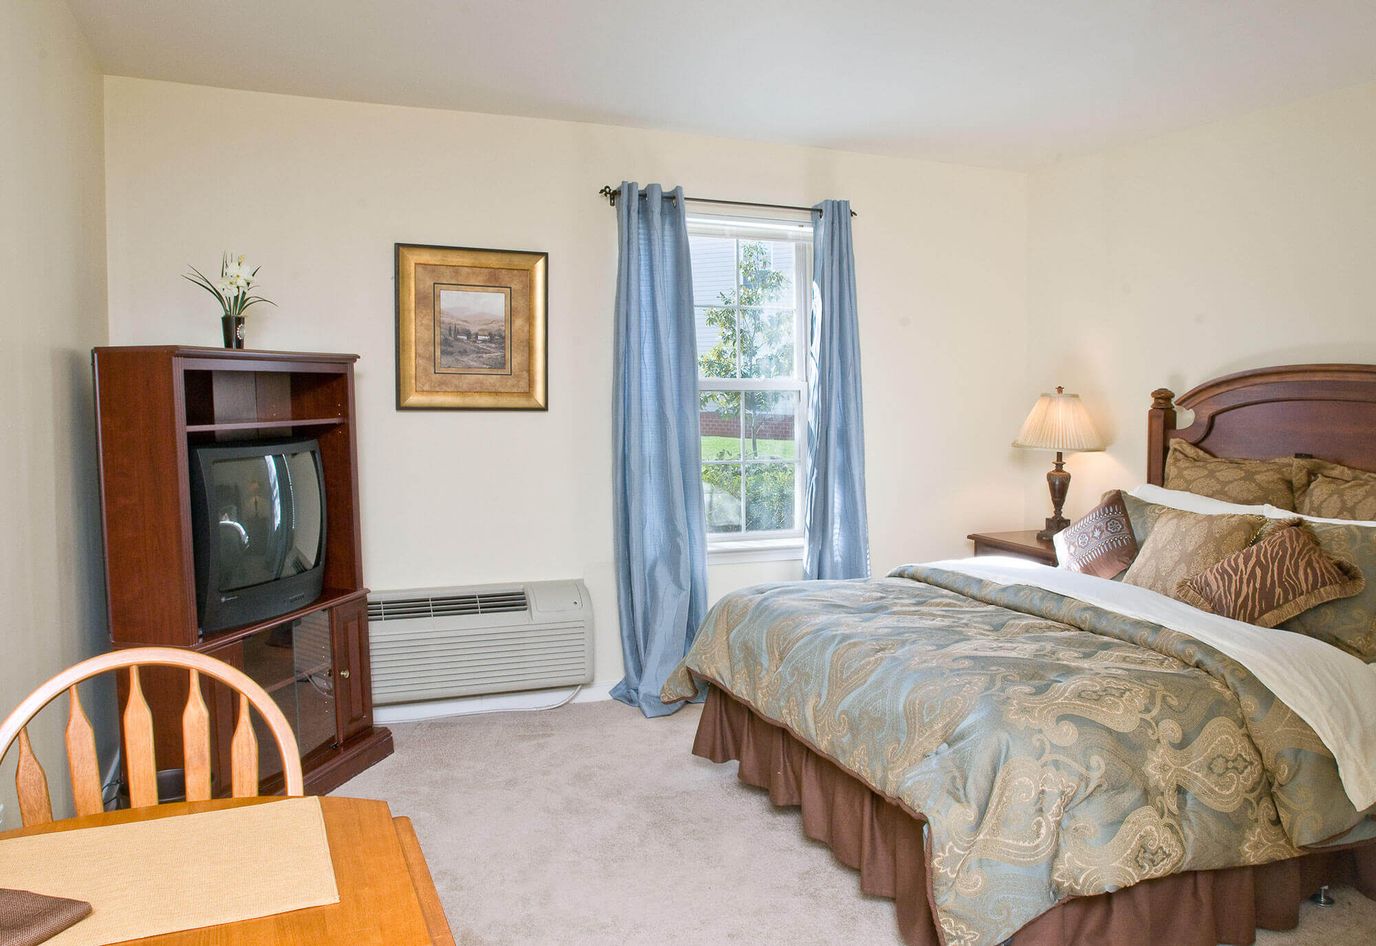
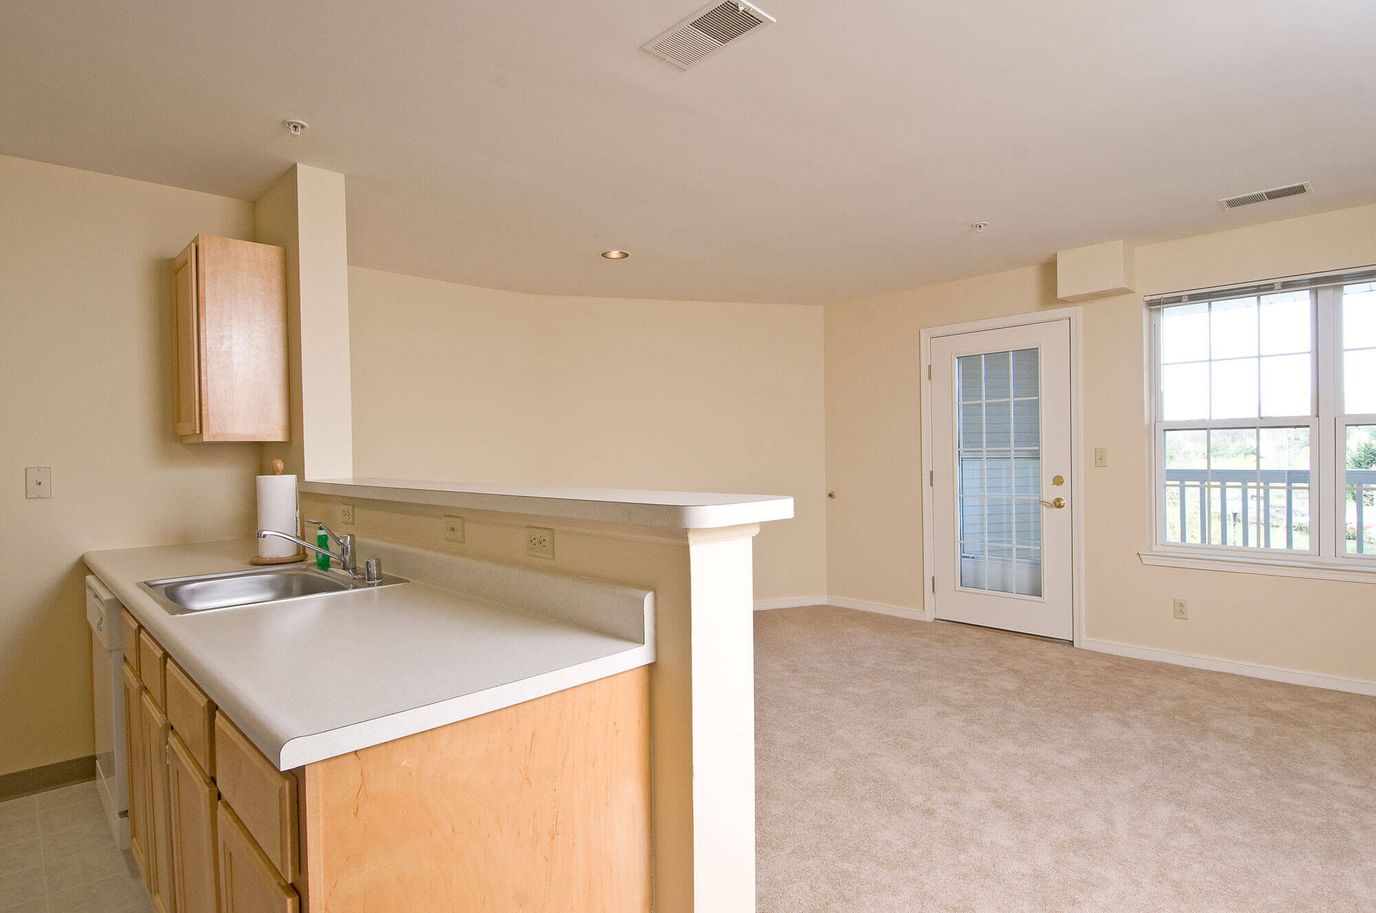
Spring Ridge is an exquisite senior living community that boasts resort-style living in a modern apartment complex exclusively for 62+ seniors. The retirement home encourages its seniors to maintain independence while receiving exceptional care from compassionate staff. The compassionate staff truly cares about its residents and families by creating a welcoming and comfortable environment that helps residents feel more comfortable.
Spring Ridge provides a list of comprehensive amenities and services that help make the lives of its residents hassle-free, including 24-hour licensed supervision, medication services, balanced meals provided, engaging activities scheduled, and a full-service salon available.
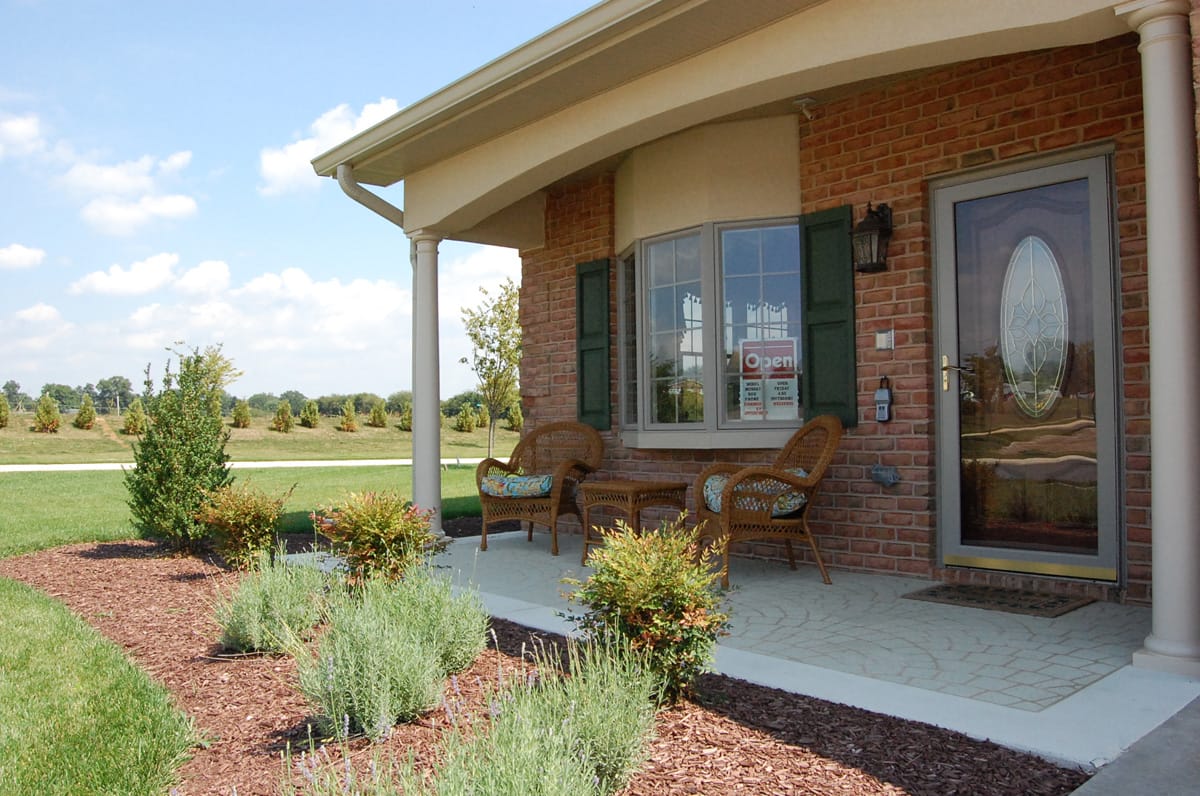
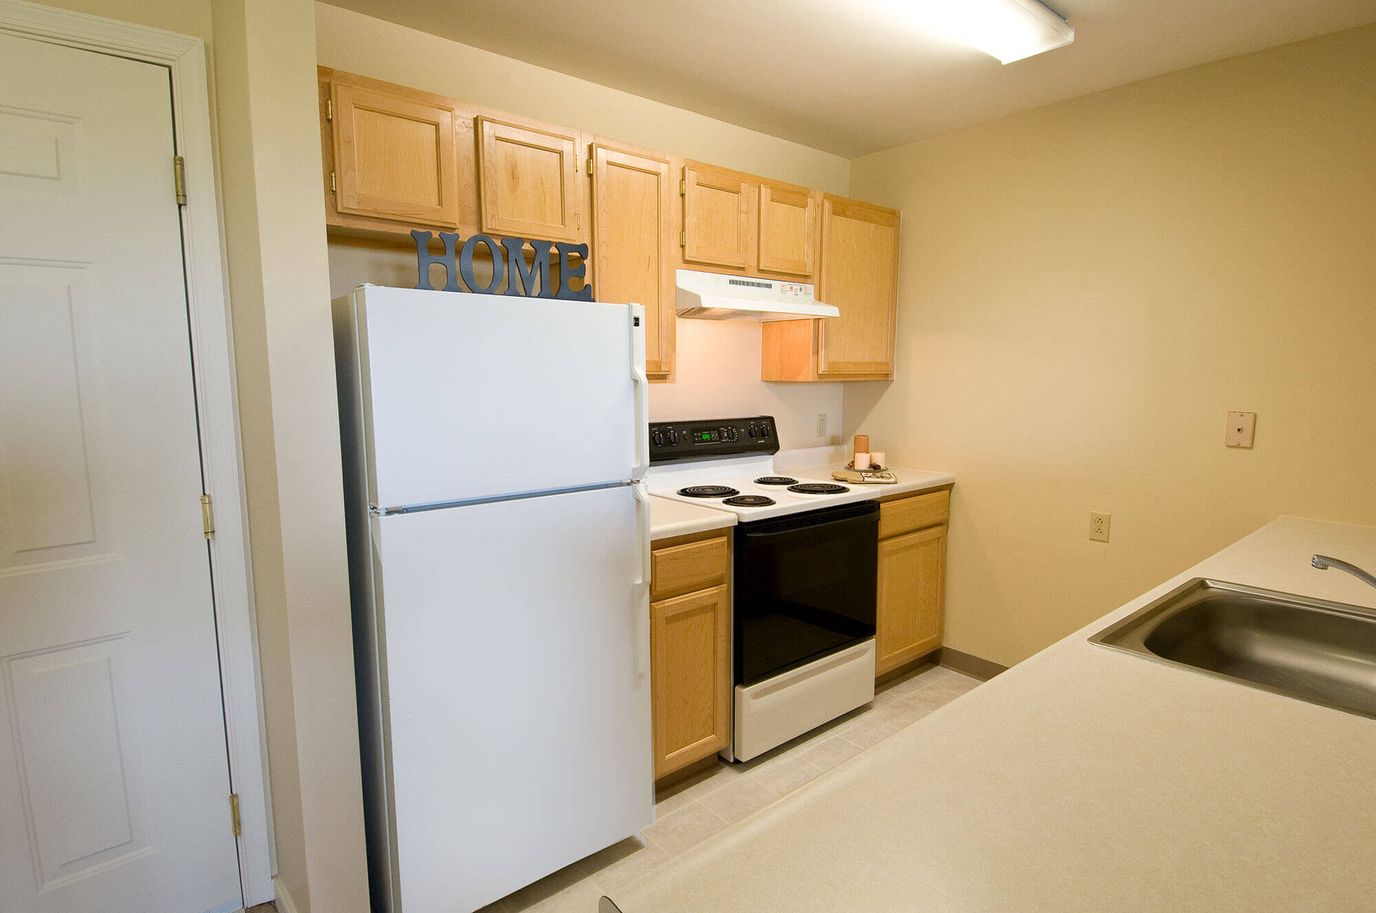
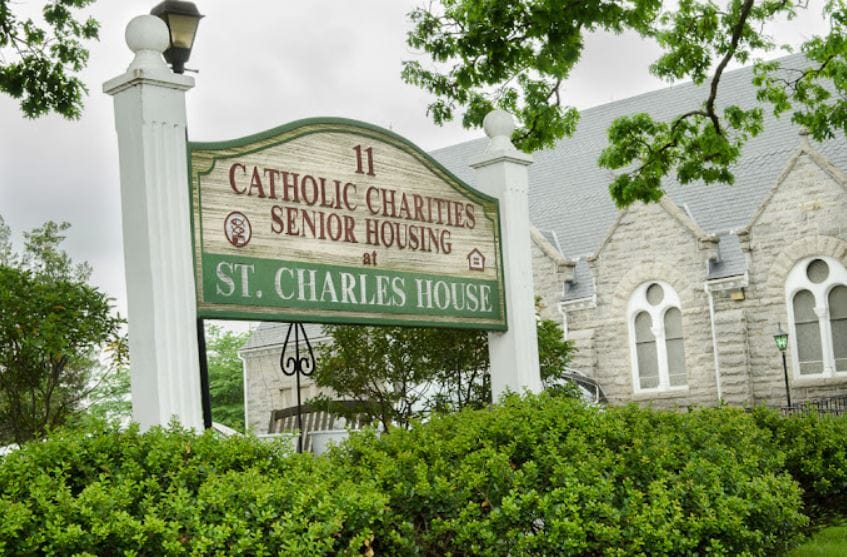
St. Charles House Apartments is an affordable independent living community in Pikesville, MD, that features 24 thoughtfully designed one-bedroom apartments. The community also promotes a warm and inviting environment, ensuring older adults can find a home away from home. With a personal emergency response system, service coordination, and wellness programs, residents can maintain their independence without worries. As a Catholic Charities Senior Community, the community focuses on residents’ comfort and safety.
Educational activities and exercise classes provide residents with more options to spend their days and gain meaningful experiences. With a multipurpose room and an outdoor patio, residents can rest comfortably. Located near parks, restaurants, and shops in Pikesville, the community guarantees accessibility and convenience. This independent living community has thoughtfully furnished amenities and high-quality services, making it one of the best options for senior living in Maryland.
Located on University Boulevard in Silver Spring, Maryland, University Gardens I and II is an assisted living community. It’s situated in the Montgomery Knolls neighborhood with a Walk Score of 56. Some errands can be accomplished on foot, but most trips will require a short drive.
Assisted living communities like this assist with everyday activities like bathing, dressing, medication management, and meals. These allow residents to maintain as much independence as they are able. The residential setting creates a calmer, more personal atmosphere for families than larger senior living communities.
Families considering University Gardens I and II should take a tour to get the best sense of the community’s environment, room options, daily activities, and amenities. Touring allows them to ask specific questions about services, pricing, and care options.
Advent Home Assisted Living is an assisted living community in Clinton, MD, offering assistance with daily living activities. With an intimate, home-like setting, the community ensures older adults receive the utmost attention to live comfortably during their stay. Home-cooked meals, 24-hour supervision, transportation arrangements to medical appointments, and medication management are among the high-quality services provided to improve residents’ quality of life. The community also works closely with residents to develop care plans tailored to their needs and habits.
With its relatively intimate setting, the community’s social programming and activities are limited but are still well-curated to help residents stay active. Residents can also relax and focus on their wellness, as cozy rooms and lively gathering areas are available. The MedStar Southern Maryland Hospital Center is also located nearby, providing residents with quick access to necessities and leisure. As one of the trusted options for senior living in Maryland, this assisted living community ensures older adults live to their potential in retirement.
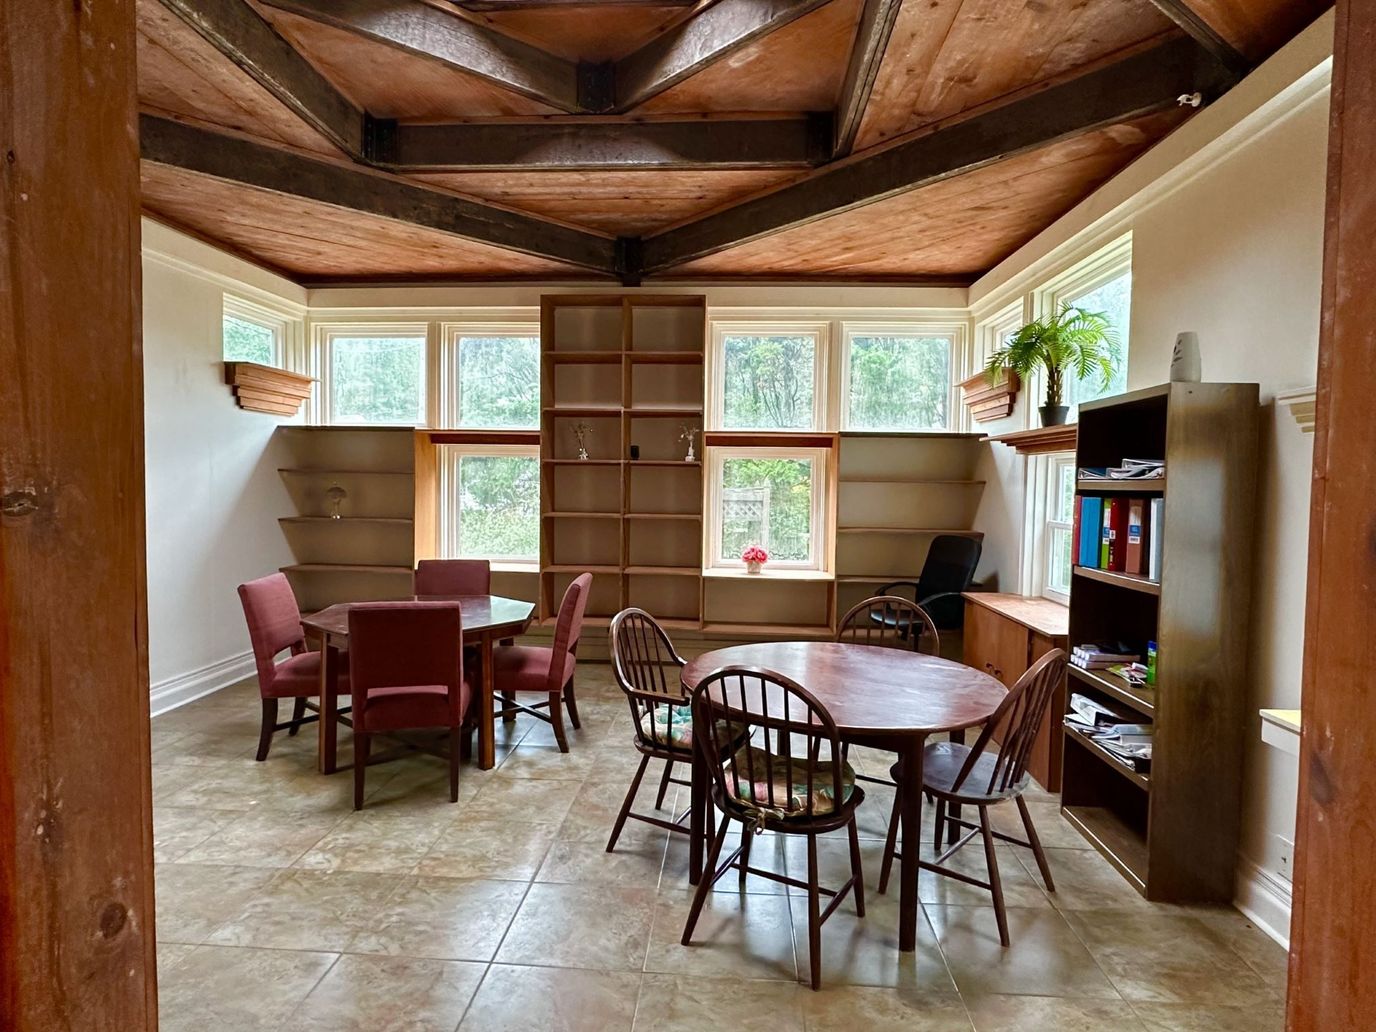
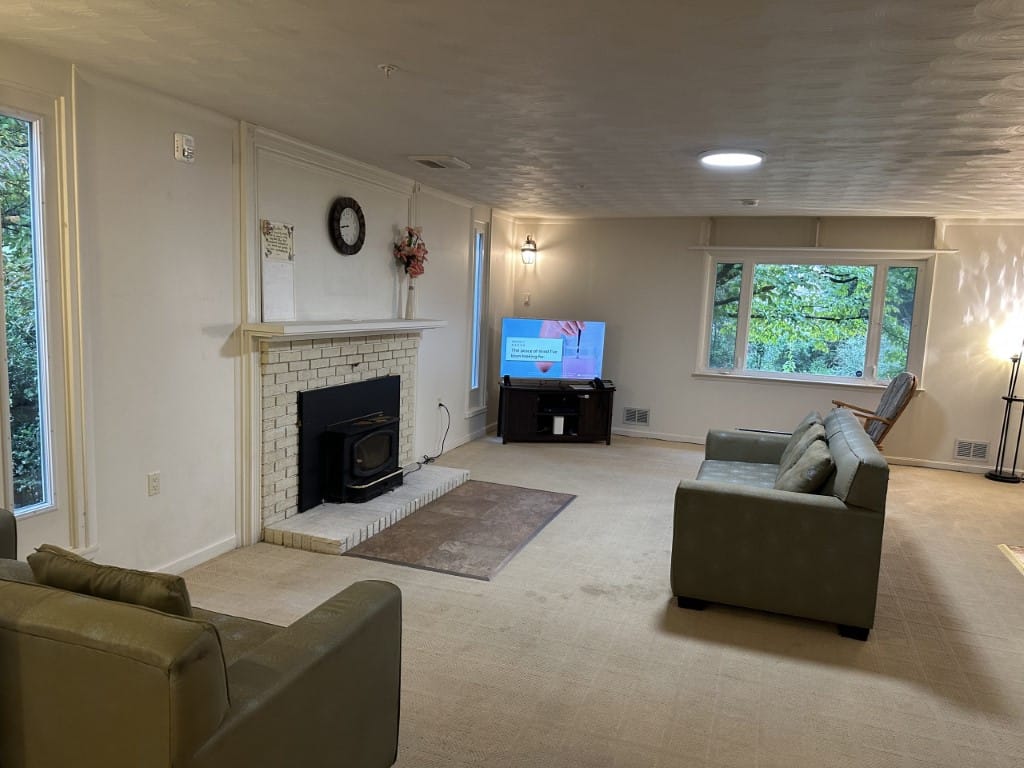
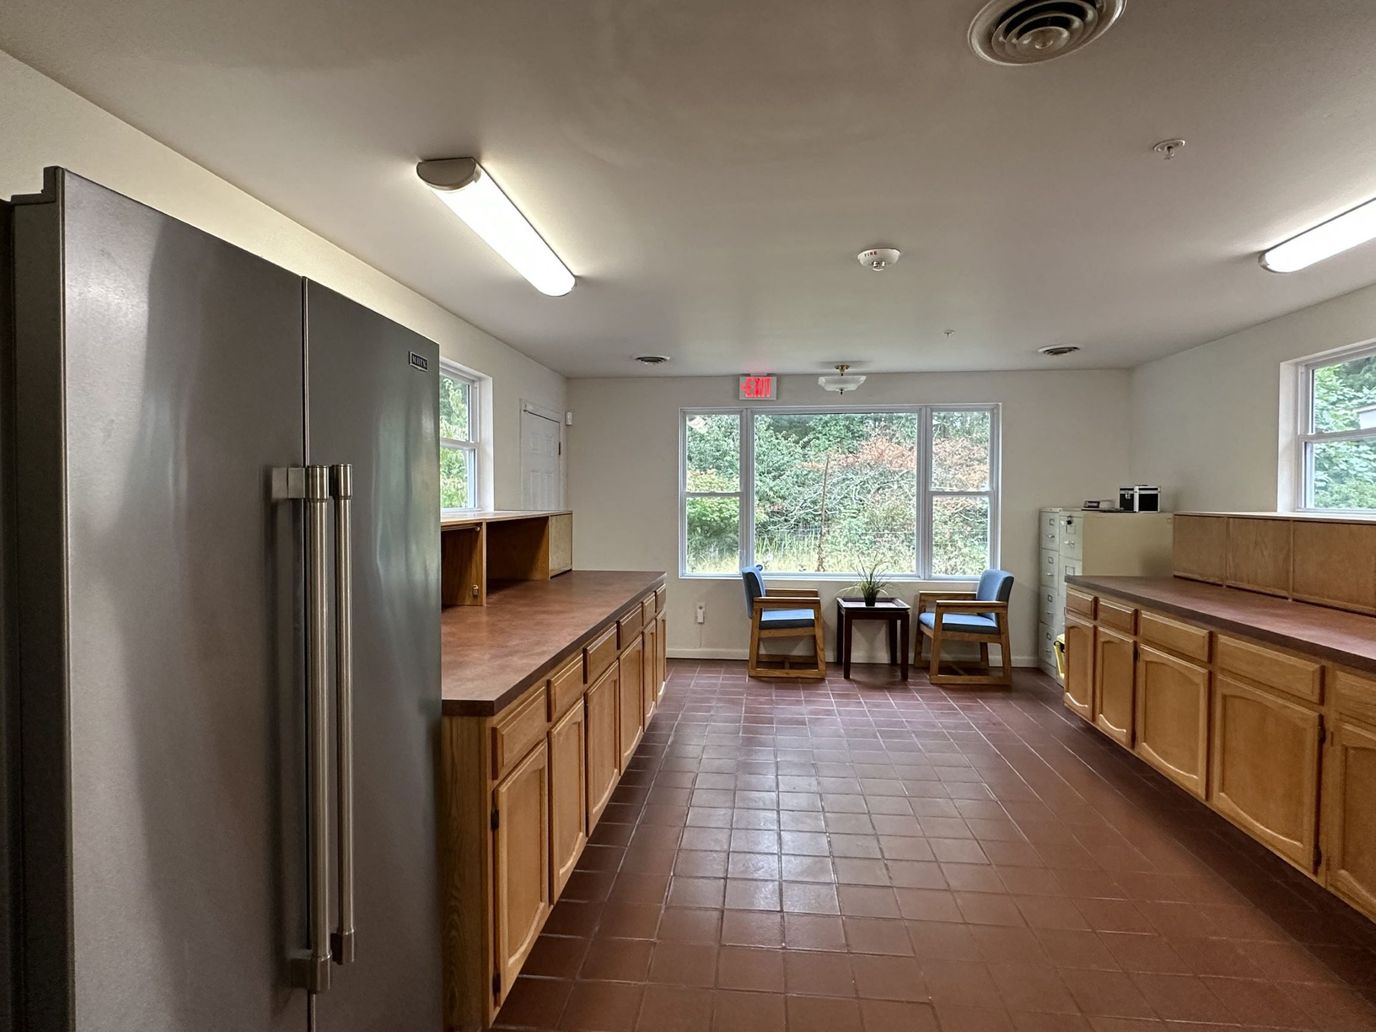
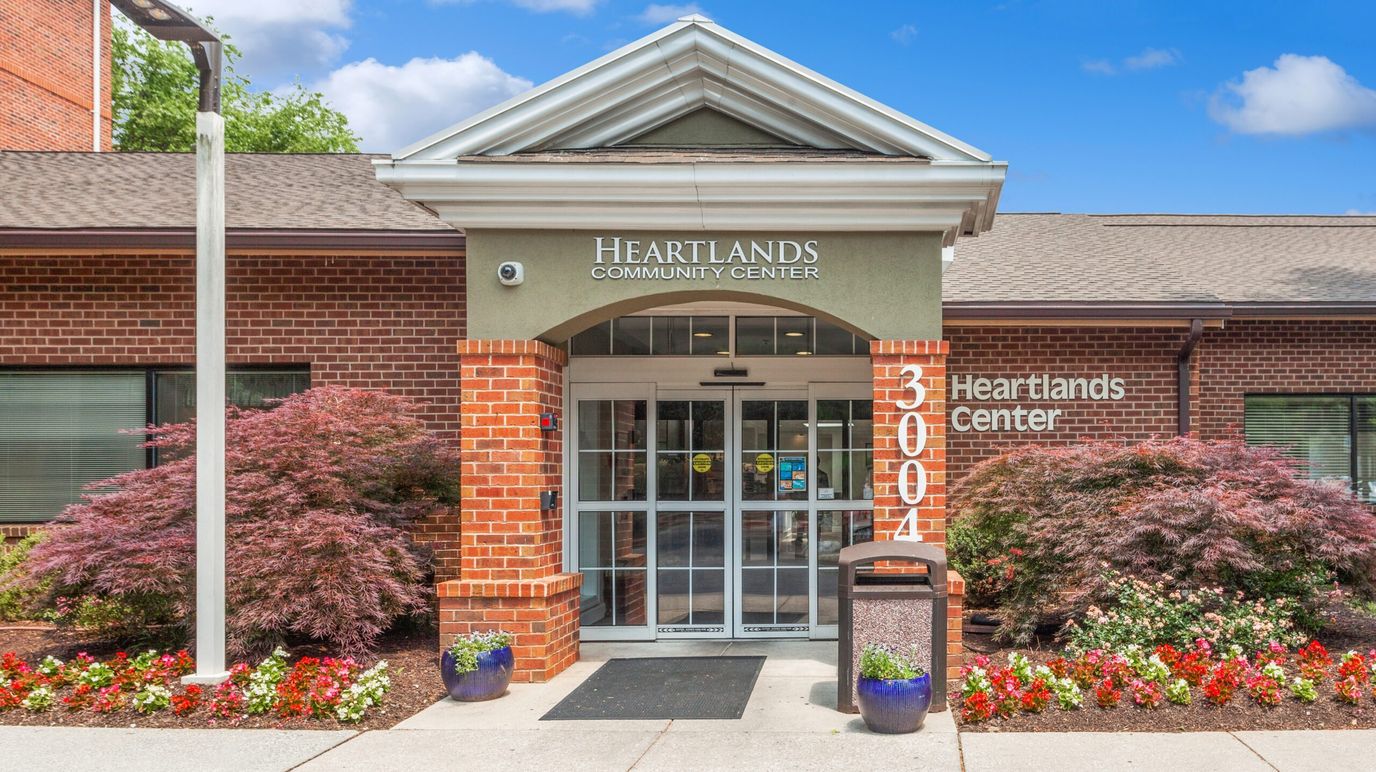
HeartLands Senior Living at Ellicott City operates as a skilled nursing facility in Ellicott City, Maryland, with certification for Medicare and Medicaid services. The facility is part of Discovery Senior Living’s portfolio of 45 senior living communities across multiple states. Located at 3004 North Ridge Road in Howard County, the operation has maintained licensed capacity for 182 beds and is currently serving residents at 87.8% occupancy, above the Maryland average; with an average length of stay of 103 days.
Nursing staff totals 27 registered nurses, 30 licensed practical nurses, and 64 certified nursing assistants among 174 total personnel. The facility provides 3 hours 27 minutes of nursing care per resident daily, below Maryland’s 4 hours 17 minutes standard. Contractor staffing represents 7% of total hours (3,896 hours quarterly), with specialists including physical therapy assistants, speech-language pathologists, respiratory therapy technicians, and qualified social workers supplementing core staff.
CMS assigns a 1-star overall rating, placing the facility 70.7% below Maryland average. Health inspection performance falls 68.8% below state benchmark. Quality measures register 7.2% above Maryland average for clinical outcomes including pressure ulcers, activities of daily living decline, walking ability, urinary tract infection rates, and depressive symptoms. The facility achieved pneumococcal vaccine administration at 99.7% of long-stay residents, and antipsychotic use at 7.8%, favorably below Maryland average of 12.9%.
Between September 2019 and November 2025, the facility accumulated 104 health citations: 1 critical, 2 serious, 101 moderate. Deficiencies concentrated in resident rights (24), quality of life/care (23), administration (8), abuse/neglect (8), and pharmacy services (7). No federal civil money penalties were assessed in the three-year review period. Complaint investigations from March 2025 through June 2025 identified systemic issues in resident dignity, environmental maintenance, care planning, activities of daily living assistance, medical records accuracy, and infection control practices.
Fiscal year 2024 generated $27.4 million gross revenue with net operating loss of $1.8 million and -6.4% profit margin. Payroll comprised $11.9 million (43.6% of revenue), ranked 31st statewide in total investment but 78th in payroll percentage. Payer mix reflects Medicaid dominance at 78.8%, private pay at 12.0%, and Medicare at 9.1%.
The facility accommodates mixed-stay residents through skilled nursing, independent living, and respite care service lines.
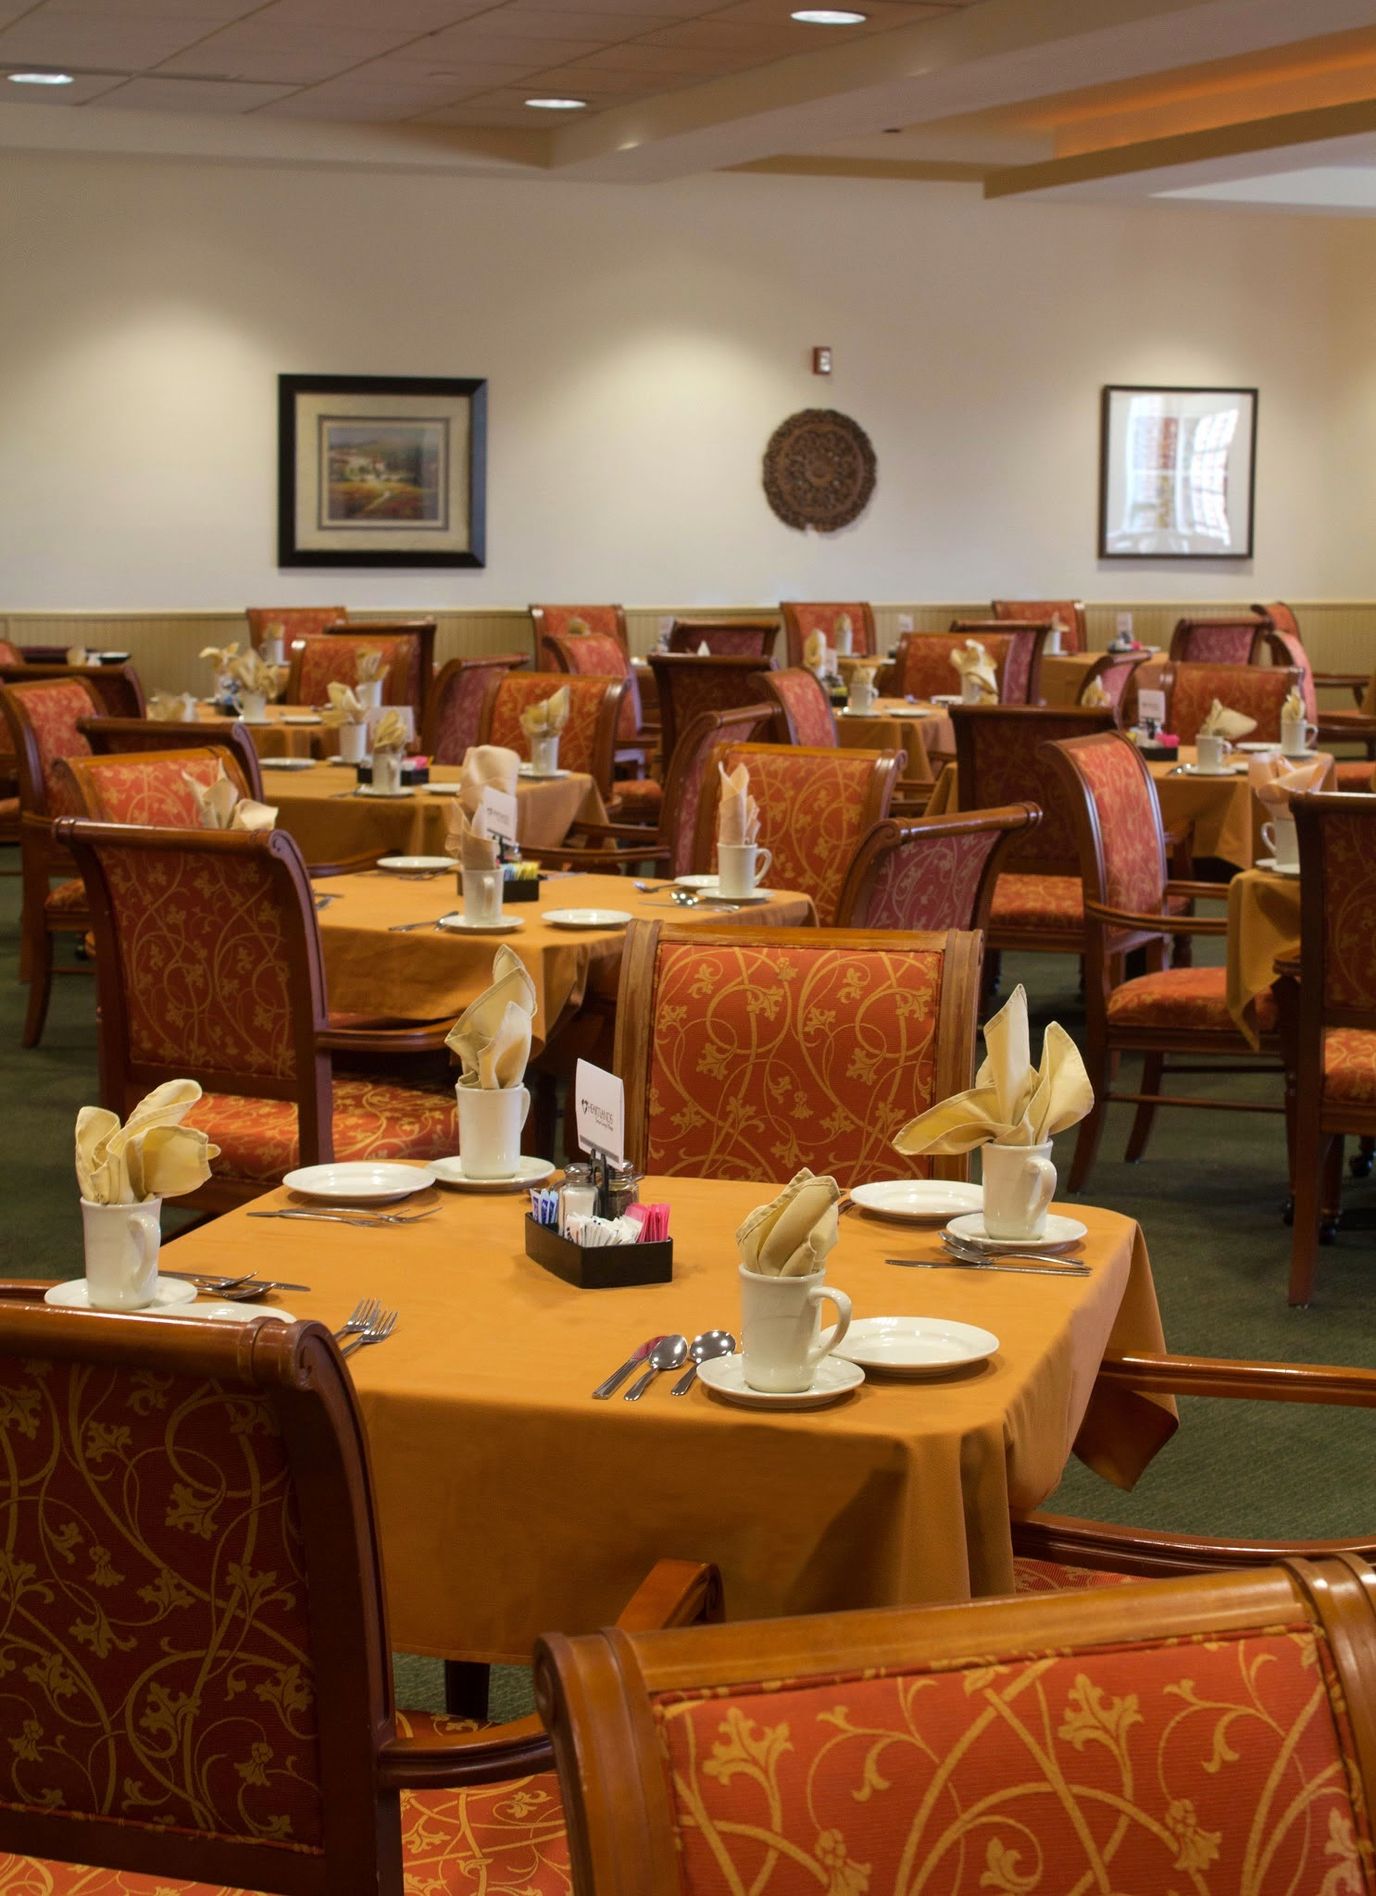
Dining emphasizes restaurant-style preparation with executive chef direction. Programs include recreational activities, exercise, beauty services, transportation, and housekeeping.
The car-dependent neighborhood (walk score 14) necessitates facility-provided transportation for community access.
HeartLands Senior Living at Ellicott City provides skilled nursing services within a mixed-pay model, sustained by substantial staffing investment but facing quality and efficiency performance gaps relative to Maryland standards and a persistent operating deficit.
Ranking Methodology
How we rank these independent living communities
Every community above is evaluated across six weighted categories using public data including state inspection records, review platforms, BBB profiles, and operator-published materials.
Weighting overview
- 35%Resident Experience
- 25%Regulatory
- 15%Visual Media
- 10%Website
- 10%Stability
- 5%Environment
01
Resident & Family Experience 35%
The single largest share of every ranking. Aggregated review sentiment and volume from major platforms — the closest signal to real resident experience.
- Includes
- Review Sentiment
- Review Volume
02
Regulatory & Safety Record 25%
State inspection records, citations, and complaint visits. We weight per-inspection rates more heavily than raw counts.
- Includes
- State Inspections
- Citations/Inspection
- % Inspections w/ Citations
- Complaint Visits
- Accreditations
- BBB Rating
03
Visual Media & Transparency 15%
Communities that publish high-quality visuals give families a real preview. No photos or tours = a negative transparency signal.
- Includes
- Video Tours
- Virtual Walkthroughs
- Photo Quantity
- Photo Quality
04
Website & Operator Transparency 10%
Site quality and whether the operator publishes basic accountability information — staff names, contact details, ownership.
- Includes
- Website Content
- Mobile Usability
- Staff Info Available
- Owner Info Available
05
Community Stability 10%
Operational signals indicating whether a community is well-run and meeting demand.
- Includes
- Occupancy Rate
- Bed Options
06
Environment & Pricing 5%
Walkability and pricing transparency. Walk Score is weighted higher for Independent Living than for Memory Care, where most residents do not leave unaccompanied.
- Includes
- Walk Score
- Pricing Transparency
Who we are
Your Senior Care Partner, Every Step of the Way
We help families find affordable senior communities and unlock same day discounts, Medicaid, and Medicare options tailored to your needs.
Contact us Today
Frequently Asked Questions about Independent Living in Maryland
What is independent living?
Independent living communities are residential settings for active older adults — typically with private apartments or cottages, shared amenities (dining, fitness, activities), and no built-in medical care.
How many independent living communities are listed on this page?
This page features 164 independent living communities in Maryland. Use the filters and comparison tools above to compare ratings, amenities, and pricing.
How do I choose the right independent living community in Maryland?
Start by matching the level of care offered to the resident's current and anticipated needs, then compare licensing status, staff-to-resident ratios, recent inspection results, and pricing. Tour at least two or three communities in Maryland, talk to current residents and families, and confirm what is included in the base rate versus billed as add-on services.
What should I look for when visiting independent living communities in Maryland?
Pay attention to staff interactions with residents, cleanliness and odor, food quality at meal times, the activity calendar, and how questions about pricing and care plans are answered. Ask to see the most recent state inspection report, the move-out / level-of-care-change policy, and a sample monthly bill that lists every fee.
Updated on
