


Where in Maryland are you looking?
Browse communities by city.
Compare Memory Care around Maryland
The information below is reported by the Maryland Department of Health, Office of Health Care Quality.
| Edenwald Senior Living | MC AL IL NH SNF | Towson (Southerly Road) | 94
Facility
94
MD AVG
43
Rank
#144 / 690 | No |
83
Facility
83
MD AVG
43
Rank
#70 / 985 | 1 Bed / 2 Bed | - |
18% Male Residents — State Benchmarked 18% of residents are male, compared to the Maryland average of 31%. This facility caters to a majority female resident pool (82% female), consistent with the broader assisted living trend where women significantly outnumber men. |
82% Female Residents — State Benchmarked 82% of residents are female, compared to the Maryland average of 69%. Women comprise the large majority, consistent with national assisted living demographics where women live longer and enter care facilities at higher rates. |
100% White Residents — State Benchmarked 100% of residents are reported as White, compared to the Maryland average of 81%. A higher White share than is typical for assisted living in Maryland in this dataset — compare with peer facilities for local context. |
13% Residents Age 75–84 — State Benchmarked 13% of residents are 75–84, compared to the Maryland average of 31%. Below the state norm — the resident mix may skew either younger or older than this typical middle bracket. |
53% Residents Age 85–94 — State Benchmarked 53% of residents are 85–94, compared to the Maryland average of 44%. A high concentration of very elderly residents signals a higher-acuity facility with experience caring for advanced age-related needs. |
35% Residents Age 95+ — State Benchmarked 35% of residents are 95 or older, compared to the Maryland average of 16%. A high proportion of the oldest-old suggests strong end-of-life care experience and very-high-acuity capabilities. |
| Homewood Living Frederick | MC AL IL NH SNF | Frederick | 120
Facility
120
MD AVG
43
Rank
#76 / 690 | Yes |
14
Facility
14
MD AVG
43
Rank
#788 / 985 | 1 Bed / 2 Bed | - | - | - | - | - | - | - |
| Ingleside at King Farm | MC AL IL NH SNF | Rockville (King Farm) | 45
Facility
45
MD AVG
43
Rank
#226 / 690 | Yes |
73
Facility
73
MD AVG
43
Rank
#152 / 985 | 1 Bed / 2 Bed | - | - | - | - | - | - | - |
| Bedford Court, a CCRC | MC AL HOS IL NH RC SNF | Silver Spring (International Drive) | 76
Facility
76
MD AVG
43
Rank
#179 / 690 | Yes |
64
Facility
64
MD AVG
43
Rank
#261 / 985 | Studio / 1 Bed | 34
Facility
34
MD AVG
21
Rank
#22 / 210 |
15% Male Residents — State Benchmarked 15% of residents are male, compared to the Maryland average of 31%. This facility caters to a majority female resident pool (85% female), consistent with the broader assisted living trend where women significantly outnumber men. |
85% Female Residents — State Benchmarked 85% of residents are female, compared to the Maryland average of 69%. Women comprise the large majority, consistent with national assisted living demographics where women live longer and enter care facilities at higher rates. |
95% White Residents — State Benchmarked 95% of residents are reported as White, compared to the Maryland average of 81%. A higher White share than is typical for assisted living in Maryland in this dataset — compare with peer facilities for local context. |
8% Residents Age 75–84 — State Benchmarked 8% of residents are 75–84, compared to the Maryland average of 31%. Below the state norm — the resident mix may skew either younger or older than this typical middle bracket. |
65% Residents Age 85–94 — State Benchmarked 65% of residents are 85–94, compared to the Maryland average of 44%. A high concentration of very elderly residents signals a higher-acuity facility with experience caring for advanced age-related needs. |
26% Residents Age 95+ — State Benchmarked 26% of residents are 95 or older, compared to the Maryland average of 16%. A high proportion of the oldest-old suggests strong end-of-life care experience and very-high-acuity capabilities. |
| Sterling Care Hillhaven Assisted Living and Memory Care | MC AL HOS NH SNF | Adelphi (Knollwood) | 66
Facility
66
MD AVG
43
Rank
#195 / 690 | No |
25
Facility
25
MD AVG
43
Rank
#684 / 985 | Studio / 1 Bed | - | - | - | - | - | - | - |
| Buckingham‘s Choice | MC AL NH RC SNF | Adamstown (Baker Circle) | 42
Facility
42
MD AVG
43
Rank
#230 / 690 | No |
3
Facility
3
MD AVG
43
Rank
#930 / 985 | Private Rooms | 31
Facility
31
MD AVG
21
Rank
#39 / 210 | - | - | - | - | - | - |
| Residences at Vantage Point | MC AL HC IL NH SNF | Columbia (Town Center) | 44
Facility
44
MD AVG
43
Rank
#229 / 690 | Yes |
52
Facility
52
MD AVG
43
Rank
#402 / 985 | Studio / 1 Bed / 2 Bed | 36
Facility
36
MD AVG
21
Rank
#16 / 210 | - | - | - | - | - | - |
| Maplewood Park Place | MC AL IL NH SNF | Bethesda (Pooks Hill) | 29
Facility
29
MD AVG
43
Rank
#247 / 690 | Yes |
38
Facility
38
MD AVG
43
Rank
#542 / 985 | 1 Bed / 2 Bed | 30
Facility
30
MD AVG
21
Rank
#44 / 210 |
18% Male Residents — State Benchmarked 18% of residents are male, compared to the Maryland average of 31%. This facility caters to a majority female resident pool (82% female), consistent with the broader assisted living trend where women significantly outnumber men. |
82% Female Residents — State Benchmarked 82% of residents are female, compared to the Maryland average of 69%. Women comprise the large majority, consistent with national assisted living demographics where women live longer and enter care facilities at higher rates. |
100% White Residents — State Benchmarked 100% of residents are reported as White, compared to the Maryland average of 81%. A higher White share than is typical for assisted living in Maryland in this dataset — compare with peer facilities for local context. |
6% Residents Age 75–84 — State Benchmarked 6% of residents are 75–84, compared to the Maryland average of 31%. Below the state norm — the resident mix may skew either younger or older than this typical middle bracket. |
24% Residents Age 85–94 — State Benchmarked 24% of residents are 85–94, compared to the Maryland average of 44%. The population here skews younger than the statewide norm, which may indicate a more active, lower-acuity community. |
71% Residents Age 95+ — State Benchmarked 71% of residents are 95 or older, compared to the Maryland average of 16%. A high proportion of the oldest-old suggests strong end-of-life care experience and very-high-acuity capabilities. |
| Montcare Bethesda | MC HOS NH PC SNF | Bethesda (Georgetown Village) | 120
Facility
120
MD AVG
43
Rank
#76 / 690 | No |
70
Facility
70
MD AVG
43
Rank
#184 / 985 | Private / Semi-Private Rooms | - | - | - | - | - | - | - |
| Revitz House | MC AL HC IL NH SNF | Rockville | 558
Facility
558
MD AVG
43
Rank
#1 / 690 | Yes |
81
Facility
81
MD AVG
43
Rank
#86 / 985 | 1 Bed | - | - | - | - | - | - | - |
| Broadmead | MC AL IL NH RC SNF | Cockeysville | 40
Facility
40
MD AVG
43
Rank
#233 / 690 | No |
0
Facility
0
MD AVG
43
Rank
#959 / 985 | - | 47
Facility
47
MD AVG
21
Rank
#3 / 210 | - | - | - | - | - | - |
| Blakehurst (Chestnut Green) | MC AL IL NH SNF | Towson | 35
Facility
35
MD AVG
43
Rank
#239 / 690 | No |
10
Facility
10
MD AVG
43
Rank
#837 / 985 | - | 33
Facility
33
MD AVG
21
Rank
#25 / 210 | - | - | - | - | - | - |
| Asbury Methodist Village | MC AL IL NH SNF | Gaithersburg (Russell Avenue) | 164
Facility
164
MD AVG
43
Rank
#26 / 690 | Yes |
41
Facility
41
MD AVG
43
Rank
#508 / 985 | - | 27
Facility
27
MD AVG
21
Rank
#62 / 210 |
21% Male Residents — State Benchmarked 21% of residents are male, compared to the Maryland average of 31%. This facility caters to a majority female resident pool (79% female), consistent with the broader assisted living trend where women significantly outnumber men. |
79% Female Residents — State Benchmarked 79% of residents are female, compared to the Maryland average of 69%. Women comprise the large majority, consistent with national assisted living demographics where women live longer and enter care facilities at higher rates. |
92% White Residents — State Benchmarked 92% of residents are reported as White, compared to the Maryland average of 81%. A higher White share than is typical for assisted living in Maryland in this dataset — compare with peer facilities for local context. |
21% Residents Age 75–84 — State Benchmarked 21% of residents are 75–84, compared to the Maryland average of 31%. Below the state norm — the resident mix may skew either younger or older than this typical middle bracket. |
48% Residents Age 85–94 — State Benchmarked 48% of residents are 85–94, compared to the Maryland average of 44%. This is typically the most common age bracket in assisted living — this facility is in line with the statewide norm. |
30% Residents Age 95+ — State Benchmarked 30% of residents are 95 or older, compared to the Maryland average of 16%. A high proportion of the oldest-old suggests strong end-of-life care experience and very-high-acuity capabilities. |
| Lorien Bulle Rock | MC AL NH RC SNF | Havre De Grace | 78
Facility
78
MD AVG
43
Rank
#176 / 690 | No |
36
Facility
36
MD AVG
43
Rank
#563 / 985 | Private/Semi-Private Rooms | - | - | - | - | - | - | - |
| Citizens Care Center | MC HOS NH RC SNF | Havre De Grace | 184
Facility
184
MD AVG
43
Rank
#15 / 690 | No |
74
Facility
74
MD AVG
43
Rank
#147 / 985 | Private/Semi-Private Rooms | - | - | - | - | - | - | - |
Rows per page:

View all Nearby Homes
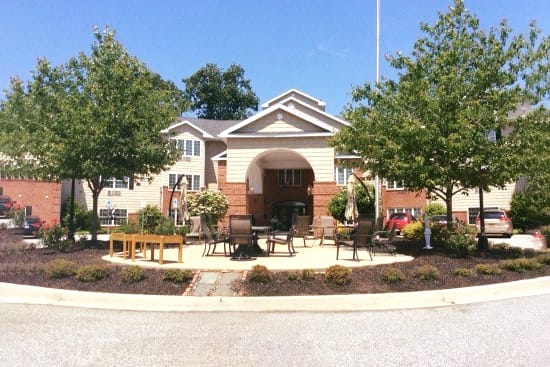
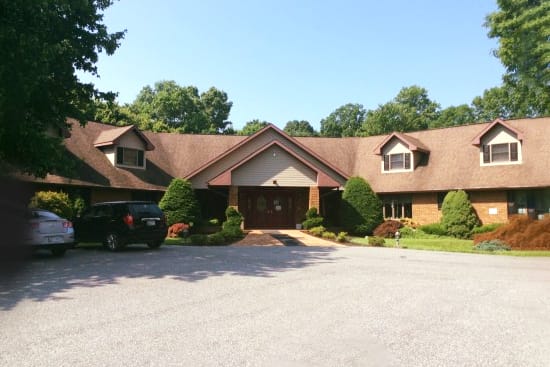
Overview of Hart Heritage of Street

Hart Heritage of Street is a 39-bed assisted living and memory care community located at 3708 Grier Nursery Road in Street, Maryland. Serving older adults in Harford County, the facility holds accreditation from the Maryland Association of Residential Care Homes and specializes in residential care and memory support.
The Maryland Department of Health, Office of Health Care Quality, oversees the inspection of this facility. No specific inspection history is reported in the current source data, and the community maintains a citations-per-inspection rate of zero. Records show that no civil money penalties or payment denials have been imposed by CMS within the past three years.
The community provides 24-hour staffing and security. Confirmed amenities and services include a beauty salon, library, courtyard, laundry, and housekeeping services. On-site personal care includes nail and podiatry care. Daily meals are provided, and respite care is available for short-term stays. Specific details regarding staffing ratios, dining menus, and monthly pricing are not reported in the source data, so families should request these details during a tour.
Families seeking a small-scale assisted living or memory care environment in Harford County may find this community appropriate. Families evaluating Hart Heritage of Street should confirm Medicaid acceptance, current occupancy, and the full inspection history directly with the Maryland Department of Health before making a placement decision.
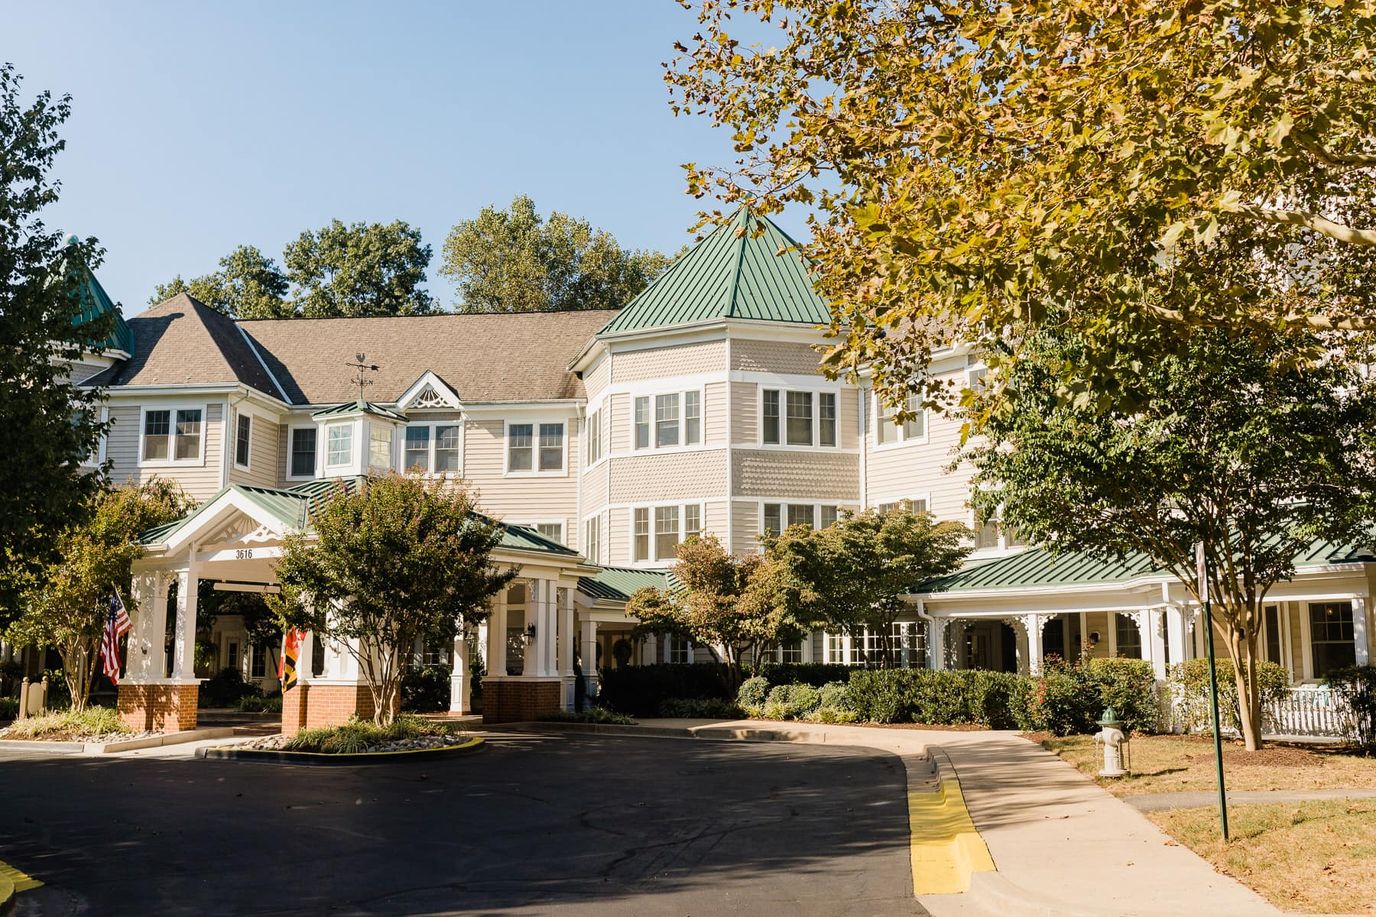
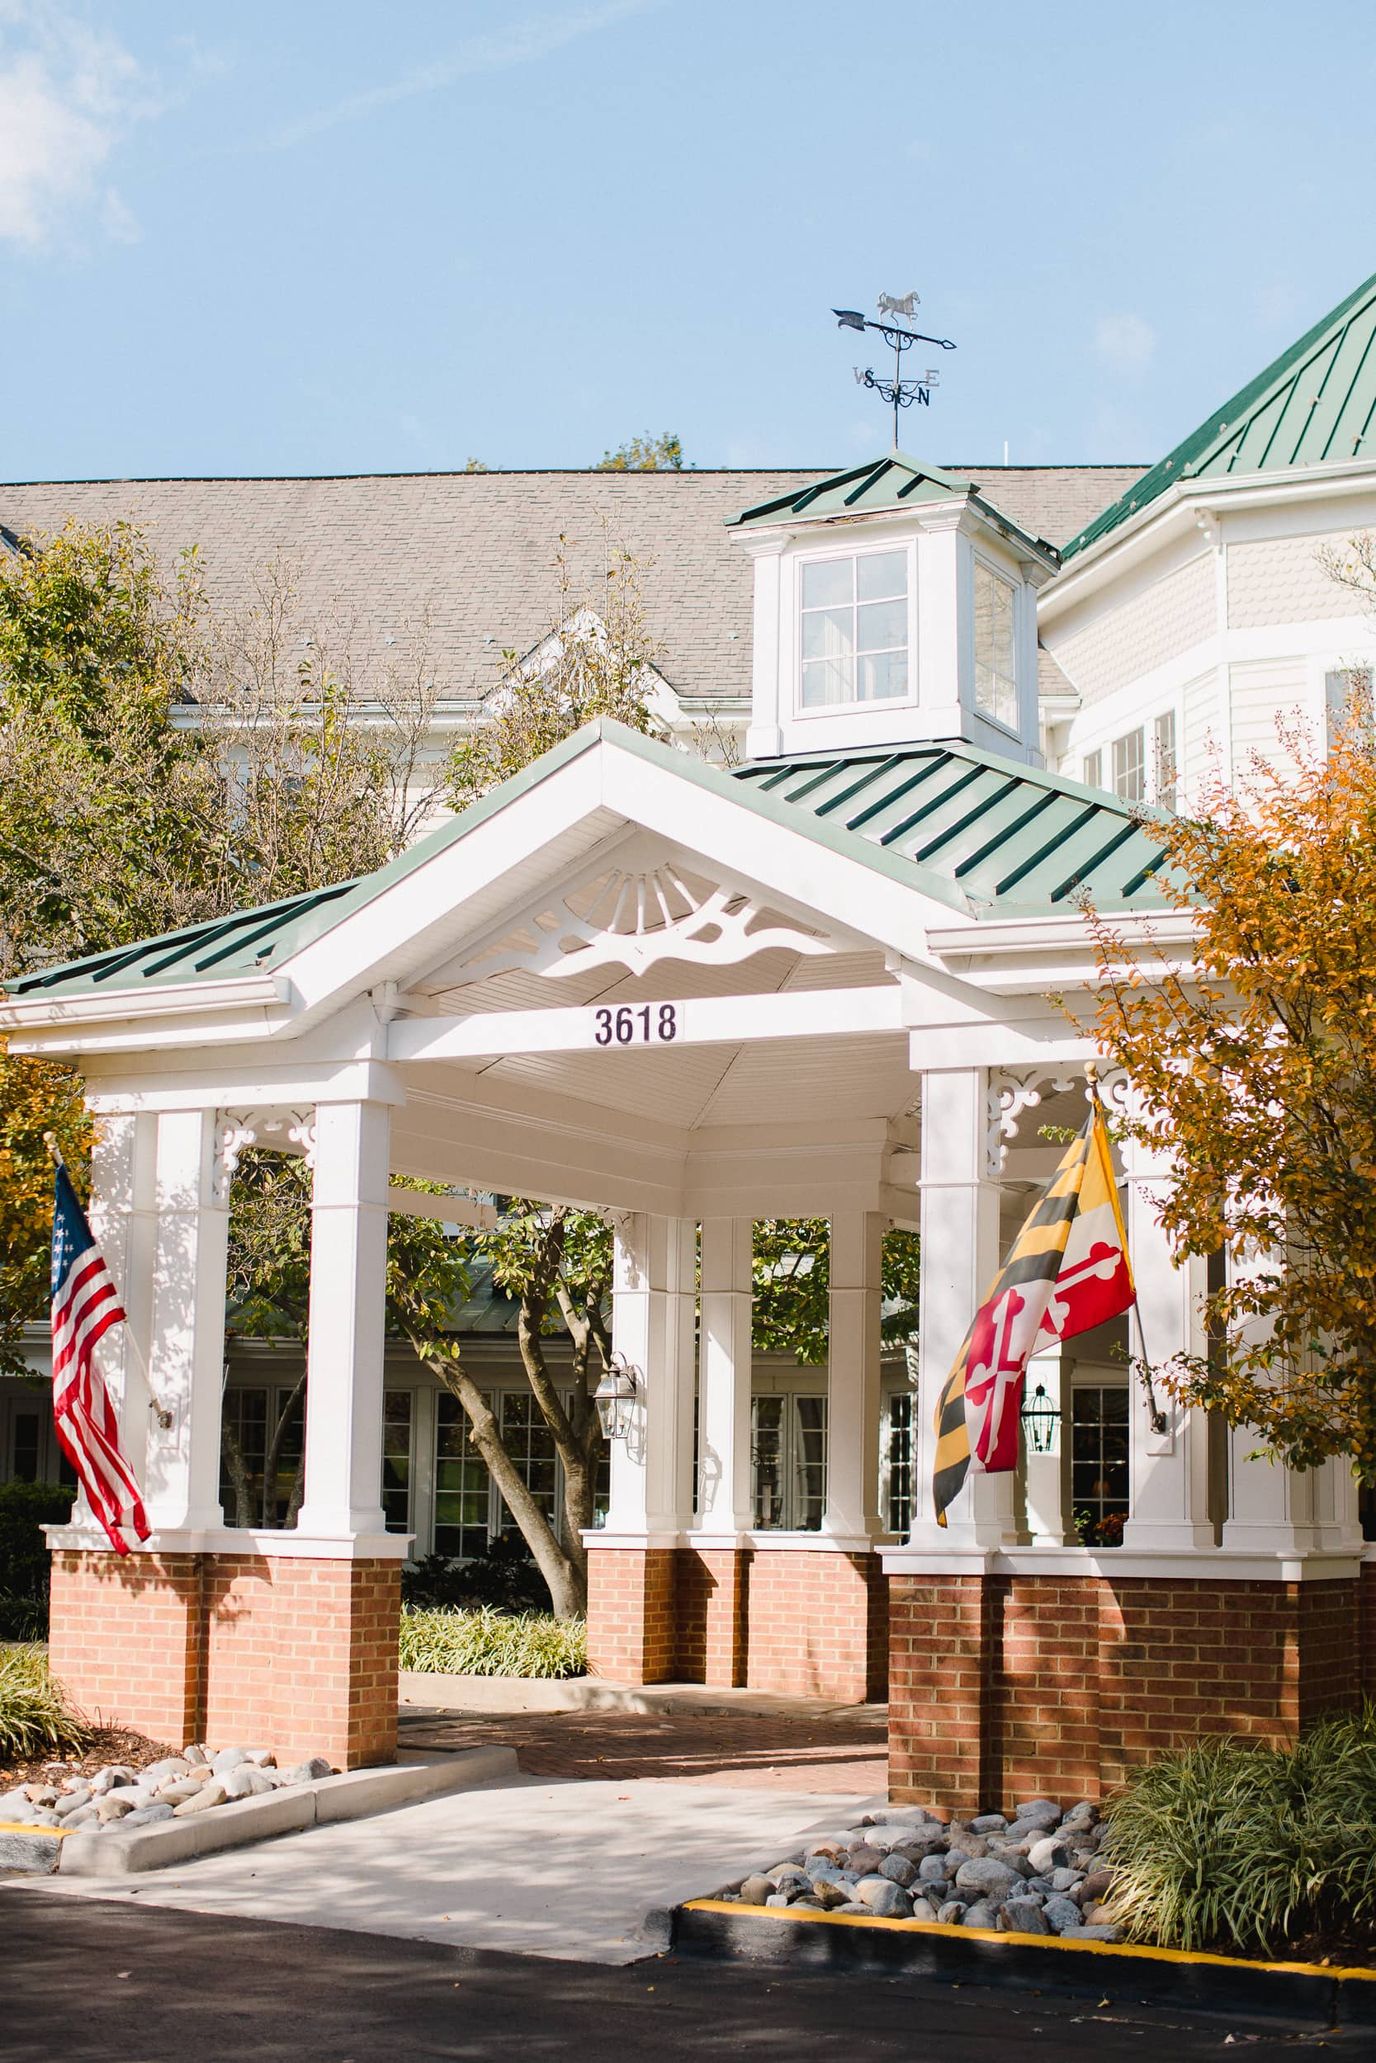
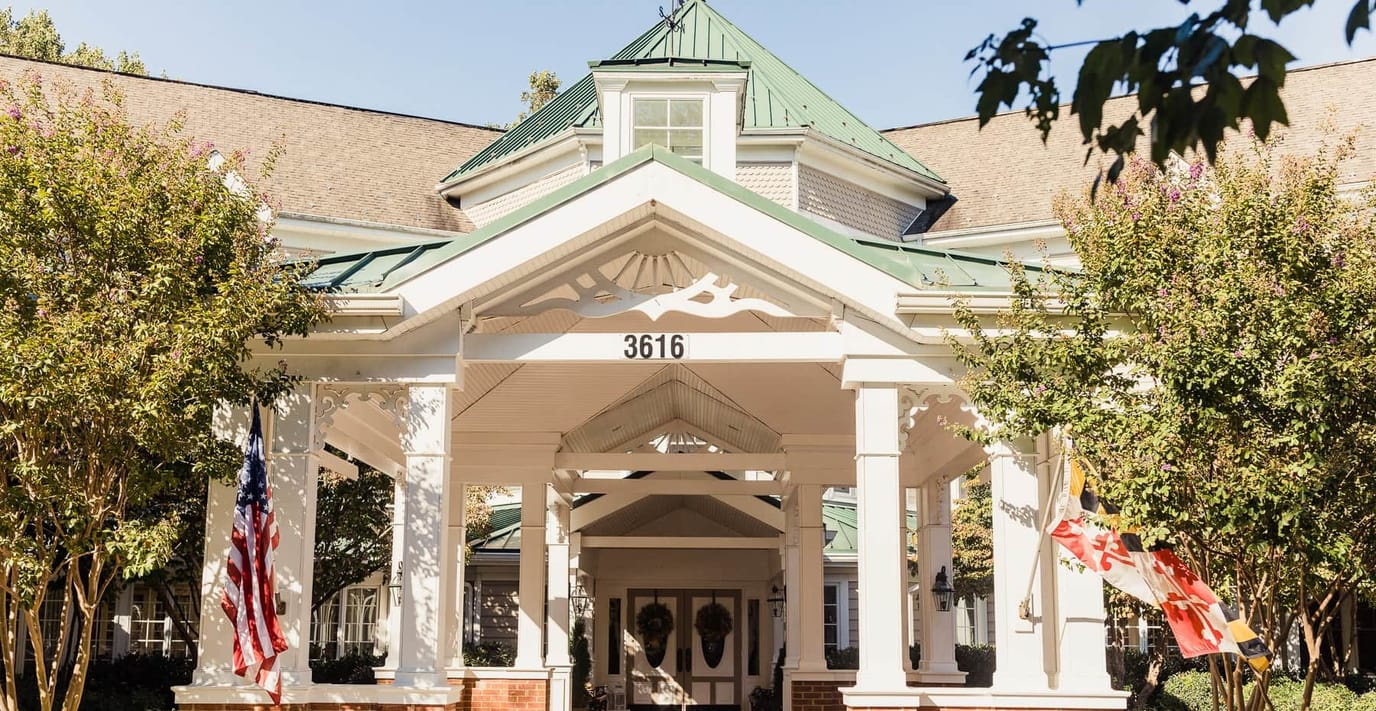
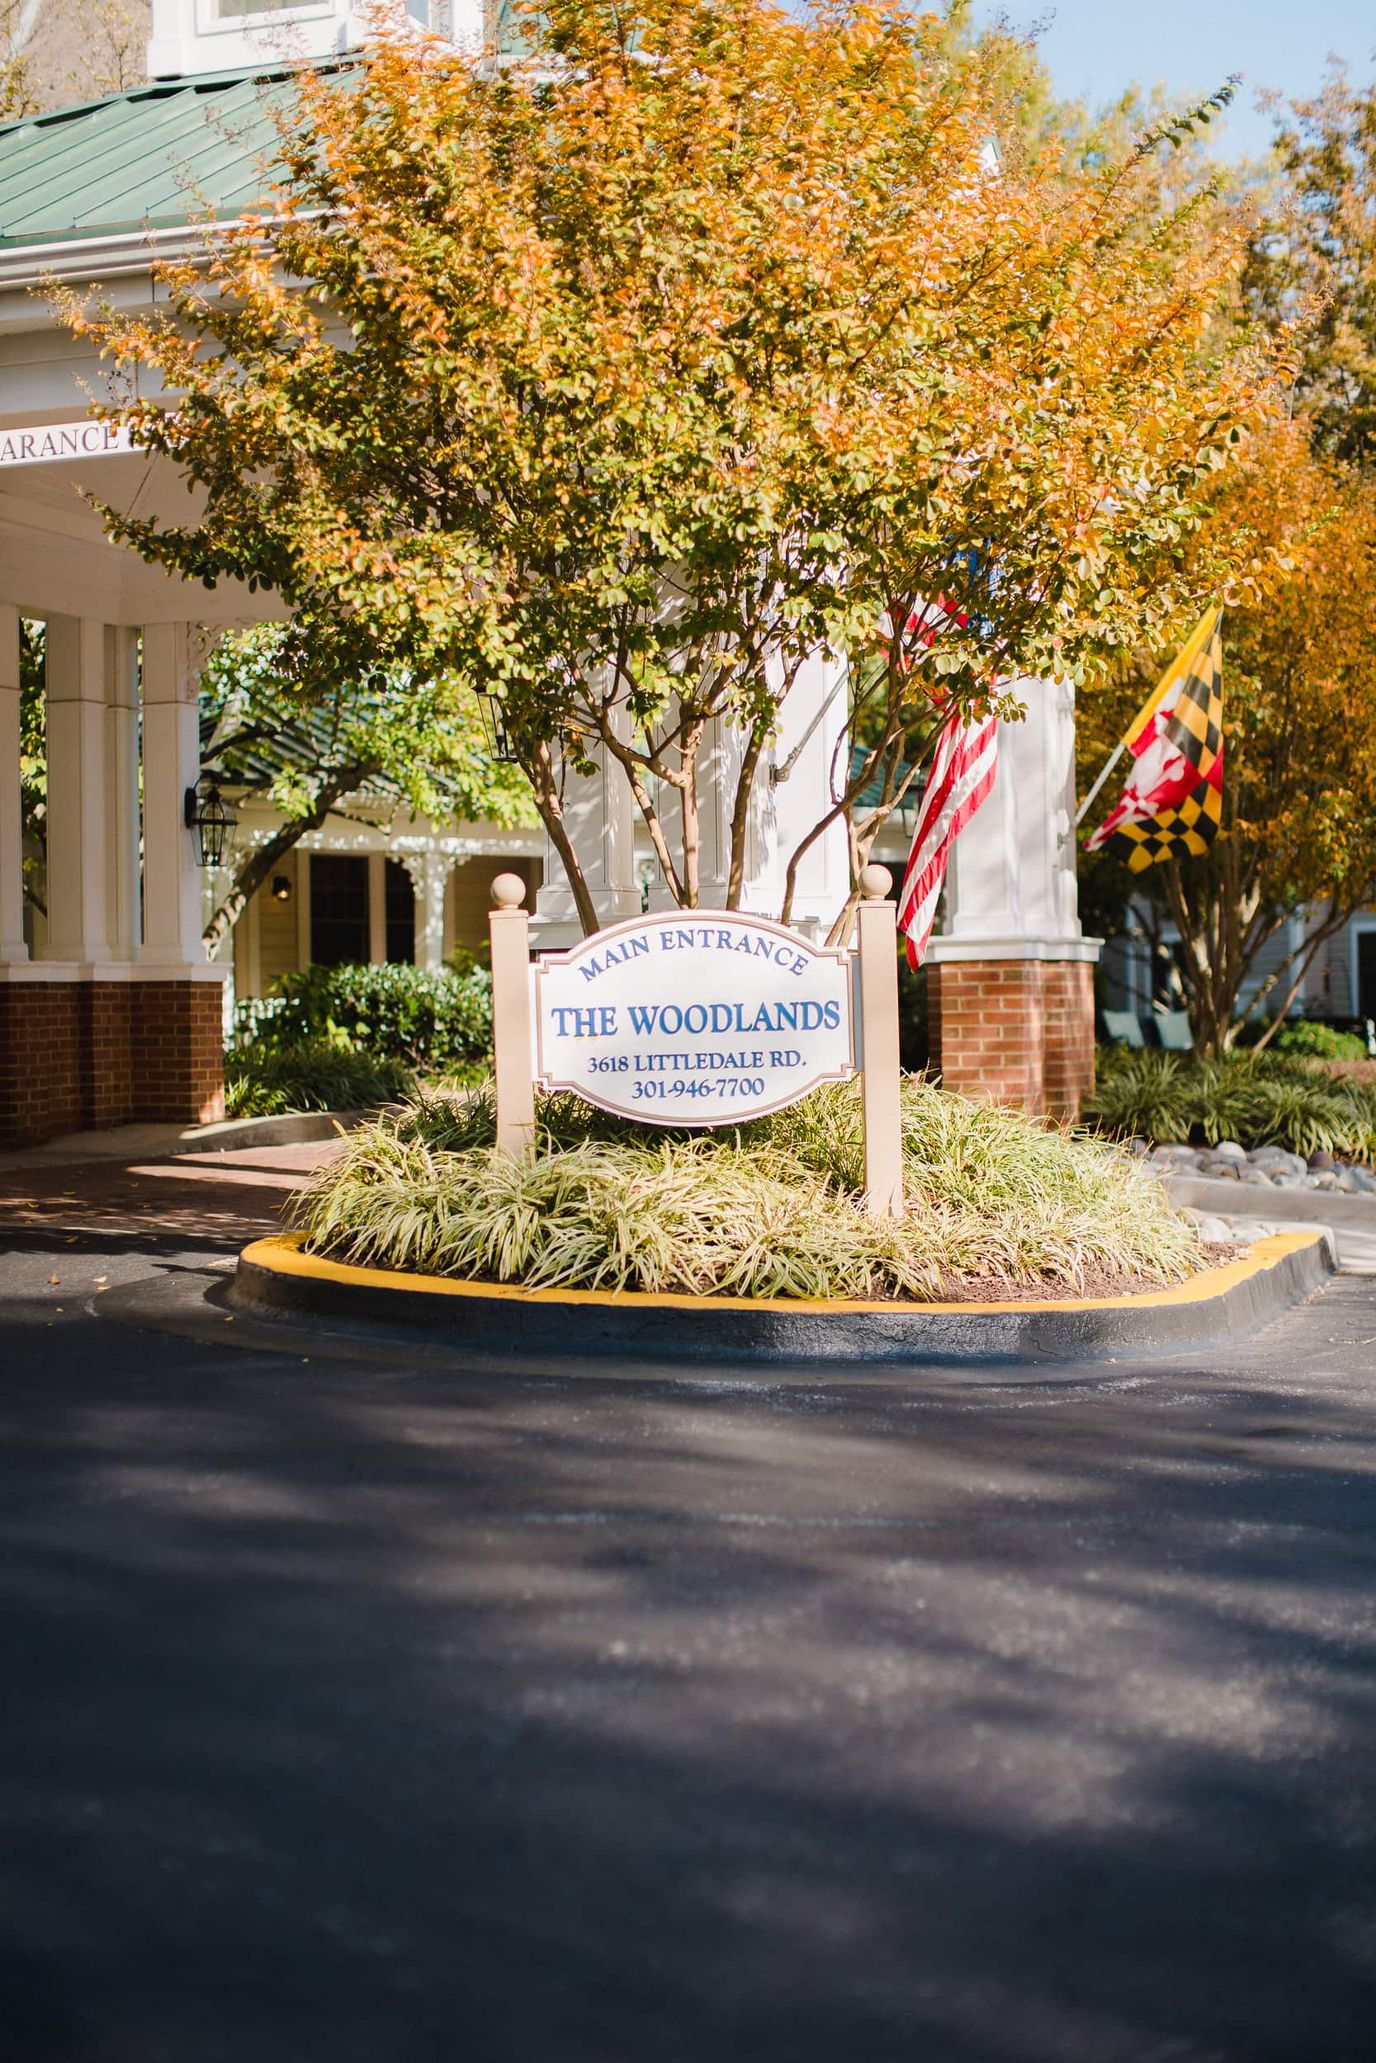
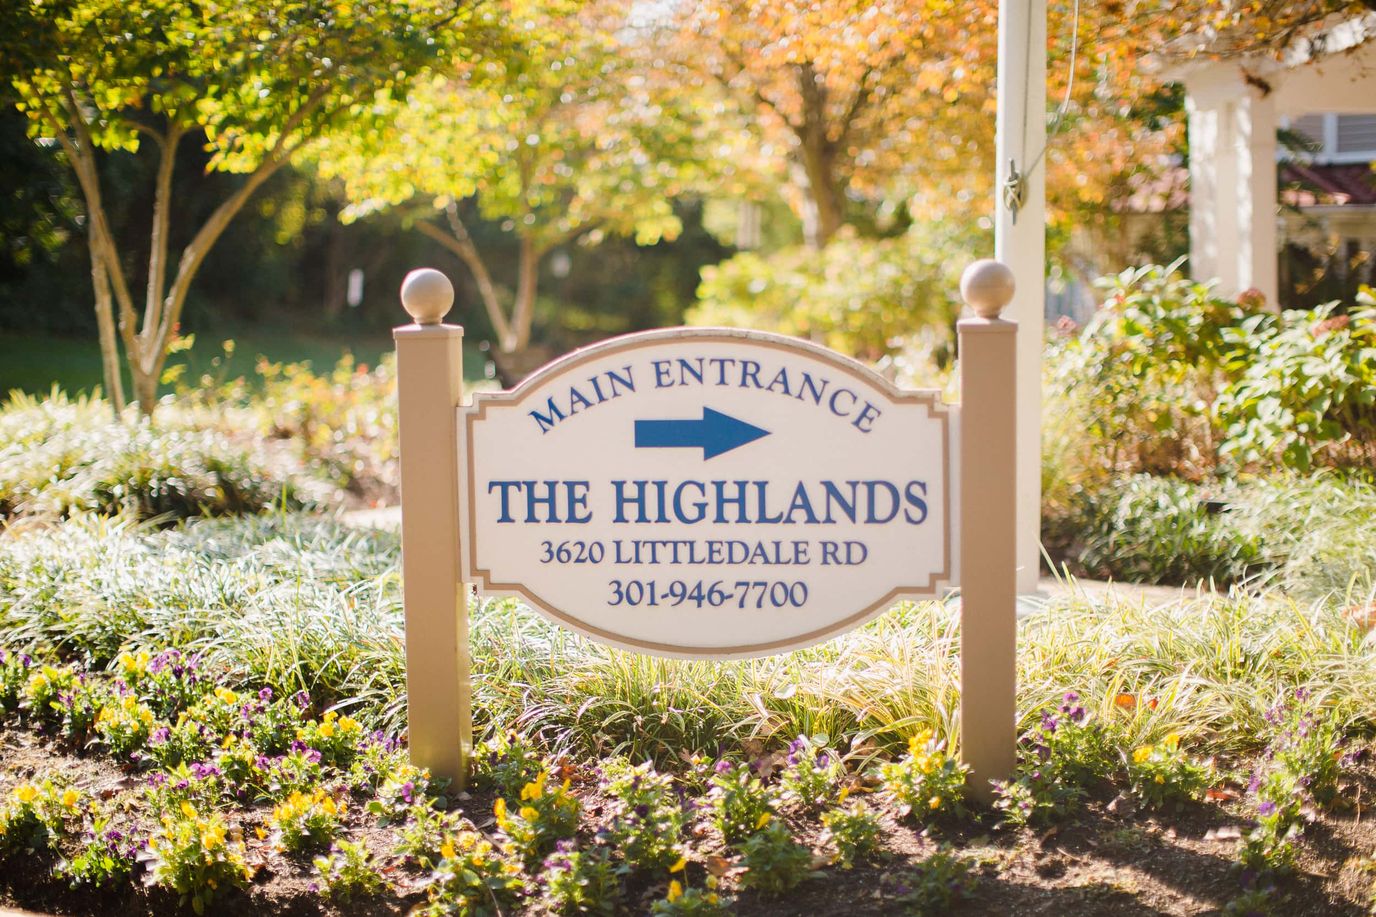
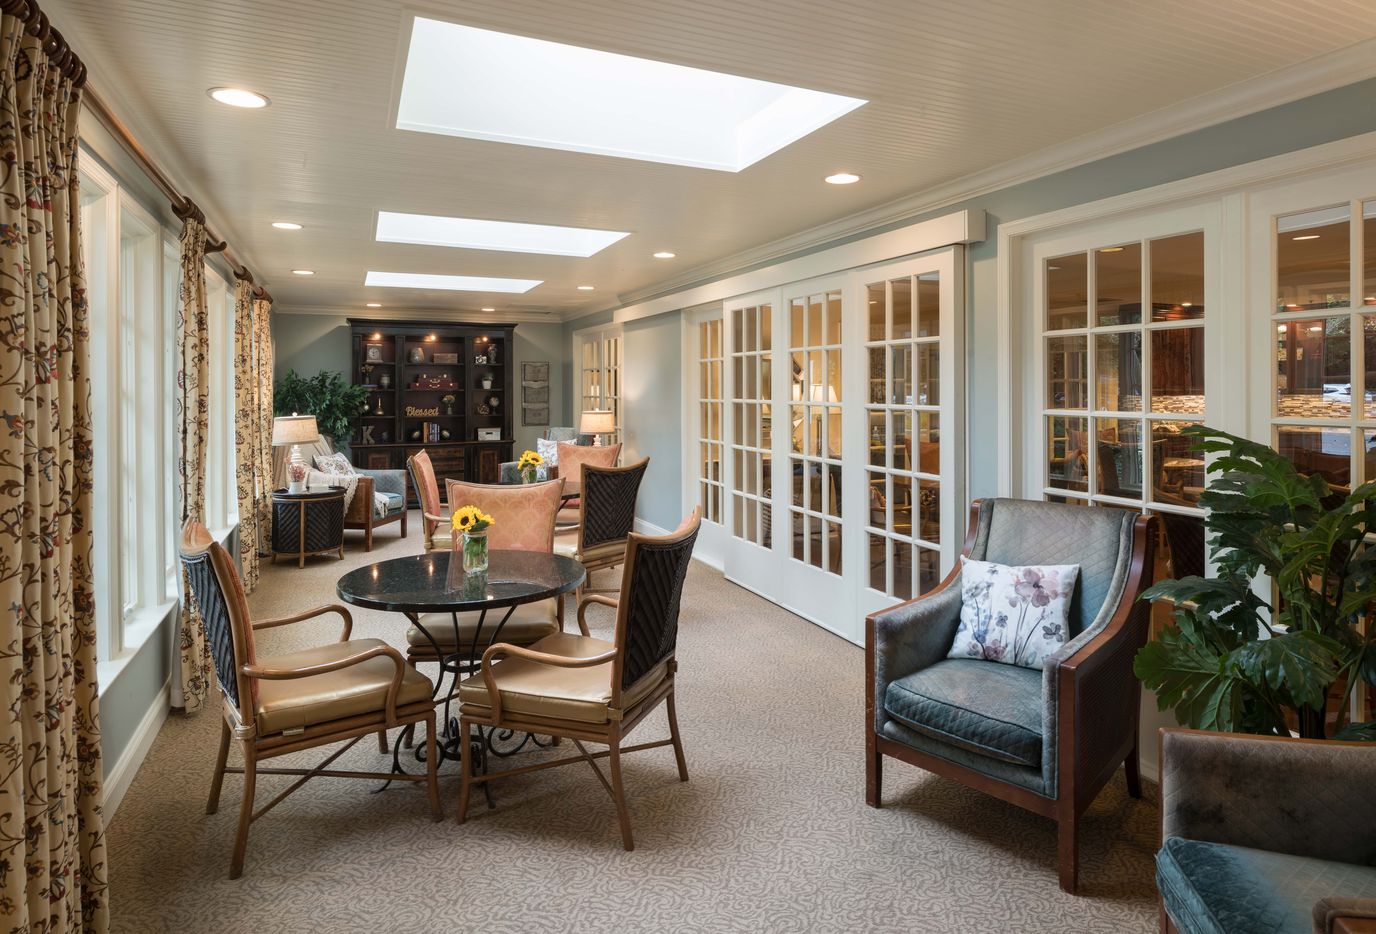
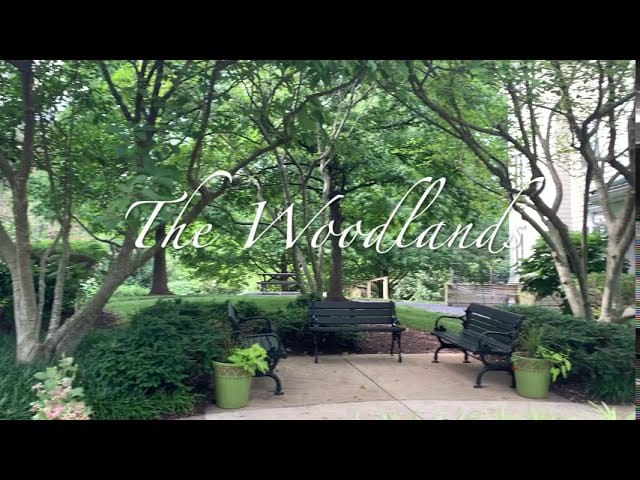
Overview of Kensington Park – Groves & Woodlands

Kensington Park – Groves & Woodlands is a 160-bed senior living community located at 3616–3618 Littledale Road in Kensington, Maryland. Serving older adults in Montgomery County, the facility operates as part of Kensington Park Senior Living and provides independent living, assisted living, memory care, and rehabilitation services.
The Maryland Department of Health, Office of Health Care Quality, oversees the inspection of this facility. No specific inspection history is reported in the current source records, and the community maintains a citations-per-inspection rate of zero. No civil money penalties or payment denials appear in the available regulatory data.
The community features specialized programming including a social and lifestyle club, post-acute rehabilitation, and an in-home care extension. A dedicated couples care program is available for residents with differing care requirements. Specific details regarding staffing ratios, on-site amenities, dining menus, and monthly pricing are not reported in the source data, so families should request these details during a tour.
Situated in Kensington, the facility suits families seeking a continuum-of-care community with specific provisions for couples requiring different levels of support. Families evaluating Kensington Park – Groves & Woodlands should confirm Medicaid acceptance, current occupancy, and the full inspection history directly with the Maryland Department of Health before making a placement decision.
Arden Courts of Kensington is a 64-bed memory care community at 4301 Knowles Avenue in Kensington, Maryland, serving the Montgomery County area. Owned by HCR ManorCare, the facility specializes in care for individuals living with Alzheimer’s disease and related dementias, providing a service model that encompasses dedicated memory care, assisted living, and short-term respite stays.
The Maryland Department of Health, Office of Health Care Quality, oversees regulatory compliance for the community. Current 2026 filings show the facility maintains a citations-per-inspection rate of zero, and records indicate that no civil money penalties or payment denials have been imposed by CMS within the past three years. While specific occupancy figures and monthly pricing are not reported in the available source data, the 64-bed capacity is dedicated to a residential setting designed to support resident independence through secure, specialized spaces.
Support is provided 24/7 by a professional team trained specifically in dementia care protocols to manage the complex needs of residents with cognitive decline. The facility design utilizes a residential living model intended to foster a familiar, low-stress environment while ensuring 24-hour monitoring and safety. Because specific data points such as caregiver-to-resident ratios, licensed nurse hours, and comparative quality measures, including fall rates or psychotropic medication use, are not currently reported, these represent information gaps that require direct inquiry.
The community features secure indoor and outdoor spaces designed specifically for those with memory impairment, though specific lists of on-site amenities and dining program details are not publicly listed. Standard services for this care level typically include assistance with all activities of daily living, housekeeping, and meal service.
Shared common areas are structured to encourage social engagement while maintaining safety. Families must confirm the specific suite layouts and emergency call system features during an on-site tour, as these details are not captured in current reporting.
Those seeking specialized dementia care in a dedicated residential environment may find this community appropriate. Interested individuals should confirm Medicaid acceptance, current occupancy status, and the full inspection history directly with the Maryland Department of Health before making a placement decision.
Ingleside at King Farm – Fountainside is a 46-bed assisted living and memory care community located at 701 King Farm Boulevard in Rockville, Maryland. Serving older adults in Montgomery County, the facility operates as a nonprofit community within a continuum-of-care campus that includes skilled nursing, rehabilitation, and home care services.
Nursing hours at this facility are reported above Maryland state averages across several categories. RN hours are 41% above the state average, LPN hours are 15% above, and nurse aide hours are 32% above. Physical therapist hours are reported at three minutes per resident per day, which is below the state average of five minutes. Quality metrics indicate that long-stay residents experience hospitalizations and emergency department visits at rates 37% and 44% below the Maryland average. Short-stay residents show a discharge-to-home rate of 59.8% compared to the state average of 50.6%.
The Maryland Department of Health, Office of Health Care Quality, oversees the inspection of this facility. The community maintains a citations-per-inspection rate of 0.0. Records show that no civil money penalties or payment denials have been imposed by CMS within the past three years.
The community holds CARF accreditation and SAGECare Platinum certification. Specific details regarding on-site dining, daily activities, and monthly pricing are not reported in the available source data, so families should request these details during a tour. Occupancy levels and payment options are also not publicly listed in the current records.
Families seeking nonprofit assisted living or memory care with a focus on nursing staffing levels and quality performance measures may find this setting suitable. Families evaluating Ingleside at King Farm – Fountainside should confirm Medicaid acceptance, current occupancy, and the full inspection history directly with the Maryland Department of Health before making a placement decision.
Overview of Modena Reserve Bethesda


Modena Reserve Bethesda is a 113-bed assisted living and memory care community at 4907 Rugby Avenue in Bethesda, Maryland, serving the Montgomery County area. Operated by Solera Senior Living, the for-profit facility is situated in the walkable Woodmont Triangle neighborhood and specializes in providing a hospitality-focused residential model alongside dedicated memory support.
The Maryland Department of Health, Office of Health Care Quality, oversees regulatory compliance for the facility. Current 2026 filings show that the community maintains a citations-per-inspection rate of zero, and federal records indicate that no civil money penalties or payment denials have been imposed by CMS within the past three years. While specific occupancy figures are not reported in the available source data, the facility is designed to accommodate a diverse range of care needs through its 113 licensed beds. Families should confirm the current administrator and Medicaid acceptance directly with the community as these details are not publicly listed.
Direct support is provided 24 hours a day by a professional team that includes security personnel and care partners. The community features specialized memory care programming and life enrichment activities designed to maintain resident engagement and cognitive function. Clinical services are supported by a 24-hour emergency call system in every suite, ensuring rapid response for residents requiring immediate assistance with activities of daily living such as dining, dressing, or mobility. Specific licensed nurse hours and comparative quality measures are not currently reported because families are encouraged to request the full inspection history from the Maryland Department of Health to assess clinical performance standards.
The facility features high-end residential spaces including rooftop decks, a fitness center, and a movie theater. Culinary services are provided across multiple on-site venues such as a formal dining room, a cafe, and a pub, where residents can enjoy social interaction alongside chef-prepared meals. Other on-site resources include a full-service beauty and barber shop, a library, and a multipurpose great room for community events. The monthly service package includes daily housekeeping and linen services to support a maintenance-free lifestyle. For medical appointments and local outings, the facility provides scheduled transportation within the Bethesda area to ensure residents remain connected to the local community.
Those seeking an upscale urban environment with a wide range of on-site recreational spaces and 24-hour hospitality-focused care may find this community appropriate. Interested individuals should confirm current availability and request the complete state inspection record before making a placement decision.
Overview of Residences at Creekside (village at Robinwood)
Residences at Creekside is a 90-bed senior living community at 19800 Tranquility Circle in Hagerstown, Maryland, serving Washington County. Situated within the Village at Robinwood campus, the for-profit community offers a full continuum of care, including independent living, assisted living, skilled nursing, and rehabilitation services.
The Maryland Department of Health, Office of Health Care Quality, oversees regulatory compliance for the facility. While the current source data does not list a specific deficiency history, the community maintains a citations-per-inspection rate of zero. Furthermore, federal records indicate that no civil money penalties or payment denials have been imposed by CMS within the past three years. This lack of reported enforcement actions suggests a stable regulatory standing, though families should verify the full inspection history directly with state authorities.
Nursing and professional care staff are available to support residents across the care continuum, with a particular focus on on-site rehabilitation for those requiring post-acute clinical support. Because specific data points such as staffing ratios, licensed nurse hours, and quality measures, like fall rates or pressure ulcer prevalence, are not currently reported, these represent significant information gaps. Clinical services are integrated into the larger village campus to facilitate transitions between residential and skilled nursing environments.
The community features a residential model designed for long-term stability, allowing residents to age in place as their medical needs evolve. Specific details regarding dining programs, all-inclusive utility packages, and daily social activities are not publicly listed in the current data set.
Shared community spaces and campus-wide security are standard for this level of care, but families must inquire about specific apartment square footage and safety features. Scheduled transportation and housekeeping services are common in such multi-level campuses, yet these should be confirmed during an on-site visit.
The availability of multiple care levels on a single campus provides a predictable path for long-term residency. Individuals evaluating Residences at Creekside should confirm the current license status, Medicaid acceptance, and the facility’s most recent comprehensive survey results directly with the Maryland Department of Health before making a placement decision.
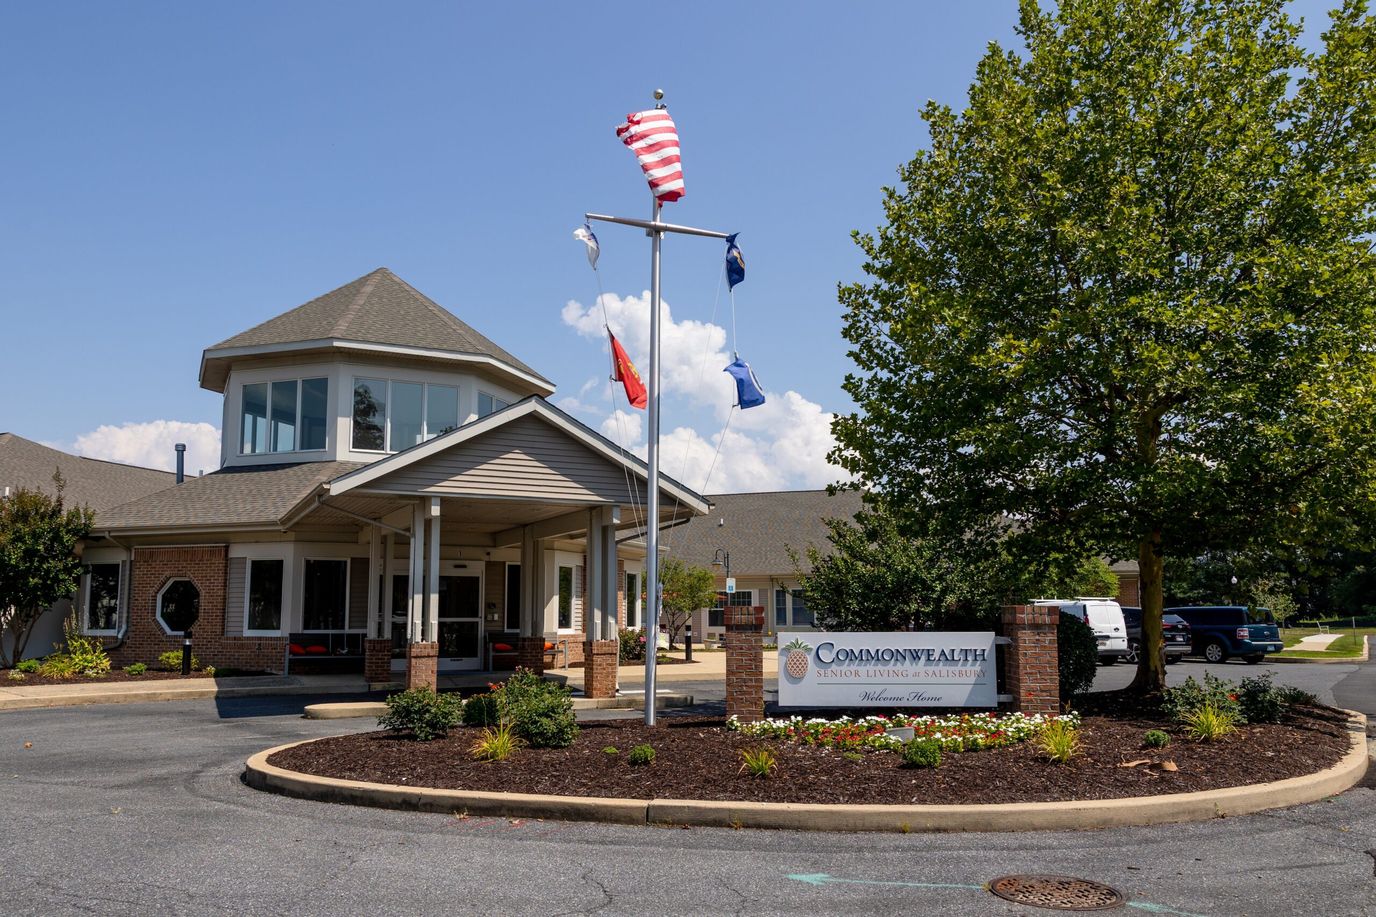
Overview of Commonwealth at Salisbury

Commonwealth at Salisbury is an 81-bed assisted living and nursing community located at 611 Tressler Drive in Salisbury, Maryland. Serving older adults in Wicomico County, the facility is operated by Commonwealth Senior Living as a for-profit community.
Monthly pricing at the facility starts at $3,350. Current occupancy figures are not reported in the available source data, so families should inquire directly regarding availability and waitlist status.
The Maryland Department of Health, Office of Health Care Quality, oversees the licensure and inspection of this facility. No specific inspection history is available in the current source data, and the facility maintains a citations-per-inspection rate of zero. Records show that no civil money penalties or payment denials have been imposed by CMS within the past three years.
The community provides 24-hour staffing, an emergency call system, and clinical services including rehabilitation, short-term rehab, and respite care. Accommodations consist of private and companion suites with daily housekeeping and weekly linen services included. The dining program features meals prepared on-site, and programming includes social events, trips, and short-term stay options. Pets are permitted.
This community suits families seeking assisted living or nursing-level care in a residential setting. Families evaluating Commonwealth at Salisbury should confirm Medicaid acceptance and request the full inspection record directly from the Maryland Department of Health before making a placement decision.
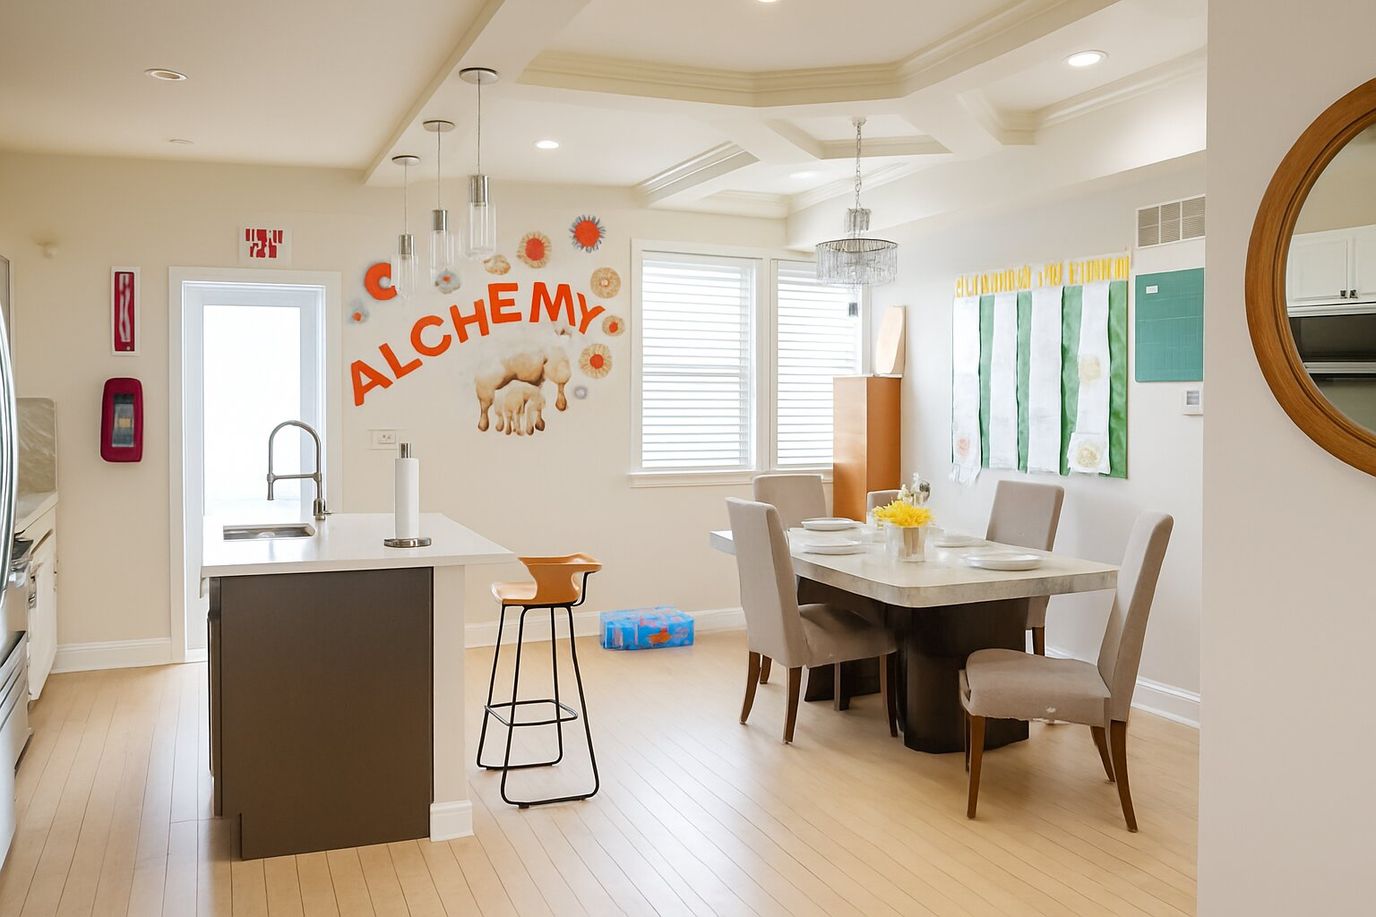
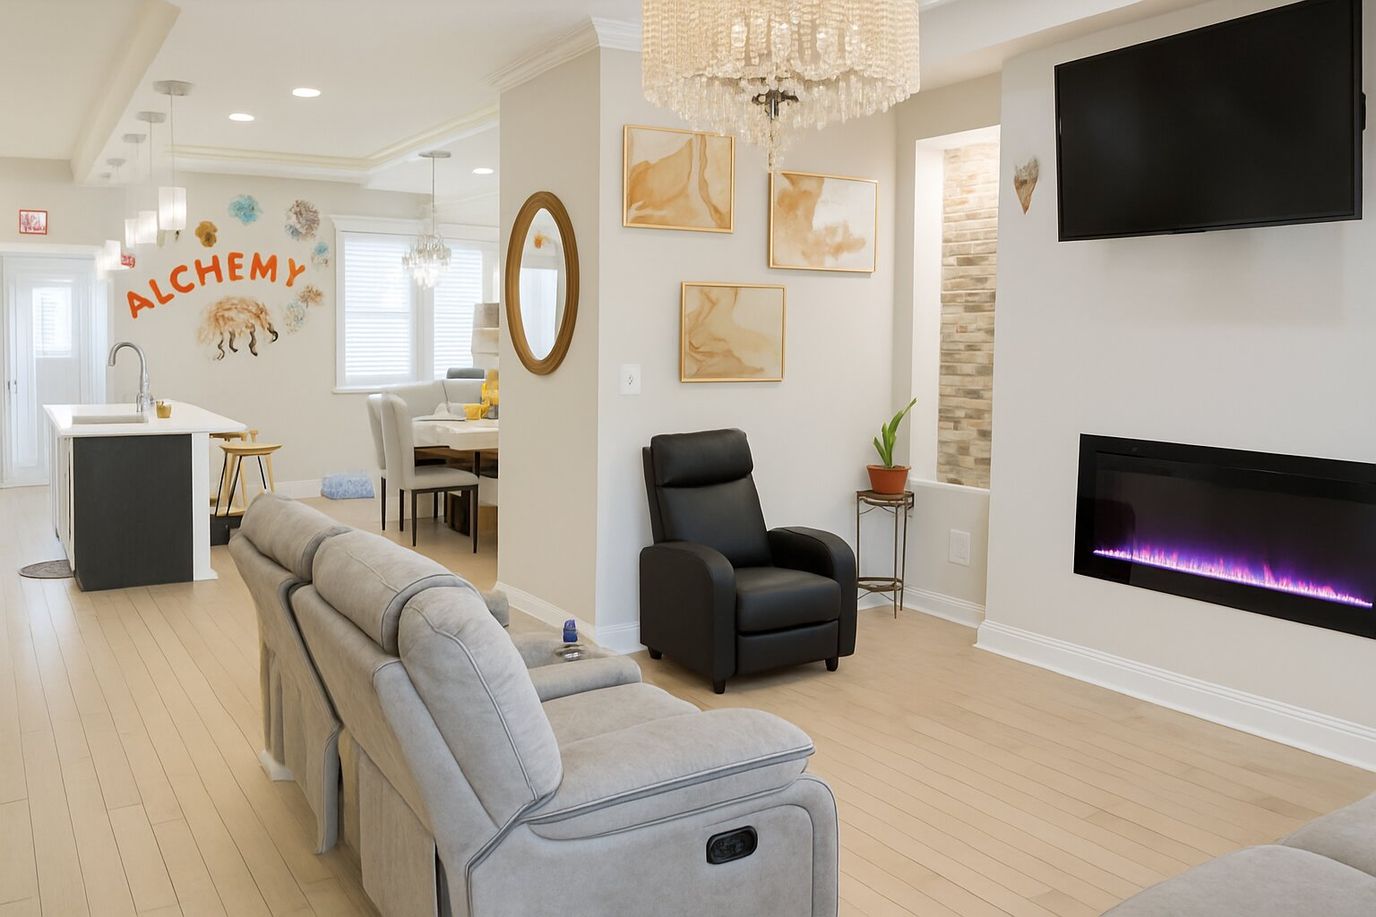
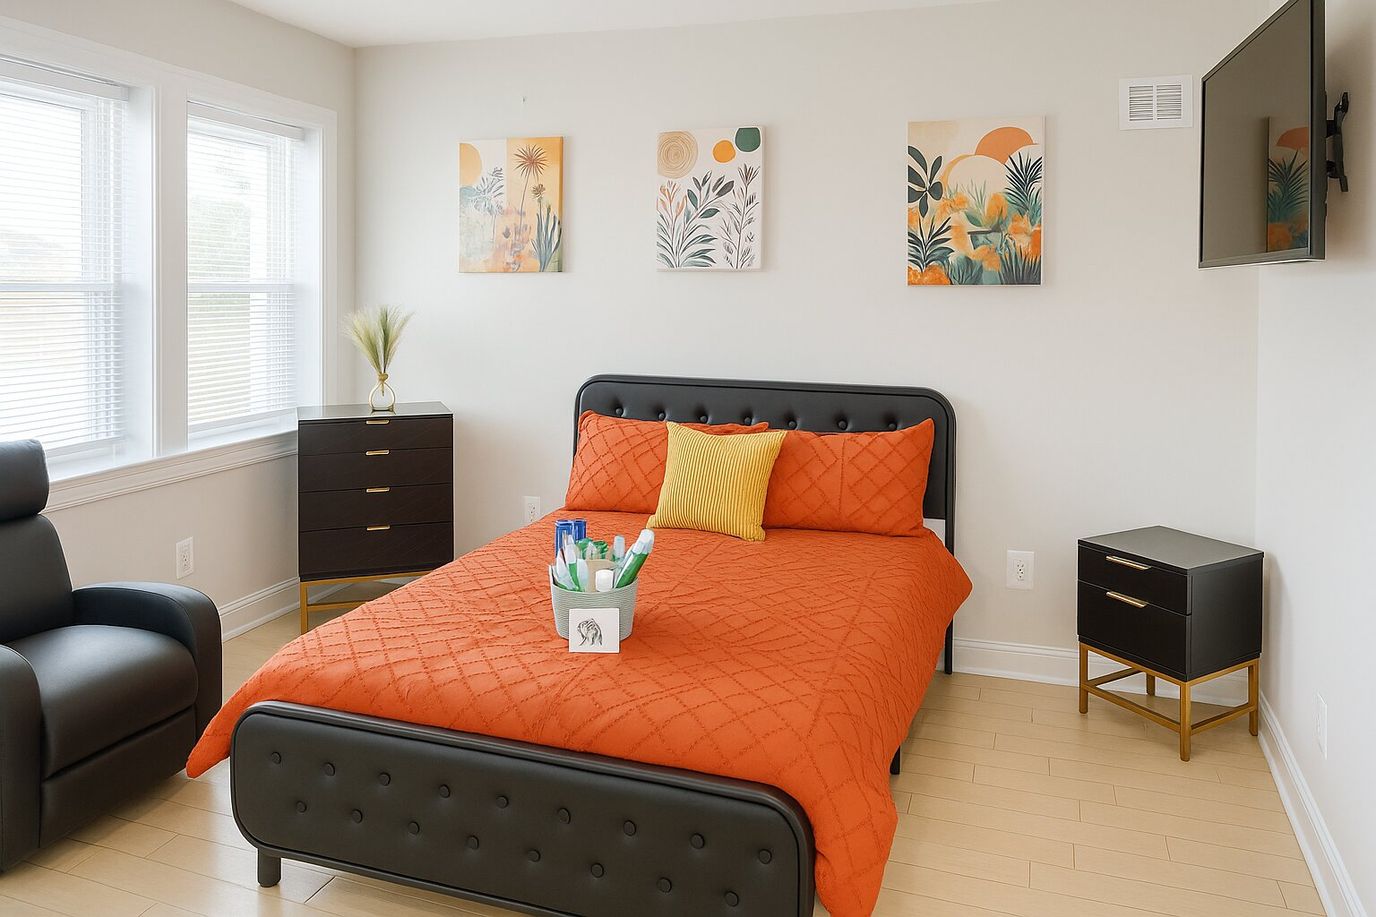
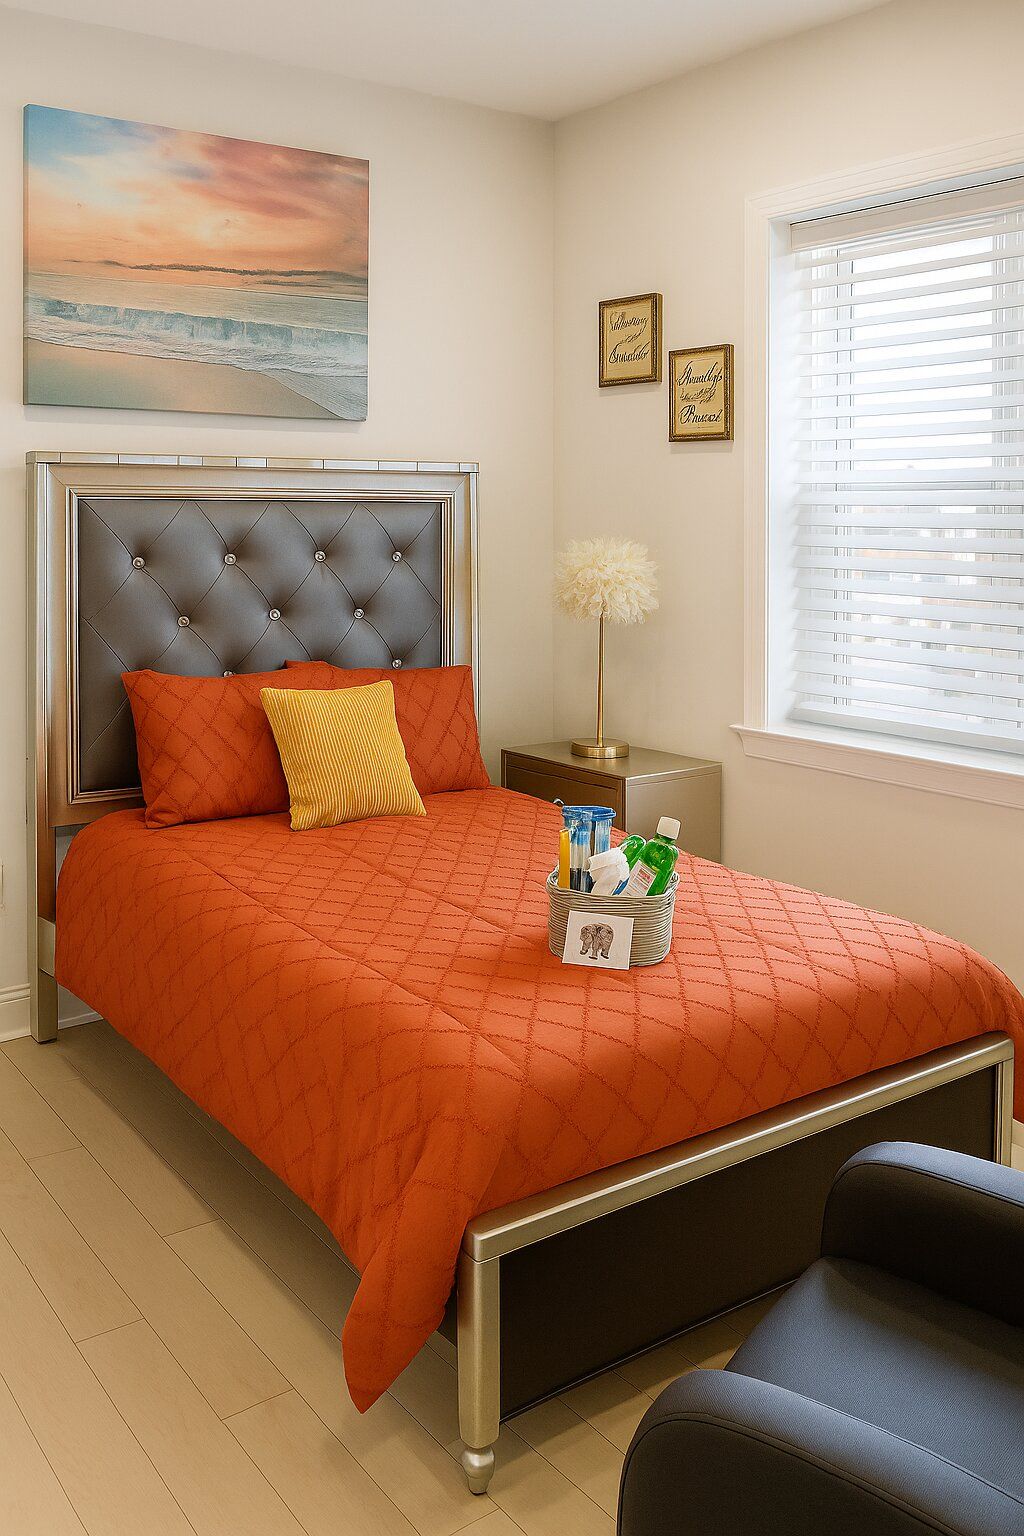
Alchemy Assisted Living is an assisted living community in Baltimore, MD, offering personal care and comprehensive medical care. Promoting a comfortable and home-like setting, the community ensures older adults are well-cared for. Housekeeping, medication management, and well-balanced home-cooked meals are among the exceptional services provided to help residents maintain their independence. Combining compassionate and professional medical care, the community strives to meet residents’ unique needs and preferences.
Games, social activities, and outings foster interaction and encourage residents to live actively. Residents can also rest and connect with their surroundings in cozy rooms and lively gathering areas. Set in the peaceful residential area of Baltimore, the community ensures residents have a laid-back lifestyle. This assisted living community is a great choice for senior living in Maryland, especially with its commitment to helping older adults thrive in retirement.
Sunny Springs Assisted Living LLC in Randallstown, MD, is an assisted living community that offers personal care. Here, older adults can feel at home, especially with a nurturing and welcoming environment. Three well-balanced meals daily, 24-hour care, and an emergency call system are among the exceptional services provided to help maintain residents’ independence. Focusing on residents’ holistic wellness, the community provides personalized care plans tailored to their unique needs and habits.
Educational programs, fun events, and exercises encourage residents to live actively and have fun. Spacious outdoor areas and cozy indoor spaces also ensure residents can rest and move around comfortably. Located in the quiet neighborhood of Randallstown, the community guarantees a laid-back lifestyle. This assisted living community is a great choice for senior living in Maryland, especially with its dedication to helping older adults live comfortably in their later years.
For more information visit their website
A Caring Place is an assisted living community in Parkville, MD, offering different levels of assisted living services. With a warm and home-like environment, older adults experience the utmost comfort throughout their stay. Housekeeping, laundry, three well-balanced meals daily, and a 24-hour emergency call system are among the exceptional services provided to improve residents’ quality of life. To meet residents’ unique needs and preferences, individualized care plans are also provided, along with a certified team.
Low-impact exercises, social events, and educational programs provide residents with more opportunities to explore hobbies and gain meaningful experiences. Residents can also freely interact with friends and rest in the cozy communal areas and spacious rooms. Located along Perring Parkway, near fast-food chains and shops in Parkville, the community guarantees accessibility and convenience. This assisted living community is a great choice for senior living in Maryland, especially with its high standards of care.
For more information visit their website
Ranking Methodology
How we rank these memory care communities
Every community above is evaluated across six weighted categories using public data including state inspection records, review platforms, BBB profiles, and operator-published materials.
Weighting overview
- 35%Resident Experience
- 25%Regulatory
- 15%Visual Media
- 10%Website
- 10%Stability
- 5%Environment
01
Resident & Family Experience 35%
The single largest share of every ranking. Aggregated review sentiment and volume from major platforms — the closest signal to real resident experience.
- Includes
- Review Sentiment
- Review Volume
02
Regulatory & Safety Record 25%
State inspection records, citations, and complaint visits. We weight per-inspection rates more heavily than raw counts.
- Includes
- State Inspections
- Citations/Inspection
- % Inspections w/ Citations
- Complaint Visits
- Accreditations
- BBB Rating
03
Visual Media & Transparency 15%
Communities that publish high-quality visuals give families a real preview. No photos or tours = a negative transparency signal.
- Includes
- Video Tours
- Virtual Walkthroughs
- Photo Quantity
- Photo Quality
04
Website & Operator Transparency 10%
Site quality and whether the operator publishes basic accountability information — staff names, contact details, ownership.
- Includes
- Website Content
- Mobile Usability
- Staff Info Available
- Owner Info Available
05
Community Stability 10%
Operational signals indicating whether a community is well-run and meeting demand.
- Includes
- Occupancy Rate
- Bed Options
06
Environment & Pricing 5%
Walkability and pricing transparency. Walk Score is weighted higher for Independent Living than for Memory Care, where most residents do not leave unaccompanied.
- Includes
- Walk Score
- Pricing Transparency
Who we are
Your Senior Care Partner, Every Step of the Way
We help families find affordable senior communities and unlock same day discounts, Medicaid, and Medicare options tailored to your needs.
Contact us Today
Frequently Asked Questions about Memory Care in Maryland
What's the difference between assisted living and memory care in Maryland?
Assisted living in Maryland supports residents with daily activities (bathing, dressing, medication management) while preserving independence. Memory care is a specialized form of assisted living for residents living with Alzheimer's or dementia, and adds 24/7 secured environments, dementia-trained staff, and structured routines designed to reduce confusion and wandering.
Does Maryland Medicaid cover memory care?
Maryland Medicaid does not directly pay room-and-board for memory care, but most states (including Maryland) offer Home and Community-Based Services (HCBS) waivers that can offset the cost of care services delivered inside a licensed community. Eligibility, waitlists, and covered services vary — check directly with the state Medicaid agency.
What is memory care?
Memory care is a specialized form of assisted living for residents living with Alzheimer's disease or other forms of dementia, with secured environments, dementia-trained staff, and routines built to reduce confusion and wandering.
How many memory care communities are listed on this page?
This page features 310 memory care communities in Maryland. Use the filters and comparison tools above to compare ratings, amenities, and pricing.
How do I choose the right memory care community in Maryland?
Start by matching the level of care offered to the resident's current and anticipated needs, then compare licensing status, staff-to-resident ratios, recent inspection results, and pricing. Tour at least two or three communities in Maryland, talk to current residents and families, and confirm what is included in the base rate versus billed as add-on services.
What should I look for when visiting memory care communities in Maryland?
Pay attention to staff interactions with residents, cleanliness and odor, food quality at meal times, the activity calendar, and how questions about pricing and care plans are answered. Ask to see the most recent state inspection report, the move-out / level-of-care-change policy, and a sample monthly bill that lists every fee.
Updated on
