Holiday Devonshire Estates
Nursing Home & Independent Living · Massachusetts, MA
CMS overall rating Info CMS (the Centers for Medicare & Medicaid Services) is the federal agency that rates nursing home quality. Its Overall Rating runs from 1 to 5 stars, combining health inspections, staffing, and quality measures, with inspections weighted most heavily.

Holiday Devonshire Estates

Nursing Home & Independent Living · Massachusetts, MA
CMS overall rating Info CMS (the Centers for Medicare & Medicaid Services) is the federal agency that rates nursing home quality. Its Overall Rating runs from 1 to 5 stars, combining health inspections, staffing, and quality measures, with inspections weighted most heavily.
Calculator: See prices in your area
Holiday Devonshire Estates accepts Medicare, Medicaid, and private pay.

Overview of Holiday Devonshire Estates

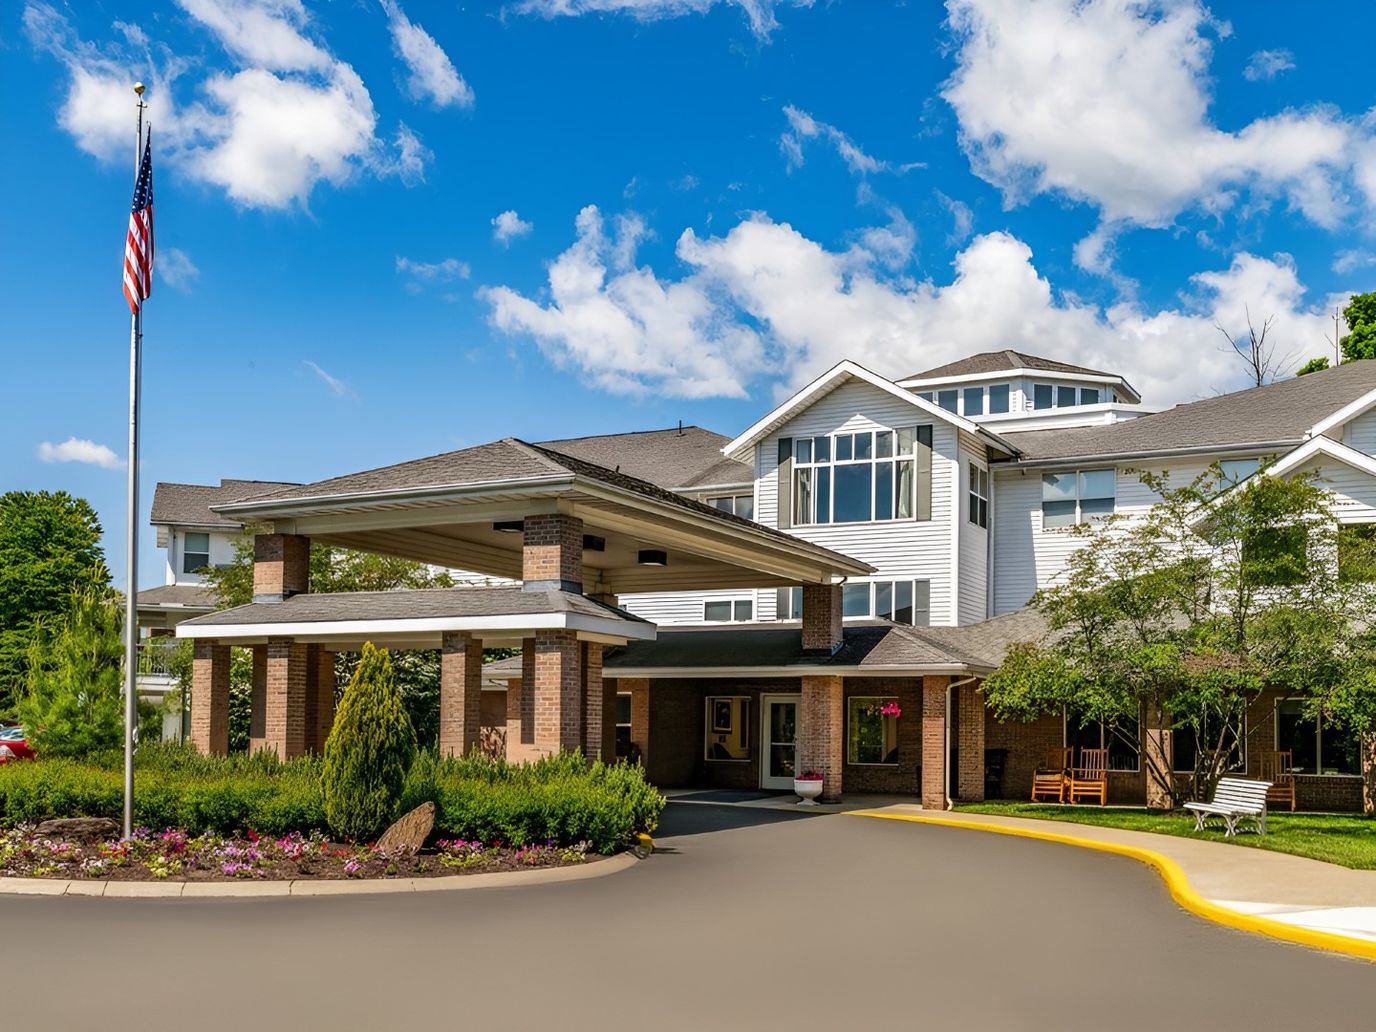
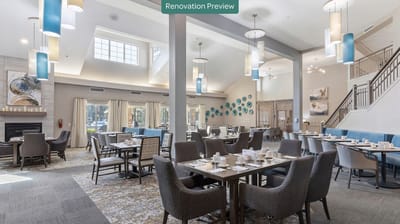
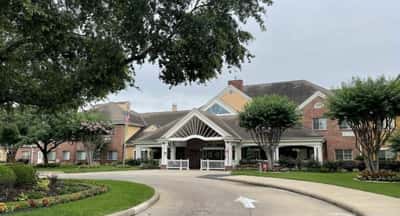
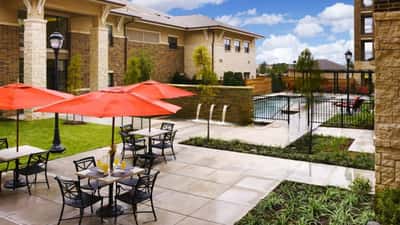
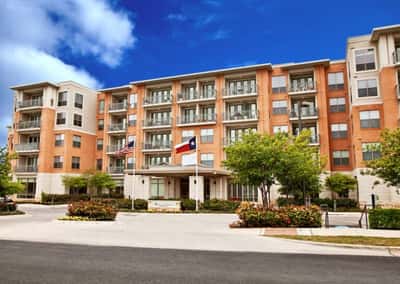
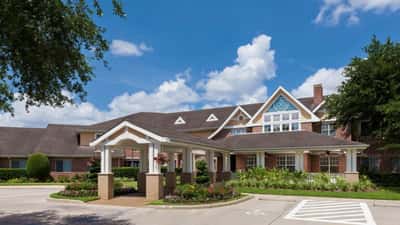
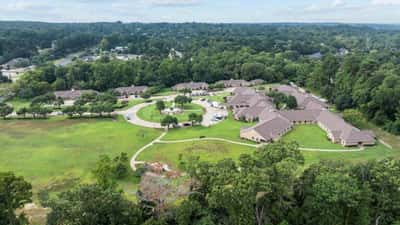
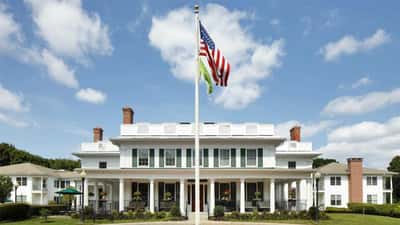
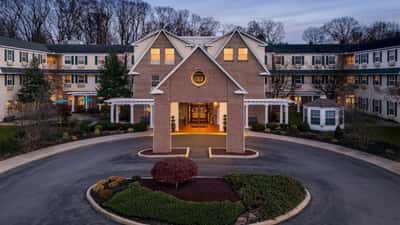
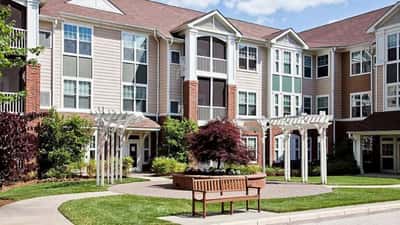
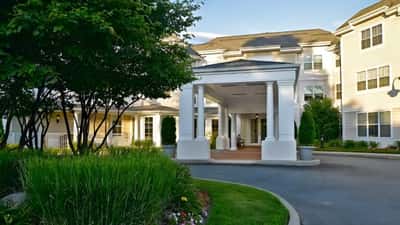
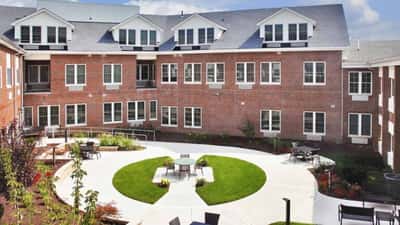
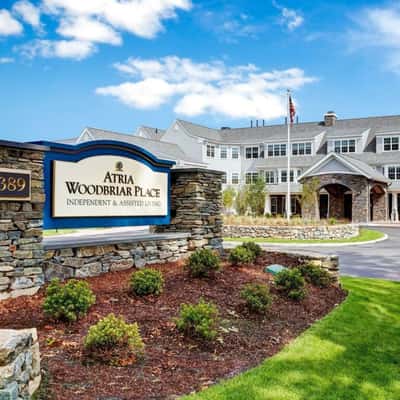
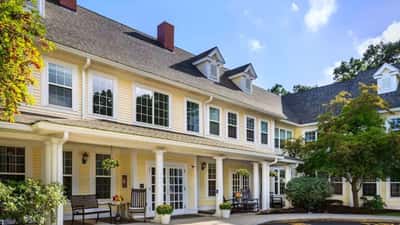
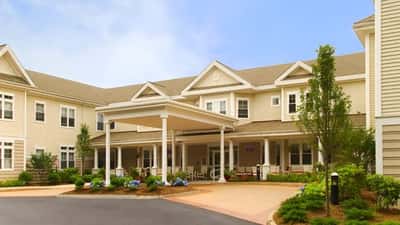
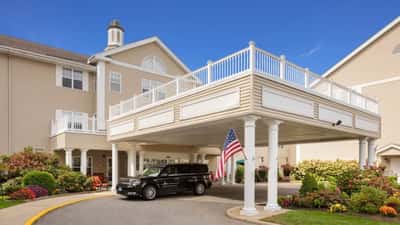
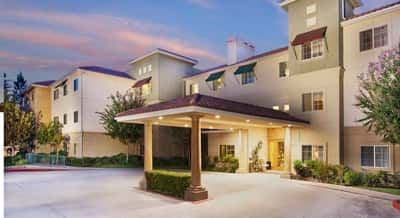
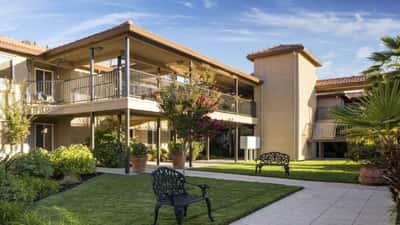
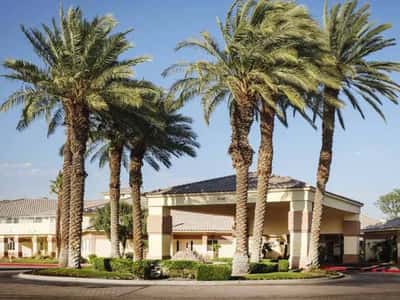
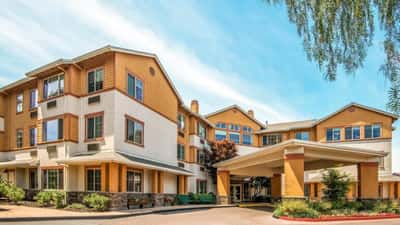
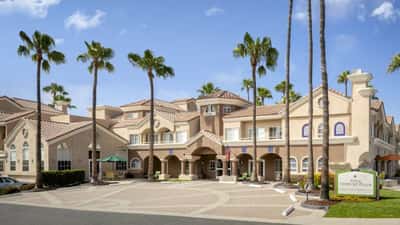
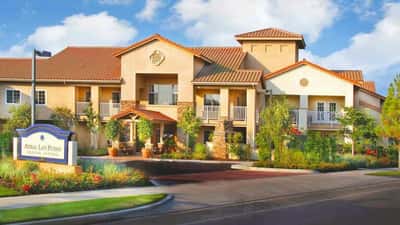
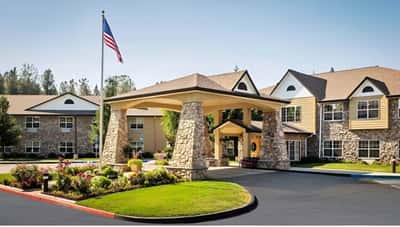
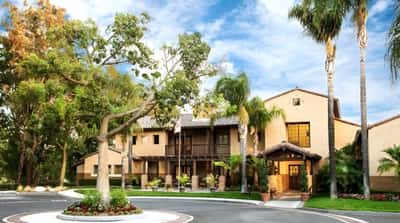
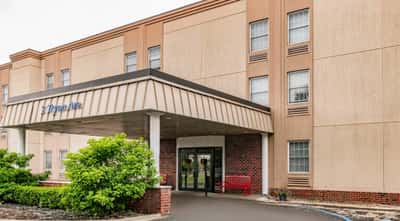
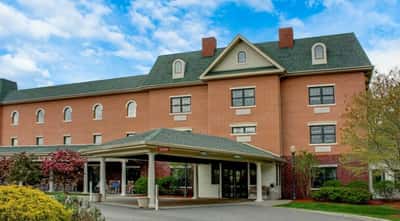
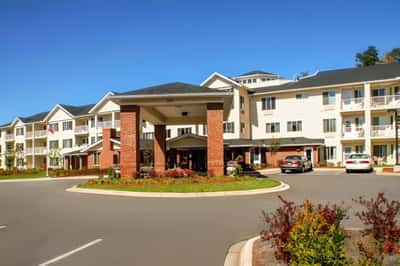
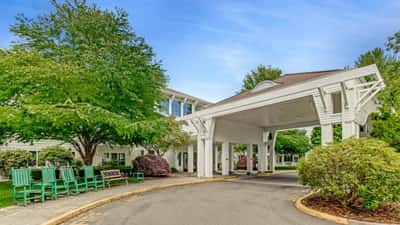
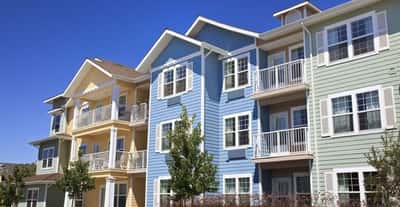
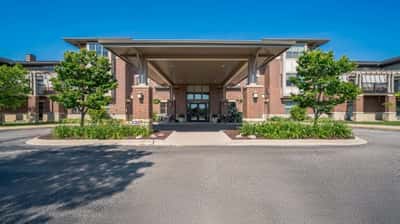
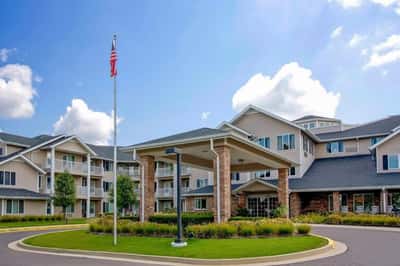
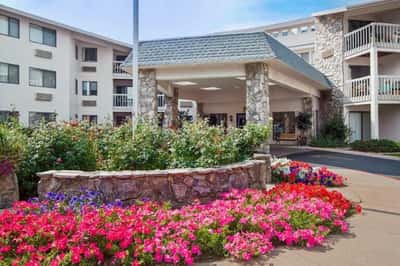
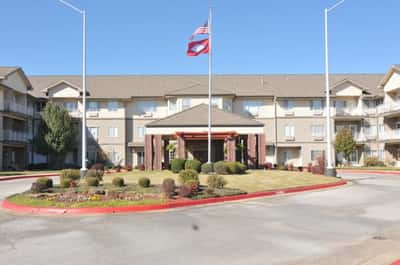
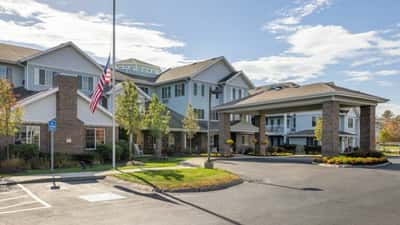
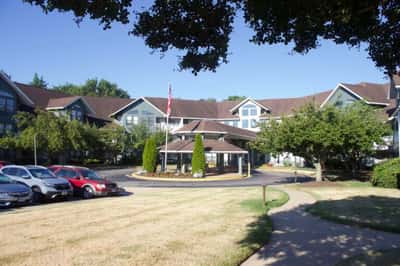
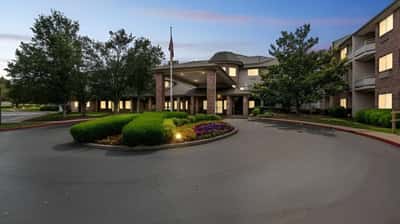
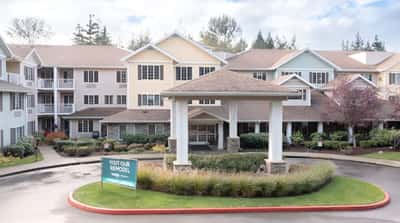
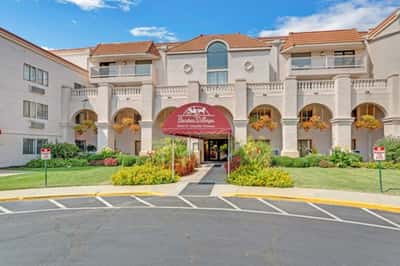
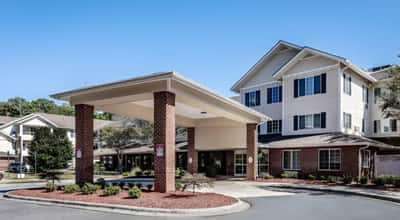
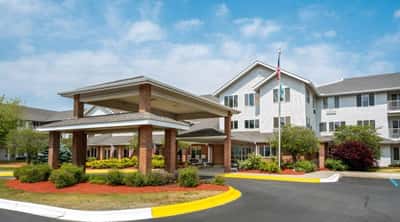
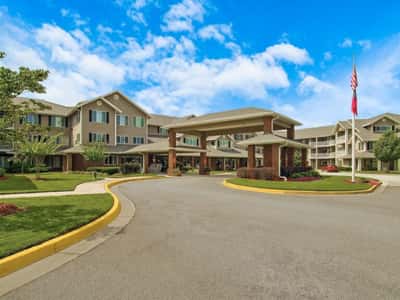
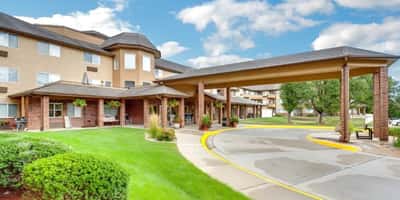
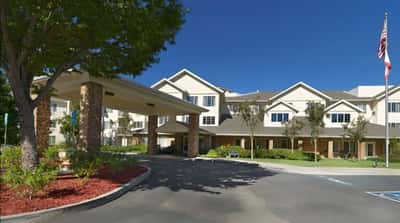
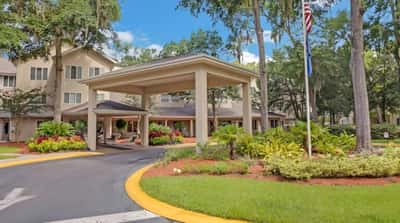
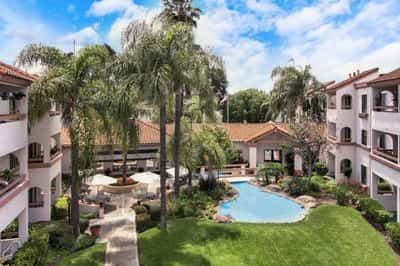
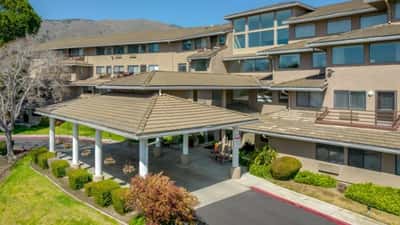
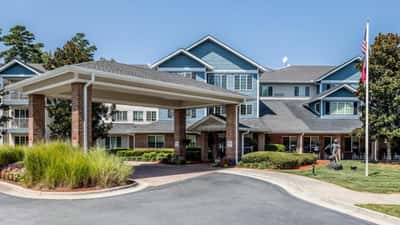
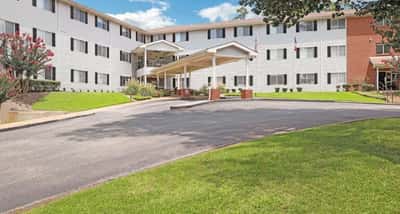
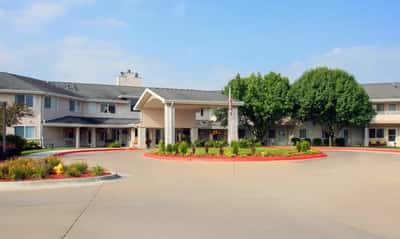
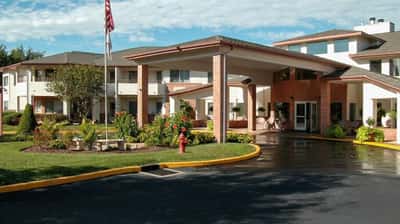
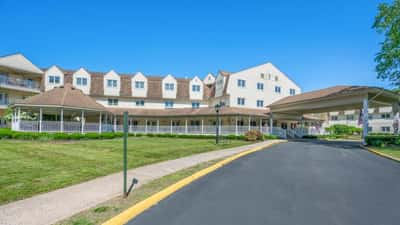
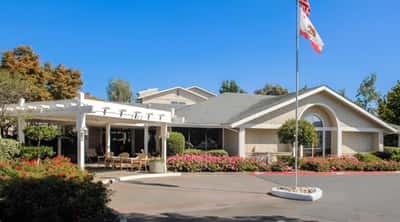
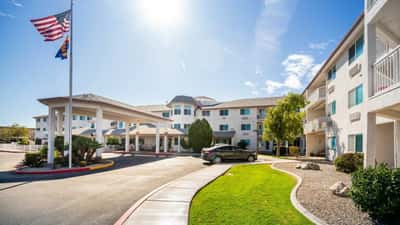
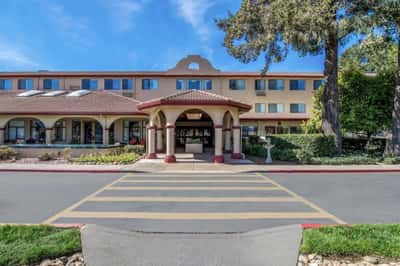
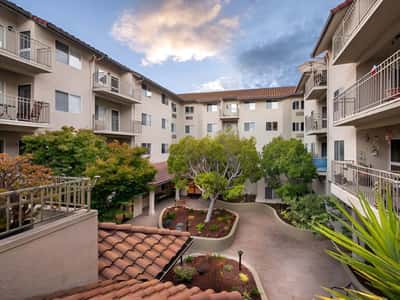
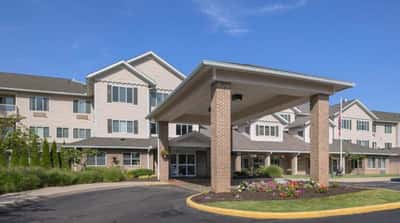
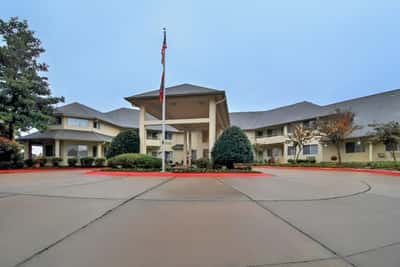
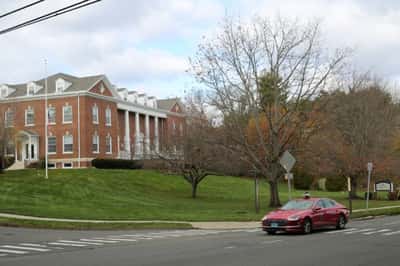
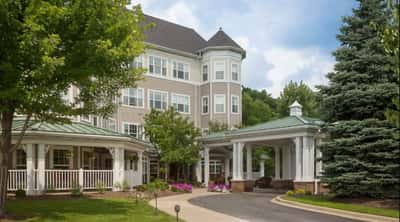
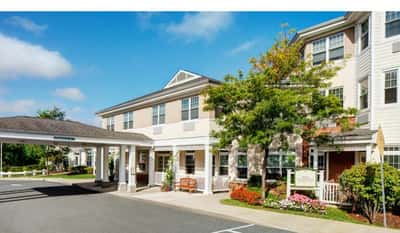
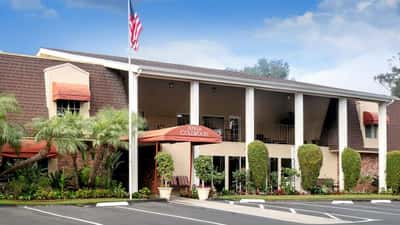
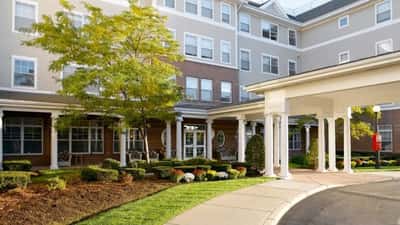
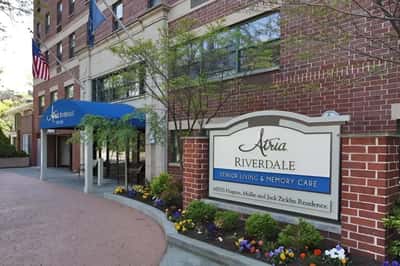
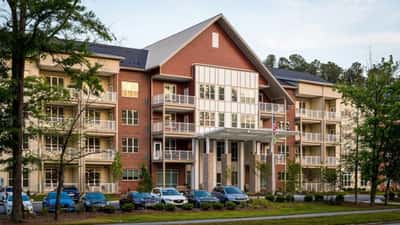
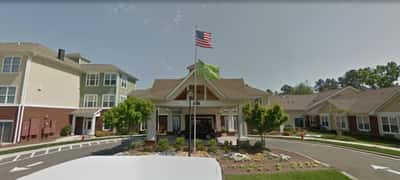
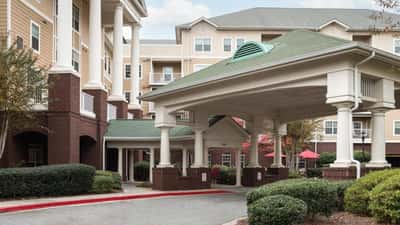
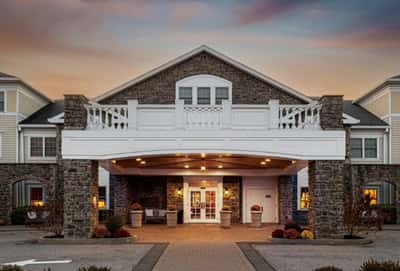
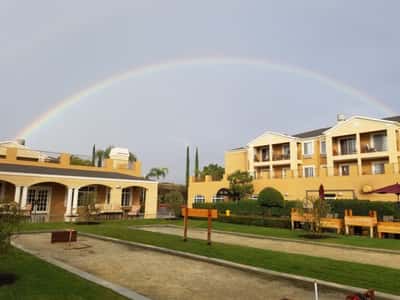
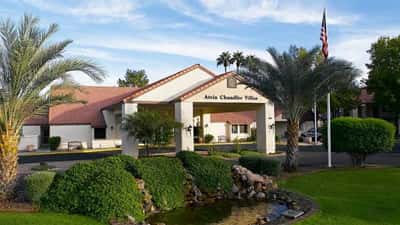
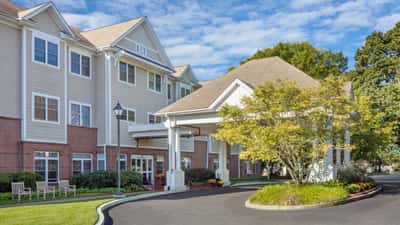
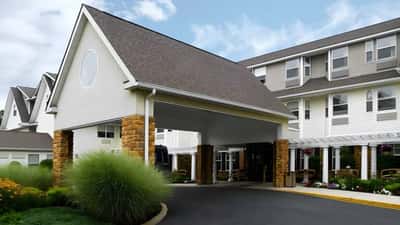
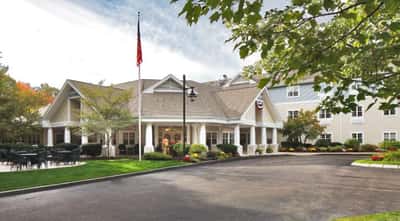
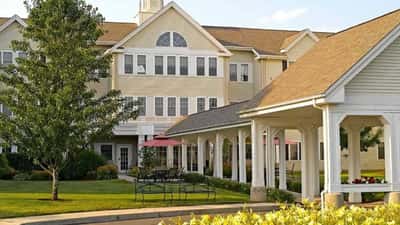
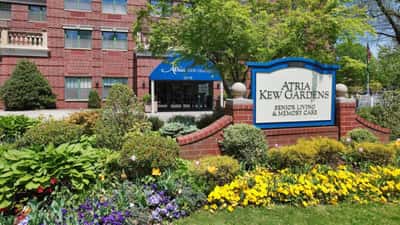
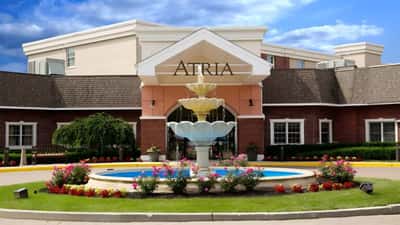
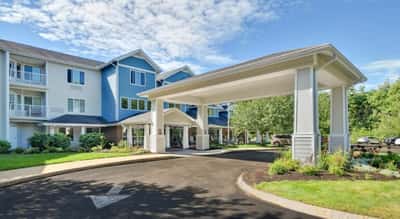
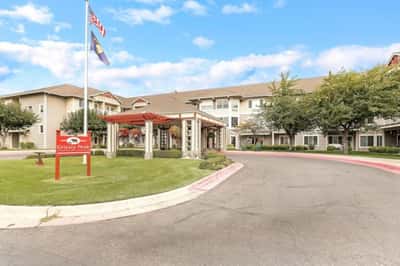
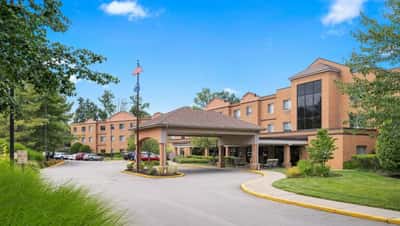
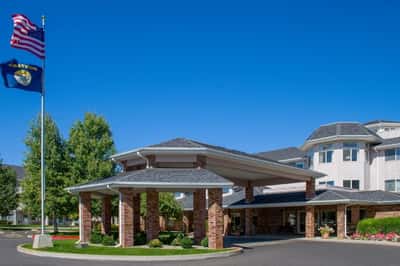
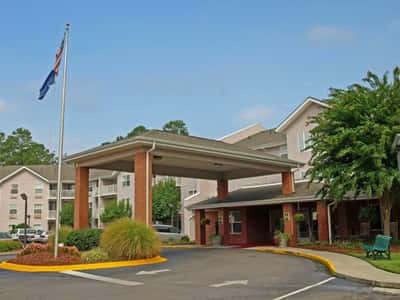
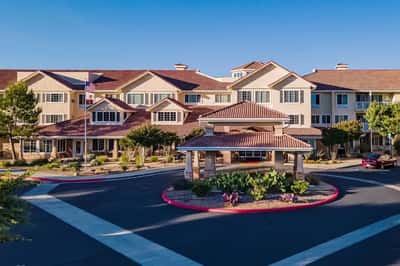
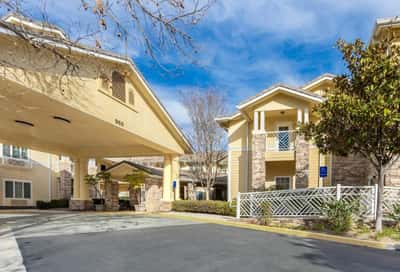
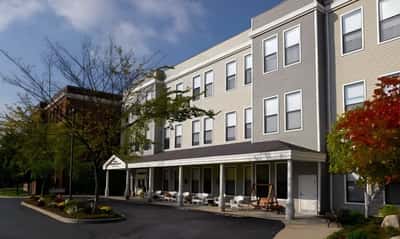
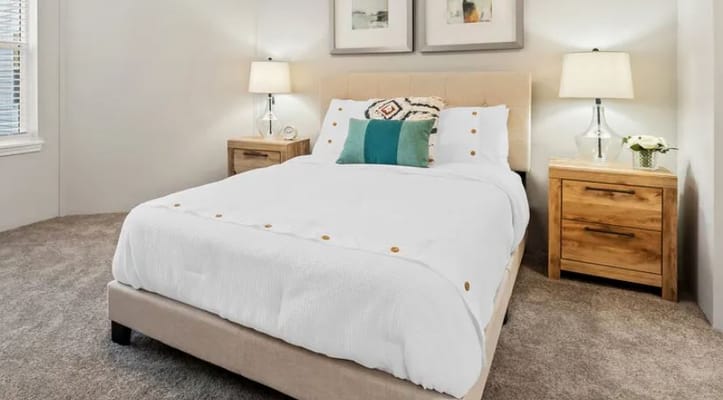
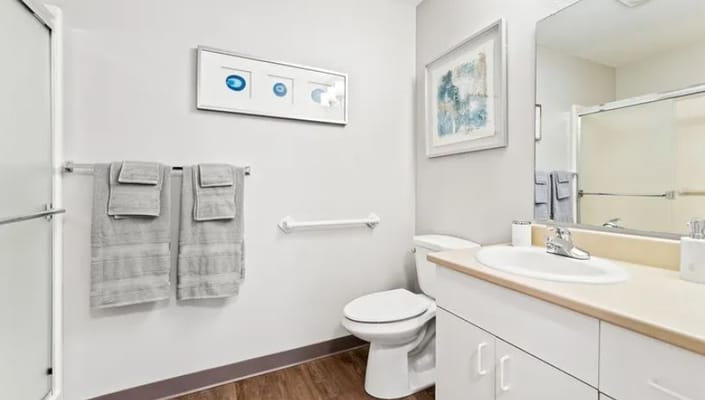
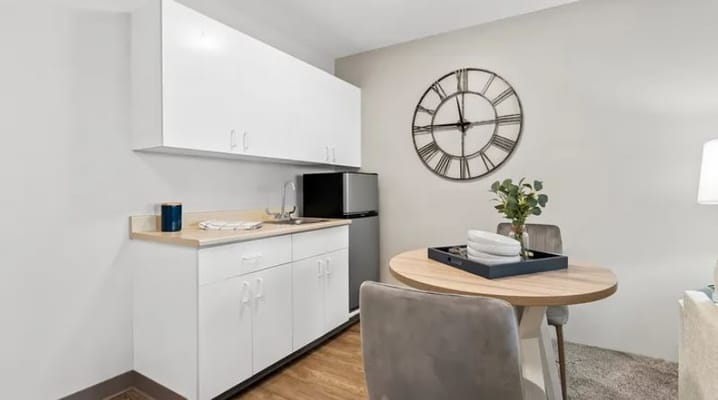
Situated in the peaceful neighborhood of Lenox, MA, Holiday Devonshire Estates provides exceptional independent living services and first-rate amenities. Residents live a comfortable lifestyle with daily fresh meals, housekeeping, and scheduled transportation. Various floor plans are available in the community, including studio, 1 and 2-bedroom apartments, and cottage homes with contemporary features and roomy floor plans.

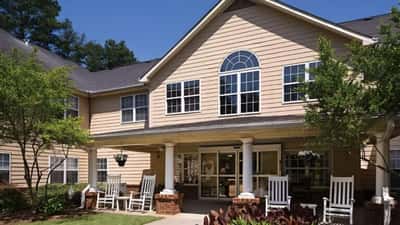
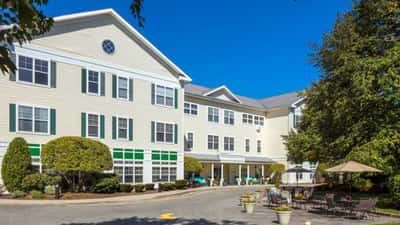
Holiday Devonshire Estates is dedicated to fostering a friendly and stimulating atmosphere. Therefore, it provides a full schedule of leisure and educational programs to keep residents’ brains and bodies engaged. Their goal is to create a friendly environment where people may flourish both intellectually and socially. For additional peace of mind, emergency response services are also offered around the clock. Holiday Devonshire Estates is a place to call home with its lovely surroundings and helpful personnel.

(413) 637-1700

Quality ratings

Measured by Centers for Medicare & Medicaid Services (CMS)

Overall rating Info The Overall CMS Rating combines results from health inspections, staffing levels and quality measures. Health inspections carry the most weight. Staffing and quality scores can increase or decrease the final rating based on performance compared to state and national standards.
▲ 3.5% Above MA avg. ▲ 3.5% Above MA avg.MA average: 2.9Click the badge to see the full State ranking.Click here to see the full State ranking.
Health Inspection Info Based on the results of the facility's three most recent standard inspections and any complaint investigations. CMS reviews the number, scope, and severity of deficiencies, with more recent findings weighted more heavily.
▲ 5.4% Above MA avg. ▲ 5.4% Above MA avg.MA average: 2.8Click the badge to see the full State ranking.Click here to see the full State ranking.
Staffing Info Measures average nursing staff hours per resident per day, including Registered Nurses (RNs) and total nursing staff. Ratings are adjusted based on the level of care residents require and are compared to state and national benchmarks.
At MA avg. At MA avg.MA average: 3.0Click the badge to see the full State ranking.Click here to see the full State ranking.
Quality Measures Info Based on clinical and physical health indicators reported to CMS, such as hospital readmissions, falls, pressure ulcers, and improvements in mobility. These measures reflect how well residents' health needs are being managed.
▼ 37.1% Below MA avg. ▼ 37.1% Below MA avg.MA average: 3.2Click the badge to see the full State ranking.Click here to see the full State ranking.

Staffing hours breakdown

Info Daily nursing hours per resident by staff type, reported to CMS. Higher is generally better — compare this facility to state and national averages to see where staffing stands.

Hours per resident per day — compared to Massachusetts state averages

Total nursing care / resident Info This home is ranked 24th out of 93 homes in Massachusetts for nurse hours. Total adjusted nursing hours per resident per day, combining RN, LPN, and aide time. CMS adjusts this for case-mix so facilities can be fairly compared.
4h 12m per day
Rank #24 / 93Nurse hours — State benchmarkedThis home is ranked 24th out of 93 homes in Massachusetts. Shows adjusted nurse hours per resident per day benchmarked to the Massachusetts average, with a ranking across 93 Massachusetts facilities. More hours mean more direct care. The national average is about 3.5 hrs; below 3.0 is a red flag.Ranking totals vary by category as each rank only includes facilities that report data for that metric. Homes missing that data point aren't included in the ranking.Click the rank badge to see the full State ranking.Click here to see the full State ranking.
This facility Massachusetts avg (3h 56m per day)
vs Massachusetts avg
+7%

1 of 6 metrics below state avg

Standout metric LPN / LVN is +48% above state avg
Staff typeHours / Day / Residentvs state avg
Registered Nurse (RN) Info RNs hold the highest nursing license and can assess residents, interpret test results, and direct care plans. More RN hours per day often signals stronger clinical oversight and faster response to health changes. 44m per day ▲ 13% State avg: 39m per day · National avg: 41m per day
LPN / LVN Info Licensed Practical Nurses (LPNs) or Licensed Vocational Nurses (LVNs) deliver routine hands-on care — medication administration, wound dressing, and monitoring vital signs. They work under RN supervision and make up a large share of daily bedside care. 1h 25m per day ▲ 48% State avg: 57m per day · National avg: 52m per day
Nurse Aide Info Certified Nurse Aides (CNAs) provide the most direct day-to-day assistance: bathing, dressing, feeding, and mobility. Nurse aide hours are typically the largest staffing category and directly affect residents' quality of life. 2h 4m per day ▼ 9% State avg: 2h 16m per day · National avg: 2h 20m per day
Weekend Total Nursing Info Combined nursing hours (RN + LPN + Nurse Aide) per resident per day on weekends. Staffing often drops on weekends — this figure reveals whether the facility maintains adequate coverage outside of weekday hours. 3h 56m per day ▲ 13% State avg: 3h 29m per day · National avg: 3h 27m per day
Physical Therapist Info Hours per resident per day provided by licensed Physical Therapists (PTs) or PT Assistants. PT services help residents recover mobility after injury or illness and are especially important for post-acute (short-stay) rehabilitation. 6m per day ▲ 28% State avg: 5m per day · National avg: 4m per day
Weekend RN Info Registered nurse hours specifically on weekends. Facilities sometimes reduce RN presence on Saturdays and Sundays — a low weekend RN figure compared to weekday hours can indicate reduced clinical oversight when most administrative staff are absent. 34m per day ▲ 26% State avg: 27m per day · National avg: 29m per day

Capacity and availability

This home usually has limited availability

Higher occupancy than the Massachusetts average: 82%
Occupancy rate
93.7% Rank #16 / 96Occupancy rate — State benchmarkedThis home is ranked 16th out of 96 homes in Massachusetts. Shows this facility's occupancy rate versus the Massachusetts average, with its Statewide rank out of 96. Higher occupancy signals strong local demand and financial stability.Ranking totals vary by category as each rank only includes facilities that report data for that metric. Homes missing that data point aren't included in the ranking.Click the rank badge to see the full State ranking.Click here to see the full State ranking.
Avg. Length of Stay
116 days
Bed community size
69-bed community Rank #191 / 280Bed count — State benchmarkedThis home is ranked 191st out of 280 homes in Massachusetts. Shows this facility's certified or reported bed count compared to other Massachusetts facilities. Larger communities may offer more amenities, programs, and on-site services for residents and families.Ranking totals vary by category as each rank only includes facilities that report data for that metric. Homes missing that data point aren't included in the ranking.Click the rank badge to see the full State ranking.Click here to see the full State ranking.
A moderately sized community that may balance personal attention with shared amenities and social activities.
Walk Score
Walk Score: 30 / 100 Rank #360 / 499Walk Score — State benchmarkedThis home is ranked 360th out of 499 homes in Massachusetts. Shows how walkable this facility's neighborhood is compared to the average Walk Score across Massachusetts facilities. Higher scores benefit residents, families, and staff.Ranking totals vary by category as each rank only includes facilities that report data for that metric. Homes missing that data point aren't included in the ranking.Click the rank badge to see the full State ranking.Click here to see the full State ranking.
Somewhat walkable. A few nearby services may be reachable on foot, but most trips require transportation.

About this community

Therapy & Rehabilitation

1 service
Respite Care

Amenities & Lifestyle

Housekeeping Service
Freshly Prepared Meals
Outdoor Views
Newly Renovated Spaces
Specific ProgramsHome Health, Engage Life® Events

Pricing & Financial Information

Starting Price$2,669 per month
Starting Price$3,909 per month

Dining & Nutrition

Food DescriptionHealthy meals are served three times daily, always with a side of warm conversation.

Contact Holiday Devonshire Estates

Staffing Data

Reporting period: October 1 – December 31, 2025 (Q4 2025). Source: CMS Payroll-Based Journal report.

Total staff 180
Employees 60
Contractors 120
Staff to resident ratio 3.00 : 1
81% more staff per resident than Massachusetts average
Massachusetts average ratio: 1.66 : 1 Massachusetts average ratio: 1.66 : 1See full Massachusetts ranking
Avg staff/day 38
Average shift 7.8 hours
0% compared with Massachusetts average
Massachusetts average: 7.9 hours Massachusetts average shift: 7.9 hoursSee full Massachusetts ranking
Total staff hours (quarter) 27,423

Nursing staff breakdown

Q4 2025 · Oct 1 – Dec 31 More info This data comes from the CMS Payroll-Based Journal report covering October 1 – December 31, 2025.
Registered Nurse

Manages medical care and health needs.

RN Staff Info 25 total: 7 full-time employees and 18 contractors. 25
Average shift length Info Average shift length. Calculated as total hours divided by days worked and average staff per day. 7.8 hours
Licensed Practical Nurse

Assists with medical care and medications.

LPN Staff Info 41 total: 17 full-time employees and 24 contractors. 41
Average shift length Info Average shift length. Calculated as total hours divided by days worked and average staff per day. 7.9 hours
Certified Nursing Assistant

Helps with daily care and mobility.

CNA Staff Info 91 total: 24 full-time employees and 67 contractors. 91
Average shift length Info Average shift length. Calculated as total hours divided by days worked and average staff per day. 8.3 hours

Contractor staffing

Q4 2025 · Oct 1 – Dec 31 More info This data comes from the CMS Payroll-Based Journal report covering October 1 – December 31, 2025.

Total hours from contractors

32.2%

8,820 contractor hours this quarter

Certified Nursing Assistant: 67 Licensed Practical Nurse: 24 Registered Nurse: 18 Physical Therapy Assistant: 2 Speech Language Pathologist: 2 Physical Therapy Aide: 2 Respiratory Therapy Technician: 1 Nurse Practitioner: 1 Qualified Social Worker: 1 Medical Director: 1 Occupational Therapy Assistant: 1

Staff by category

Q4 2025 · Oct 1 – Dec 31 More info This data comes from the CMS Payroll-Based Journal report covering October 1 – December 31, 2025.
Certified Nursing Assistant24679111,33592100%8.3
Licensed Practical Nurse1724416,37892100%7.9
Registered Nurse718253,36592100%7.8
RN Director of Nursing4041,3818896%8.4
Dietitian2029086470%8
Nurse Practitioner1126686470%8.7
Other Dietary Services Staff2026428592%7.6
Respiratory Therapy Technician0115376773%8
Physical Therapy Assistant0225247177%6.3
Administrator1014645863%8
Speech Language Pathologist0224186672%6.2
Mental Health Service Worker1013764751%8
Physical Therapy Aide0221863639%5
Occupational Therapy Aide1011693033%5.6
Qualified Social Worker011301617%1.8
Medical Director011261314%2
Occupational Therapy Assistant0111833%6
91 Certified Nursing Assistant
% of Days 100%
41 Licensed Practical Nurse
% of Days 100%
25 Registered Nurse
% of Days 100%
4 RN Director of Nursing
% of Days 96%
2 Dietitian
% of Days 70%
2 Nurse Practitioner
% of Days 70%
2 Other Dietary Services Staff
% of Days 92%
1 Respiratory Therapy Technician
% of Days 73%
2 Physical Therapy Assistant
% of Days 77%
1 Administrator
% of Days 63%
2 Speech Language Pathologist
% of Days 72%
1 Mental Health Service Worker
% of Days 51%
2 Physical Therapy Aide
% of Days 39%
1 Occupational Therapy Aide
% of Days 33%
1 Qualified Social Worker
% of Days 17%
1 Medical Director
% of Days 14%
1 Occupational Therapy Assistant
% of Days 3%

Penalties and fines

Includes penalties issued in 2024

Federal penalties imposed by CMS for regulatory violations, including civil money penalties (fines) and denials of payment for new Medicare/Medicaid admissions.

Source: CMS Penalties Database (Data as of Jan 2026)

Total fines amount $46K Rank #80 / 94Federal fines — State benchmarkedThis home is ranked 80th out of 94 homes in Massachusetts. Shows this facility's cumulative CMS federal fine dollars versus the Massachusetts average among facilities with fines, and where it ranks among 94 facilities in the pool. Lower total dollars mean a better rank.Ranking totals vary by category as each rank only includes facilities that report data for that metric. Homes missing that data point aren't included in the ranking.Click the rank badge to see the full State ranking.Click here to see the full State ranking.
36% lower than Massachusetts average

Massachusetts average: $72K

Number of fines 1
42% fewer fines than Massachusetts average

Massachusetts average: 1.7

Payment Denials Info Serious action where Medicare and/or Medicaid temporarily stops payments for new residents until issues are fixed. 0
100% fewer payment denials than Massachusetts average

Massachusetts average: 0.1

Fines amount comparison
This facility $46K
Massachusetts average $72K
Penalty History

Penalties are imposed by CMS for violations of federal nursing home regulations.

1 penalty in the past 3 years

Apr 10, 2024 · $46K

Civil Money Penalty Info Fines imposed for noncompliance, which can be assessed per day or per instance of violation. Apr 10, 2024
$46K

Last updated: Jan 2026

Quality of care over time

These measures show how residents usually do over time at this home, based on health outcomes and preventive care.

High-risk clinical events score Info A composite score based on pressure ulcers, falls with injury, weight loss, walking ability decline, and activities of daily living decline. 10.5
In line with Massachusetts average

Massachusetts average: 10.2

Functional decline score Info A composite score based on activities of daily living decline, walking ability decline, and incontinence. 18.3
8% better than Massachusetts average

Massachusetts average: 20.0

Long-stay resident measures
Need for Help with Daily Activities Increased Info Percent of long-stay residents whose need for help with daily activities has increased 18.8%
In line with Massachusetts average

Massachusetts average: 18.7%

Walking Ability Worsened Info Percent of long-stay residents whose ability to move independently worsened 13.7%
29% better than Massachusetts average

Massachusetts average: 19.3%

Low Risk Residents with Bowel/Bladder Incontinence Info Percent of low risk long-stay residents who lose control of their bowels or bladder 22.4%
In line with Massachusetts average

Massachusetts average: 22.1%

Falls with Major Injury Info Percent of long-stay residents experiencing one or more falls with major injury 5.6%
56% worse than Massachusetts average

Massachusetts average: 3.6%

High Risk Residents with Pressure Ulcers Info Percent of long-stay high risk residents with pressure ulcers 5.6%
19% worse than Massachusetts average

Massachusetts average: 4.7%

Urinary Tract Infection Info Percent of long-stay residents with a urinary tract infection 2.4%
17% worse than Massachusetts average

Massachusetts average: 2.1%

Lost Too Much Weight Info Percent of long-stay residents who lose too much weight 8.7%
69% worse than Massachusetts average

Massachusetts average: 5.2%

Depressive Symptoms Info Percent of long-stay residents who have depressive symptoms 8.8%
18% better than Massachusetts average

Massachusetts average: 10.7%

Antipsychotic Use Info Percent of long-stay residents who received an antipsychotic medication 20.1%
In line with Massachusetts average

Massachusetts average: 20.3%

Pneumococcal Vaccine Info Percent of long-stay residents assessed and appropriately given the pneumococcal vaccine 97.2%
6% better than Massachusetts average

Massachusetts average: 91.9%

Influenza Vaccine Info Percent of long-stay residents assessed and appropriately given the seasonal influenza vaccine 100.0%
5% better than Massachusetts average

Massachusetts average: 94.8%

Short-stay resident measures
Pneumococcal Vaccine Info Percent of short-stay residents assessed and appropriately given the pneumococcal vaccine 82.8%
8% better than Massachusetts average

Massachusetts average: 76.7%

Antipsychotic medication increase Info Percent of short-stay residents who newly received an antipsychotic medication 0.6%
55% better than Massachusetts average

Massachusetts average: 1.3%

Influenza Vaccine Info Percent of short-stay residents assessed and appropriately given the seasonal influenza vaccine 93.2%
20% better than Massachusetts average

Massachusetts average: 77.7%

Breakdown by payment type

Medicare

56% of new residents, usually for short-term rehab.

Typical stay 1 - 2 months

Private pay

31% of new residents, often for short stays.

Typical stay 3 - 4 months

Medicaid

13% of new residents, often for long-term daily care.

Typical stay 1 - 2 years

Facility Characteristics

Source: CMS Long-Term Care Facility Characteristics (Data as of Jan 2026)

Total residents 60
Medicare
7
11.7% of residents
Medicaid
42
70% of residents
Private pay or other
11
18.3% of residents
Programs & Services
Residents Group

Residents meet regularly to discuss policies, care quality, and activities

Active Resident Council

Organized group of residents that meets regularly to discuss facility policies, quality of life, and activities.

Finances and operations

Based on CMS SNF Cost Report for fiscal year ending in 12/2023.

Governmental community
Operated by state authorities.
Net patient revenue Info Net patient revenue — what the home actually collects for resident care, after contractual allowances, bad debt and discounts are subtracted from its gross charges (CMS cost report, Worksheet G-3). It covers resident care only; money the home earns from other sources is shown separately as "Other income."
$8.4M
Net patient income Info Net patient income: net patient revenue minus the home's total operating expenses. A positive figure means it earns more from resident care than it spends to deliver it; a negative figure means the opposite. It excludes non-operating "other income."
-$995.5K
Governmental community Operated by state authorities.
Net patient revenue Info Net patient revenue — what the home actually collects for resident care, after contractual allowances, bad debt and discounts are subtracted from its gross charges (CMS cost report, Worksheet G-3). It covers resident care only; money the home earns from other sources is shown separately as "Other income."
$8.4M Rank #89 / 96Revenue — State benchmarkedThis home is ranked 89th out of 96 homes in Massachusetts. Shows this facility's annual revenue compared to the Massachusetts average. Higher revenue generally means more resources for staffing and capital — read alongside Payroll %.Ranking totals vary by category as each rank only includes facilities that report data for that metric. Homes missing that data point aren't included in the ranking.Click the rank badge to see the full State ranking.Click here to see the full State ranking.
Net patient income Info Net patient income: net patient revenue minus the home's total operating expenses. A positive figure means it earns more from resident care than it spends to deliver it; a negative figure means the opposite. It excludes non-operating "other income."
-$995.5K
Other income Info Money the home earns outside of resident care — such as investments, grants, rentals and other non-operating sources (CMS cost report, Worksheet G-3). It is tracked separately from net patient revenue: it is not part of that figure, and it is not included in net patient income.
$276.3K
Payroll costs Info Staff salaries plus wage-related costs — benefits such as payroll taxes, health insurance and retirement — from the home's own accounting records (CMS cost report, Worksheet A). Contract or agency labor is counted separately, under other operating costs. Rank #80 / 96Payroll — State benchmarkedThis home is ranked 80th out of 96 homes in Massachusetts. Shows total annual staff payroll benchmarked to the Massachusetts average. Higher payroll investment relative to peers often signals better staffing and less reliance on cheaper contract labor.Ranking totals vary by category as each rank only includes facilities that report data for that metric. Homes missing that data point aren't included in the ranking.Click the rank badge to see the full State ranking.Click here to see the full State ranking.
$3.9M 46.7% of net patient revenue Info Payroll as a share of revenue: staff salaries and wage-related benefits divided by net patient revenue. A higher figure means more of each revenue dollar goes to staff pay. Rank #9 / 96Payroll % — State benchmarkedThis home is ranked 9th out of 96 homes in Massachusetts. Shows payroll as a percentage of revenue versus the Massachusetts average. Well-run Massachusetts facilities typically land around 54–65% — the top third Statewide. Below 25% may signal understaffing or heavy agency use — read with Staffing ratings.Ranking totals vary by category as each rank only includes facilities that report data for that metric. Homes missing that data point aren't included in the ranking.Click the rank badge to see the full State ranking.Click here to see the full State ranking.
Other operating costs Info Everything it costs to run the home apart from payroll — food, utilities, supplies, maintenance, contract labor and administration. Calculated as total operating expense minus payroll (staff salaries and wage-related benefits).
$5.5M
Total costs Info The home's total operating expense for the year — all the costs of running it, salaries included (CMS cost report, Worksheet G-3).
$9.4M

What does this home offer?

Pets allowed icon
Pets allowed icon

Pets Allowed

Room sizes icon
Room sizes icon

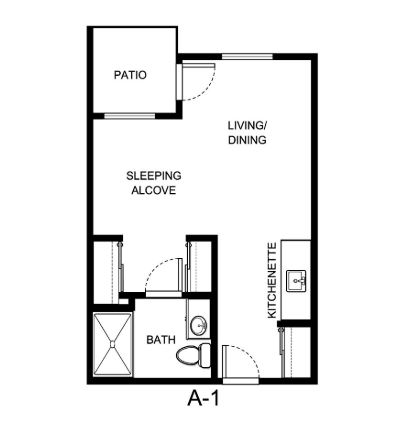
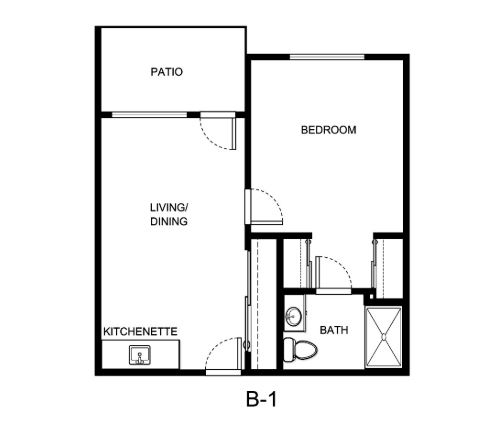
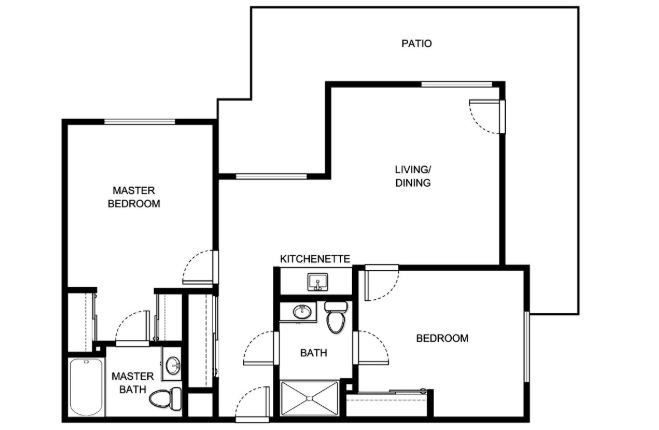
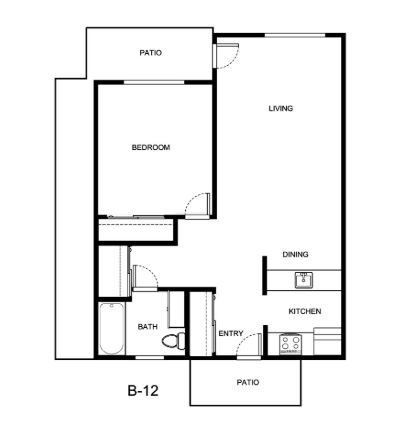
Room Sizes: 325 - 443 / 547 - 776 / 846 - 1270 / 1270 sq. ft.

Housing options icon

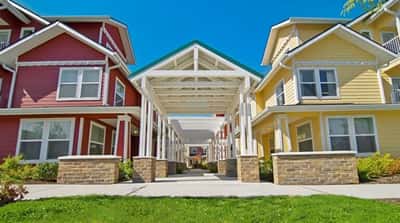
Housing Options: Studio / 1 Bed / 2 Bed / Cottage

Building type icon
Building type icon

Building Type: 3-story

Transportation services icon

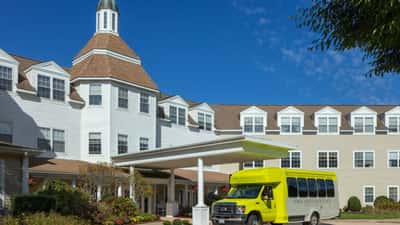
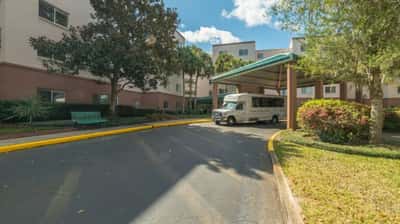
Transportation Services

Fitness and recreation icon

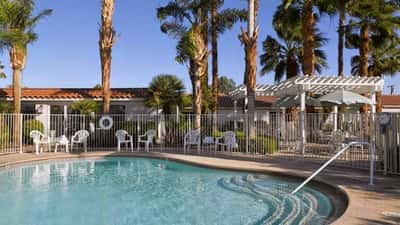
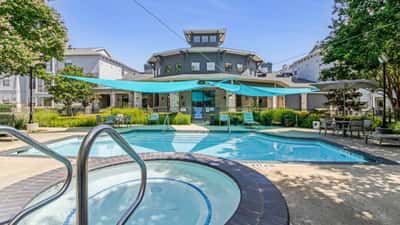
Fitness and Recreation

Type of Rooms Available

1 Bed
1 Bed
1 Bed
1 / 4
1 Bed
1
547 - 862 sq. ft

Who this home usually serves

TYPE OF STAY

Mostly short-term rehab stays

Most residents typically stay for a few weeks or months before returning home or moving on.

Most new residents arrive under Medicare (56% of admissions), and a typical Medicare stay runs around 1 - 2 months.

Admissions
198 total

Coverage residents most often arrive under.

Medicare 56%
Private pay 31%
Medicaid 13%
Discharges
204 total

Coverage residents most often leave under.

Medicare 48%
Private pay 46%
Medicaid 7%

Living Spaces & Floor Plans for Holiday Devonshire Estates

Devonshire P1
Devonshire P2
Devonshire P3
Devonshire P4
Studio Floor Plan
Download PDF
One Bedroom Floor Plan
Download PDF

Places of interest near Holiday Devonshire Estates

Address 3.0 miles from city center Info Estimated distance in miles from Lenox's city center to Holiday Devonshire Estates's address, calculated via Google Maps. — 1.35 miles to nearest hospital (Lenox Commons)

Calculate Travel Distance to Holiday Devonshire Estates

Add your location

Address

Financial Assistance for
Independent Living in Massachusetts

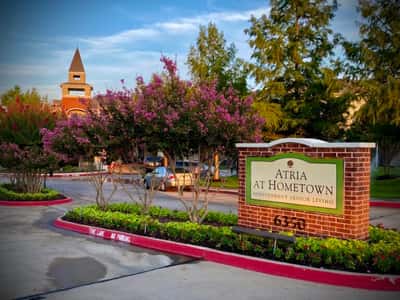
Holiday Devonshire Estates is located in Lenox, Massachusetts.
Here are the financial assistance programs available to residents in Massachusetts.

Get Financial aid guidance

Home Care Program

MassHealth Home Care

Age 60+
General Massachusetts resident, at risk of nursing home placement.
Income Limits (2025) ~$1,500/month individual, varies by region
Asset Limits $2,000 individual, excludes home, car
MA

Coordinated through Aging Services Access Points (ASAPs); high demand in urban areas.

Benefits
In-home care (3-5 hours/day) Homemaker services Respite care (up to 14 days/year) Adult day care (~$75/day)

Frail Elder Waiver

Massachusetts Medicaid FE Waiver

Age 65+
General Massachusetts resident, Medicaid-eligible, nursing home-level care need.
Income Limits (2025) ~$2,829/month 300% FBR, individual
Asset Limits $2,000 (individual), $3,000 (couple).
MA

Requires clinical eligibility determination.

Benefits
Personal care (5-7 hours/day) Respite care (240 hours/year) Adult day care (~$75/day) Home health services

Senior Care Options (SCO)

Massachusetts Senior Care Options

Age 65+
General Massachusetts resident, eligible for MassHealth (Medicare optional), nursing home-level care need.
Income Limits (2025) ~$2,829/month (300% FBR, individual); QIT allowed.
Asset Limits $2,000 (individual), $3,000 (couple) (excludes home up to $713,000, car).
MA

Not available in Dukes/Nantucket Counties; multiple SCO providers (e.g., CCA, Tufts).

Benefits
Personal care (5-7 hours/day) Medical care Respite (240 hours/year) Adult

Medicare Savings Program (MSP)

Massachusetts Medicare Savings Program (MassHealth Buy-In)

Age 65+ or disabled
General Massachusetts resident, Medicare Part A/B.
Income Limits (2025) ~$2,510/month (QMB), ~$3,380/month (SLMB), ~$3,598/month (QI)—individual.
Asset Limits $9,430 (individual), $14,130 (couple).
MA

Three tiers; no waitlist; includes Extra Help for Part D.

Benefits
Covers Part B premiums ($174.70/month) Deductibles ($240/year) Copays (~20%)

National Family Caregiver Support Program (NFCSP) Respite

Massachusetts NFCSP Respite Care

Age
General Caregivers of 60+ needing care or 55+ caregivers of others; Massachusetts resident; functional needs (2+ ADLs).
Income Limits (2025) Prioritizes ~$24,980/year (individual); no strict cap.
Asset Limits Not assessed; need-based.
MA

27 ASAPs; prioritizes low-income, rural caregivers.

Benefits
Respite (4-6 hours/week or 5 days/year) Adult day care ($60/day) Caregiver training Supplies (~$500/year)

Prescription Advantage

Massachusetts Prescription Advantage

Age 65+ or disabled
General Massachusetts resident, enrolled in Medicare Part D (or ineligible for Medicare).
Income Limits (2025) No strict limit; copays vary by income ~$24,980-$75,000/year individual
Asset Limits Not assessed.
MA

Supplements Medicare Part D; no enrollment fee for low-income.

Benefits
Covers prescription copays ($5-$40/drug) Fills coverage gaps Catastrophic cost protection ($4,000+ covered)

VA Aid and Attendance (A&A) and Housebound Benefits

Massachusetts VA Aid and Attendance/Housebound

Age 65+ or disabled veteran/spouse
General Massachusetts resident, wartime service, need for ADL help (A&A) or homebound.
Income Limits (2025) Net income < ~$1,984/month (veteran with dependent, A&A); pension offsets income.
Asset Limits ~$155,356 net worth limit
MA

High veteran demand statewide.

Benefits
Cash (~$1,433-$2,642/month veteran, ~$951-$1,318 spouse) for care costs (e.g., in-home, assisted living)

More homes from the same operator

Operated by Atria

Frequently Asked Questions about Holiday Devonshire Estates

Is Holiday Devonshire Estates in a walkable area?

Holiday Devonshire Estates has a walk score of 30. Somewhat walkable. A few nearby services may be reachable on foot, but most trips require transportation.

What is the occupancy rate at Holiday Devonshire Estates?

Holiday Devonshire Estates's occupancy is 93.7%.

Does Holiday Devonshire Estates have different floorplan options?

Yes — see the floorplan options available at Holiday Devonshire Estates on this page.

Are there photos of Holiday Devonshire Estates?

Yes — there are 4 photos of Holiday Devonshire Estates in the photo gallery on this page.

What is the phone number of Holiday Devonshire Estates?

(413) 637-1700 will put you in contact with the team at Holiday Devonshire Estates.

Is Holiday Devonshire Estates Medicare or Medicaid certified?

Yes — Holiday Devonshire Estates is a CMS-certified provider of Medicare and Medicaid.

Guides for Better Senior Living

Care Cost Calculator: See Prices in Your Area

Nursing Home Data Explorer

Don’t Wait Too Long: 7 Red Flag Signs Your Parent Needs Assisted Living Now

The True Cost of Assisted Living in 2025 – And How Families Are Paying For It

Understanding Senior Living Costs: Pricing Models, Discounts & Financial Assistance